Fig. 3.
Download original image
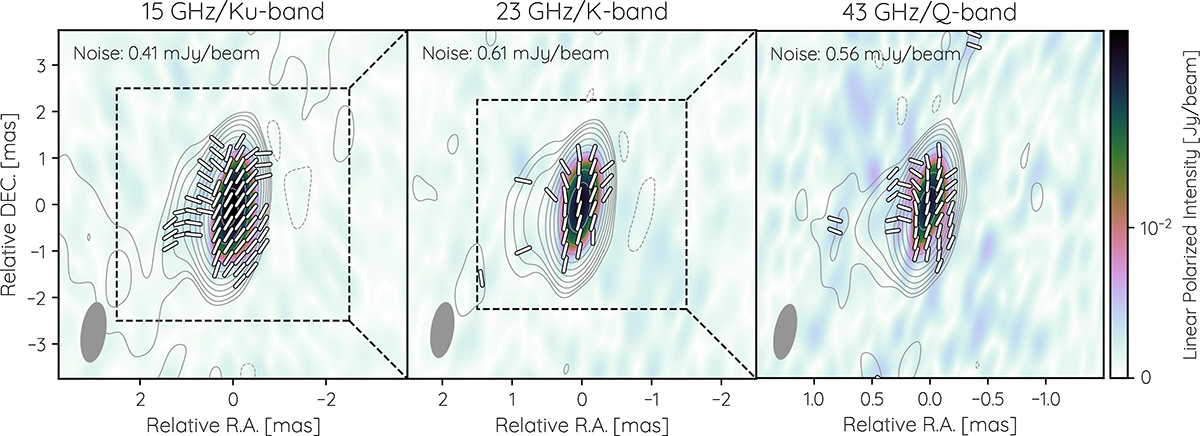
Stacked polarization images at 15 GHz (left), 23 GHz (center), and 43 GHz (right). Before stacking, the individual images were convolved with the median beam (indicated by the gray ellipse) at each frequency separately. Contours show the total intensity, starting at four times the noise level and increasing by factors of two. The color map displays linear polarization, and the sticks indicate the direction of the EVPA.
Current usage metrics show cumulative count of Article Views (full-text article views including HTML views, PDF and ePub downloads, according to the available data) and Abstracts Views on Vision4Press platform.
Data correspond to usage on the plateform after 2015. The current usage metrics is available 48-96 hours after online publication and is updated daily on week days.
Initial download of the metrics may take a while.