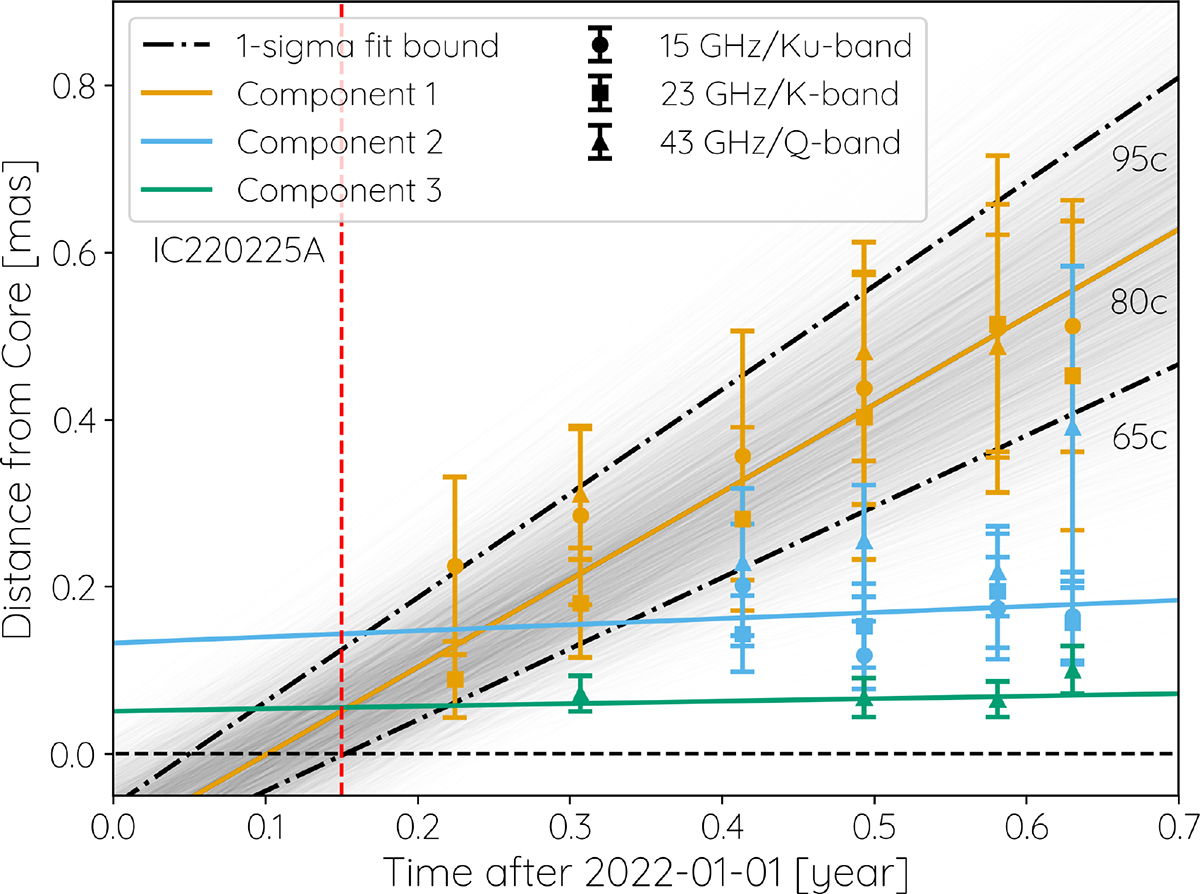
Fig. 7.
Download original image
Combined kinematic fit from 15 GHz, 23 GHz, and 43 GHz for component 1, 2, and 3. The solid line indicates the best fit. For component 1, the dash-dotted lines represent the 1σ fit bounds, and the shaded area in the background reflects the confidence range of the fit. The time of arrival of the neutrino event IC220225A is indicated by the dashed red line and coincides with the passage of component 1 through component 3.
Current usage metrics show cumulative count of Article Views (full-text article views including HTML views, PDF and ePub downloads, according to the available data) and Abstracts Views on Vision4Press platform.
Data correspond to usage on the plateform after 2015. The current usage metrics is available 48-96 hours after online publication and is updated daily on week days.
Initial download of the metrics may take a while.