| Issue |
A&A
Volume 699, July 2025
|
|
|---|---|---|
| Article Number | A117 | |
| Number of page(s) | 8 | |
| Section | Stellar structure and evolution | |
| DOI | https://doi.org/10.1051/0004-6361/202554671 | |
| Published online | 02 July 2025 | |
CGCS 6306, another X-ray-emitting asymptotic giant branch star confirmed to be a symbiotic binary
1
Astronomical Institute of Charles University, V Holešovičkách 2, Prague 18000, Czech Republic
2
Instituto de Astrofísica de Canarias, Calle Vía Láctea, s/n, E-38205 La Laguna, Tenerife, Spain
3
Instituto de Astrofísica de Andalucía, IAA-CSIC, Glorieta de la Astronomía S/N, Granada 18008, Spain
4
Instituto de Radioastronomía y Astrofísica, Universidad Nacional Autónoma de México, Morelia, 58089 Mich., Mexico
5
Escola de Artes, Ciências e Humanidades, USP, Av. Arlindo Bettio 1000, 03828-000 Sâo Paulo, Brazil
⋆ Corresponding author: This email address is being protected from spambots. You need JavaScript enabled to view it.
Received:
20
March
2025
Accepted:
29
May
2025
Abstract
Context. A number of asymptotic giant branch (AGB) stars are known to exhibit UV excess and/or X-ray emission. These have been considered signposts of a hot white dwarf (WD) companion in a symbiotic system (SySt), but AGB stars are so bright that they easily outshine these companions, thus hampering their detection at optical wavelengths. A recent multi-wavelength investigation on the X-ray-emitting AGB (X-AGB) star Y Gem has confirmed the presence of a WD companion and therefore its SySt nature.
Aims. Our goal is to explore the true nature of another X-AGB star, namely CGCS 6306, to investigate whether some objects from this group may in fact be unnoticed SySts with AGB donors.
Methods. We analyzed optical spectra and photometric data together with X-ray observations to investigate the properties of the stellar components and accretion process in CGCS 6306.
Results. CGCS 6306 is a carbon Mira with a pulsation period of 362 days. Its optical spectrum exhibits the typical saw-shaped features of molecular absorptions in addition to H I and He I recombination and [O I] and [O III] forbidden emission lines. The Hα line profile is broad, which can be interpreted as evidence for an accretion disk. The X-ray spectrum is hard, which is typical of highly extincted hot plasma emission, and the X-ray luminosity is ≈1032 erg s−1.
Conclusions. The detection of high-excitation optical emission lines and the X-ray properties of CGCS 6306 confirm the presence of a WD companion, making it a bona fide δ-type X-SySt. Its X-ray luminosity is comparable to that of Y Gem, the other X-AGB star confirmed to be a SySt, which was found to exhibit a high accretion rate. The lack of suitable information on the UV and blue optical properties of CGCS 6306, however, precludes a definitive estimate of the accretion rate in this system. Since CGCS 6306 is a carbon Mira, our work adds it to the small group of Galactic carbon SySts.
Key words: accretion / accretion disks / stars: AGB and post-AGB / binaries: symbiotic / stars: mass-loss / X-rays: individuals: CGCS 6306
© The Authors 2025
 Open Access article, published by EDP Sciences, under the terms of the Creative Commons Attribution License (https://creativecommons.org/licenses/by/4.0), which permits unrestricted use, distribution, and reproduction in any medium, provided the original work is properly cited.
This article is published in open access under the Subscribe to Open model. This email address is being protected from spambots. You need JavaScript enabled to view it. to support open access publication.
1. Introduction
Asymptotic giant branch (AGB) stars are the late evolutionary stage of low- and intermediate-mass stars, occurring just before they expel their H-rich envelopes to become planetary nebulae (PNe) and continue their evolution as white dwarfs (WDs). While late-type dwarf stars are well known to exhibit coronal-powered X-ray emission (Ayres et al. 1981), AGB stars are not expected to possess coronae because of their large radii and slow rotation. Yet X-ray emission has been detected in 47 AGB stars (hereafter X-AGB stars; Guerrero et al. 2024).
The detection of X-ray emission in AGB stars is considered a signpost of binarity, with X-ray emission being produced in an accretion disk around a companion or in the corona of a late-type dwarf secondary (Ortiz & Guerrero 2021). The direct detection of the companion in the optical or infrared is, however, hampered by the overwhelming luminosity of the AGB star, even though far-UV emission or significant near-UV excess would hint at a companion (e.g., Ortiz & Guerrero 2016; Sahai et al. 2022). WD companions have been confirmed in a number of symbiotic stars (SySts) with AGB donors (e.g., StHa 32, RX Pup, R Aqr, and others; see the New Online Database of Symbiotic Variables and references therein, Merc et al. 2019a,b). It must be noted, though, that a number of AGB stars are classified as SySt candidates based only on their X-ray emission (see, e.g., the cases of CGCS 5926, OGLE BLG654.20 36111, or V371 CrA; Masetti et al. 2011; Hynes et al. 2014; Wetuski et al. 2021; Pavlinsky et al. 2022). These putative X-SySts thus can be included in the known sample of X-AGB stars, where the presence of a compact companion is so far unconfirmed.
The classical diagnostic for the SySt nature of a giant star relies on the detection of optical emission lines from species requiring a high ionization above 35 eV (e.g., He IIλ4686 Å, [Fe VII] λλ5727,6087 Å, or [O III] λ5007 Å) and/or O VI Raman-scattered lines at 6830 and 7088 Å (Mikolajewska et al. 1997; Belczyński et al. 2000; Miszalski et al. 2013; Merc et al. 2021; Merc 2025). We have recently used optical intermediate-dispersion spectroscopic observations to uncover the SySt nature of Y Gem (Guerrero et al. 2025), an AGB star with variable far-UV and very hard, as well as variable X-ray emission (Sahai et al. 2008; Ortiz & Guerrero 2021). Notably, the presence of a companion of Y Gem was also suggested by the flickering of its UV continuum (Sahai et al. 2018).
The final confirmation of Y Gem as a SySt indicates that the acquisition of high-quality optical spectra of X-AGB stars could be a new pathway to unveil compact companions wherever the giant star overshines it. To further strengthen this premise before starting a long-term project to acquire optical spectroscopy of X-AGB stars, we present here a second case study of a previously unexamined X-AGB star, namely CGCS 6306 (aka IRAS 08427+0338, Ortiz & Guerrero 2021), for which archival and new optical spectroscopy, in conjunction with new X-ray observations, confirm the presence of a WD companion accreting material from the giant component. This makes it a bona fide X-SySt. Very remarkably, CGCS 6306 is a carbon Mira, and it is included in the General Catalog of Galactic Carbon Stars (Alksnis et al. 2001) due to the detection of C-rich features in its optical and infrared spectrum (Cohen et al. 1996). Therefore, CGCS 6306 can be included among the exclusive group of Galactic carbon SySts.
The paper is organized as follows. The new and archival optical spectroscopic and photometric observations and the X-ray observations of CGCS 6306 are described in Sect. 2. The results based on the analyses of these observations are presented in Sect. 3. The discussion and final remarks are provided in Sects. 4 and 5.
2. Observations
2.1. X-ray observations
On 2010 April 30, CGCS 6306 was serendipitously observed by XMM-Newton using the European Photon Imaging Camera (EPIC) when targeting the cluster of galaxies MACS J0845+03 (PI: S. Allen, Obs. ID. 0650381601; Webb et al. 2020). The total exposure times of the EPIC pn, MOS1, and MOS2 cameras were 6.8, 8.4, and 8.4 ks, respectively. The data were processed using the Science Analysis Software (SAS version 17.0; Gabriel et al. 2004). The event files were processed using the epproc and emproc SAS tasks. After excising bad periods of time, the net exposure times for the MOS1 and MOS2 cameras resulted in 4.9 and 4.6 ks, respectively. As for the EPIC pn camera, the bad period screening resulted in a not useful, too short exposure time. A preliminary analysis of the XMM-Newton data on CGCS 6306 was presented by Ortiz & Guerrero (2021).
The cluster of galaxies MACS J0845+03 has recently been targeted by the Chandra X-ray Observatory (CXO) using the Advanced CCD Imaging Spectrometer (ACIS) array on 2023 December 28 and 2024 January 5 (PI: A.D. Goulding) with total exposure times of 11.95 and 15.54 ks, corresponding to Obs. ID. 29163 and 26729, respectively. CGCS 6306 was once again serendipitously registered in these observations located close to the aimpoint of the back-illuminated CCD S3. The CXO data were reprocessed with the Chandra Interactive Analysis of Observations (CIAO, version 4.14, Fruscione et al. 2006) using the chandra_repro task. No time periods of enhanced background emission were detected by inspecting background light curves in the 5.0–10.0 keV, which results in net exposure times equal to the total exposure times.
The new CXO observations with a spatial resolution higher than those obtained by XMM-Newton confirm the presence of a point-source of X-ray emission at the location of CGCS 6306 (left panel of Fig. 1). The count rates at different energy bands are listed in Table 1 for the two CXO observations, and we include those derived from the XMM-Newton EPIC MOS1 and MOS2 data sets for comparison. Its X-ray emission is shown to be notably hard, with no counts below 2.0 keV, as also shown in the CXO color-composite picture in the right panel of Fig. 1.
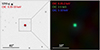 |
Fig. 1. Left: Inverted grayscale g-SDSS image of CGCS 6306 overlaid with CXO ACIS-S X-ray contours in red. The field of view is 2′×2′. Right: Color-composite CXO X-ray picture (R = 0.35 − 2.0 keV, G = 2.0 − 5.0 keV, B = 5.0 − 9.0 keV). The field of view is 30″ × 30″. In both images, north is up and east is to the left. |
XMM-Newton and Chandra CGCS 6306 X-ray count rates.
2.2. Optical spectroscopy
The X-AGB star CGCS 6306 was observed by the Large Sky Area Multi-Object Fiber Spectroscopic Telescope (LAMOST) survey (Cui et al. 2012; Zhao et al. 2012), where its designation is LAMOST J084522.25+032711.5. The spectrum, with a resolution of R ∼ 1800, was obtained on 2015 March 11 near a minimum of the stellar light curve (Fig. 2) with a total exposure time of 4500 s and is available in LAMOST DR4.
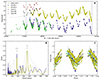 |
Fig. 2. Photometry of CGCS 6306. A: Light curves from ASAS-SN, ATLAS, and Gaia. The dotted gray sinusoidal line represents the apparent long-term variability trend. The vertical lines in the light curves mark the observation time of the LAMOST (2015 March 11) and NOT/FIES (2025 February 25) spectra. B: Lomb-Scargle periodograms of the photometric data. Due to the short time span of ASAS-SN and GaiaG observations, their periodograms are shown as dotted lines only. C: Phase-folded light curves of CGCS 6306. The long-term sinusoidal trend has been removed, and the median magnitude was subtracted for clarity. |
High-dispersion spectra of CGCS 6306 were acquired using the FIbre-fed Echelle Spectrograph (FIES) at the Nordic Optical Telescope (NOT) of the Observatorio del Roque de los Muchachos (La Palma, Spain) on 2025 February 25 at UT 23:42 to 00:36. The back-illuminated CCD231-42 2048 × 2064 CCD #15 of e2v Technologies was used. Its pixel size of 15 μm together with the low-resolution F1 fiber bundle used during these observations provide a spectral dispersion of 0.0261 Å pixel−1 and a spectral coverage from 3630 to 9270 Å. The spectral resolution is R ∼ 25 000. Three 1040 s exposures were obtained under optimal sky transparency and seeing (≃1.0 arcsec) conditions. Similar to the LAMOST observations, the NOT FIES spectrum was also obtained at an epoch near a minimum of the stellar light curve (Fig. 2).
2.3. Photometric observations
We compiled photometric data for CGCS 6306 from several surveys, including information in the V and g filters from the All-Sky Automated Survey for Supernovae (ASAS-SN; Shappee et al. 2014; Kochanek et al. 2017); in the non-standard c and o filters from the Asteroid Terrestrial-impact Last Alert System1 (ATLAS; Tonry et al. 2018; Smith et al. 2020); and in the G, BP, and RP bands of Gaia (Gaia DR3; Gaia Collaboration 2023a). The ASAS-SN observations in the g band mostly yielded non-detections, so we excluded them from further analysis.
3. Results
3.1. Optical variability, luminosity, and distance
In the Northern Sky Variability Survey, CGCS 6306 has been identified as a long-period variable (LPV) 0845224+032712 (Woźniak 2004) with P = 288 days (Woźniak et al. 2004). Subsequent I photometric monitoring indicated a longer period of 325 days (Mauron et al. 2014), whereas even longer periods of 348.5 days and 386 days are listed in the ATLAS survey (Heinze et al. 2018) and ASAS-SN catalog of variable stars (Jayasinghe et al. 2018), respectively. Finally, Lebzelter et al. (2023) used GaiaG band data to obtain a period of 370 ± 28 days.
We used ASAS-SN V; ATLAS c and o; and GaiaG, BP, and RP observations spanning about 12 years (top panel of Fig. 2) to investigate the optical variability of CGCS 6303. To analyze the periodicity, we applied the Lomb-Scargle method (Lomb 1976; Scargle 1982) using the astropy Python package (Astropy Collaboration 2013, 2018, 2022). The combined light curves display a short-term variability of ≃2 mag overimposed on a long-term ≃1 mag modulation. The latter implies a period of ≃7 yr, whereas our period analysis of ATLAS c and o observations led to a period of 361.9 ± 19.3 days and 362.6 ± 19.3 days, respectively (see panel B of Fig. 2). Analysis of ASAS-SN V and GaiaG band data yielded similar results (365.3 ± 30.7 days and 362.0 ± 70.4 days, respectively). However, the uncertainties are significantly larger due to the much shorter time span of the data. We adopted the average values from ATLAS c and o, 362 ± 14 days, as the final period. The large amplitude, almost sinusoidal variation, and long period of the light curve of CGCS 6306 are typical of a pulsating Mira-type variable.
The origin of the longer ≈7 yr periodicity is unclear. Many LPVs, mainly OGLE small-amplitude red giants (OSARGs) but also semi-regular variables (SRVs), exhibit so-called long secondary periods (LSPs). Although LSPs have been known for a long time, their origin remains uncertain. One proposed explanation is non-radial pulsations, but it is not yet clear whether the same phenomenon observed in OSARGs and SRVs is also present in Miras in general (e.g., Pawlak 2023) and in CGCS 6306 in particular. Alternatively, LSPs have been attributed in some cases to binarity (see, e.g., Wood et al. 2004; Soszyński et al. 2021; Pawlak et al. 2024, and references therein), as was also the case for Y Gem (Guerrero et al. 2025). In SySts, orbital periods are often detectable in photometry, either due to the reflection effect and asymmetric nebulae or ellipsoidal variability when the giant is (close to) filling its Roche lobe (e.g., Munari 2019). As for CGCS 6306, the contribution of nebular emission does not appear to be strong enough to produce variability.
If the observed variability were caused by tidal deformation of the giant, this would suggest an orbital period approximately twice as long (≈14 years), but it would imply an unlikely large stellar radius, ∼1000 R⊙, for a carbon giant (with a typical radius two to three times smaller; e.g., Dyck et al. 1996; van Belle et al. 1997, 2013) that is inconsistent with the inferred luminosity (see below). In addition, the observed magnitude amplitude, Δm ≈ 1 mag, appears too large for ellipsoidal variability (see, e.g., Fig. 10 in Gaia Collaboration 2023b).
As CGCS 6306 is a pulsating Mira-type variable, its absolute bolometric magnitude and luminosity can be derived from period-luminosity (P–L) relationships derived for Galactic carbon Miras, such as those provided by Groenewegen & Whitelock (1996),
 (1)
(1)
 (2)
(2)
The average value implies a luminosity of 5.3 × 10³ L⊙, and this result is similar to that of Lagadec et al. (2012), who modeled the spectral energy distribution using fluxes derived from the near-infrared photometry obtained by the 2MASS and WISE all-sky surveys (Cutri et al. 2003; Wright et al. 2010) and the mid-infrared spectroscopy by Spitzer. The infrared flux densities were fit using the DUSTY code (Ivezic et al. 1999) to obtain a luminosity of L = 7.5 × 10³ L⊙. A mass-loss rate and an expansion velocity of the circumstellar dust shell of  yr−1 and Vexp = 16.5 km s−1, respectively, are derived from CO (J = 3 − 2) observations.
The distance toward CGCS 6306 cannot be derived from similar P–MK relationships because the 2MASS K magnitude of 6.255 ± 0.020 mag was obtained near minimum, and the variation of the amplitude in this band is not known, but it is certainly large given the observed amplitude of variability of ≈1 mag in the WISE W1 and W2 bands or as reported for the R and I bands (Woźniak et al. 2004; Mauron et al. 2014). The distance can instead be derived from its Gaia DR3 parallax, resulting in a value of 3.8 ± 0.5 kpc, which has been revised down to 3.4 ± 0.4 kpc by Bailer-Jones et al. (2021). The height over the Galactic plane of CGCS 6306 (l = 223.49°, b = +26.82°) would be 1.53 ± 0.18 kpc. The interstellar reddening along this direction, close to the Galactic anticenter and high over the Galactic plane, is very low: E(B − V) = 0.042 (or AV = 0.13 mag, assuming RV = 3.1, Schlegel et al. 1982).
The position of CGCS 6306 in the Galaxy, at the distance of 3.4 kpc and displaced 1.5 kpc from the Galactic plane, indicates that the star is possibly a member of the thick disk (Lagadec et al. 2012) or the halo population (Mauron et al. 2007; Mauron 2008). According to Mauron et al. (2014), the population of C-rich AGB stars in the halo could be the result of the disruption of satellite dwarf galaxies, such as the dwarf Sgr.
3.2. Optical spectra
The low-resolution spectrum of CGCS 6306 presented by Cohen et al. (1996) enabled its classification as a carbon star of spectral type C6,4. The authors also reported Hα emission2 and a flat blue spectral shape, which they suggested was reminiscent of a hot companion.
The archival LAMOST and our NOT FIES spectra of CGCS 6306 (Fig. 3) display a number of emission lines in addition to the Hβ and Hα H I Balmer lines overimposed on a late-type stellar continuum. The emission lines identified in the LAMOST spectrum are [O III] λλ4959,5007 Å and He Iλ5876 Å, whereas those in the NOT FIES spectrum are He Iλ5876 Å and [O I] λλ6300,6363 Å.
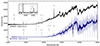 |
Fig. 3. LAMOST and NOT FIES optical spectra of CGCS 6306. The spectra have been shifted vertically by a constant. A running window median filter was applied to the NOT FIES spectrum for clarity. Detected prominent emission lines are marked by vertical lines. Telluric lines are marked as well. |
Compared to the stellar continuum, the intensity of the Balmer lines is notably brighter on the LAMOST spectrum than on the NOT FIES spectrum 10 years later. Otherwise, the different emission lines detected in the LAMOST and NOT FIES spectra do not necessarily indicate variability. The [O III] emission lines detected by LAMOST are too faint to be detected in the NOT FIES spectrum, whereas the detection [O I] emission lines in the latter spectrum has been allowed by its high dispersion, which deblends the stellar and telluric contributions of these lines. We emphasize that the detection of these faint nebular lines has been favored by the acquisition of the LAMOST and NOT FIES optical spectra at epochs near the minimum of the stellar light curve.
The high-dispersion NOT FIES spectrum reveals that the Hα emission line profile (Fig. 4-top) does not show a central absorption (Ikeda & Tamura 2004) nor a P Cygni profile (Izumiura et al. 1999; McKeever et al. 2011), unlike most SySts, but it does resemble a Gaussian curve showing wings up to ≈120 km s−1. The [O I] emission lines are wide as well (Fig. 4-bottom), with a full width half maximum (FWHM) of 70 km s−1, compared to that of 110 km s−1 for Hα. The Hα profile can be interpreted as the contribution of two components at velocities ±65 km s−1 according to expression
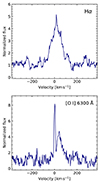 |
Fig. 4. Zoom-in view of the Hα (top) and [O I] λ6300 Å (bottom) emission lines in the NOT FIES spectrum. Velocities are given with respect to the Heliocentric frame. The narrow blue component of the [O I] λ6300 Å emission line at ≈0 km s−1 corresponds to a telluric contribution. |
 (3)
(3)
3.3. X-ray spectroscopy
The spectra extraction from the CXO ACIS S3 observations was performed from a circular aperture region with a radius of 3.0 centered on CGCS 6306. The background spectrum was selected from a set of larger circular regions free from background sources around CGCS 6306 and with similar distances to the core of MACS J0845+03 to obtain a fair representation of its diffuse emission. The source and background spectra were produced by making use of the specextract CIAO task, which simultaneously produces all necessary calibration files. The background-subtracted CXO ACIS spectra of CGCS 6306 derived from the 2023.99 and 2024.01 observations are presented in Fig. 5.
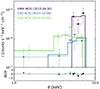 |
Fig. 5. Background-subtracted X-ray spectra of CGCS 6306. Different symbols show the spectra from different epochs. The solid lines show the best-fit models described in Table 2. We note that the spectrum labeled as MOS is the combination of the MOS1 and MOS2 spectra. |
Given the larger PSF of XMM-Newton EPIC instruments (PSF ∼ 6″) compared to that of the CXO ACIS (PSF ∼ 1″), we extracted the spectrum of CGCS 6306 using a circular aperture of 13 in radius. The background was selected following a similar approach as that for the CXO observations. Spectra from the two MOS cameras were extracted using the SAS task evselect, and their associated calibration files were produced using the rmfgen and arfgen tasks. Finally, a single MOS spectrum was produced by combining the MOS1 and MOS2 spectra with the SAS task epicspeccombine. The combinedbackground-subtracted MOS spectrum is plotted in Fig. 5 alongside those obtained from the CXO observations.
Figure 5 shows that the X-ray spectra of CGCS 6306 have been consistently hard for the past 14 years, with the bulk emission peaking at E > 5 keV and an absent contribution at softer energies. The latter is suggestive of a highly extinguished hard X-ray emission. To assess the physical properties of the X-ray emission detected from CGCS 6306, we modeled the X-ray spectra using the X-ray spectral fitting package XSPEC (version 12.12.1; Arnaud 1996). We adopted a optically thin plasma emitting model, apec3, with solar abundances (Anders & Grevesse 1989). The extinction was considered by making use of the tbabs component included in XSPEC (Wilms et al. 2000). Consequently, each spectrum was characterized by a plasma temperature kT and an averaged hydrogen column density NH. The quality of the model was evaluated through the reduced χ2 statistics (χDoF2) directly provided by XSPEC.
The results of the spectral analysis are summarized in Table 2. The extinction was better characterized in the CXO spectrum from 2024.01, given its slightly superior count rate compared to the other two spectra. Given the limited count number, the plasma temperature was fixed at 10 keV. According to the spectral modeling, the flux of the two CXO epochs is consistent. The estimated intrinsic flux from the XMM MOS data seems a bit larger, but it is still marginally consistent with that estimated for the CXO data from 2023.99 within error values. Given the quality of the XMM data, we can safely argue that the X-ray flux seems to have remained constant. Adopting a constant flux of FX ≈ (2 ± 1)×10−13 erg cm−2 s−1, the X-ray luminosity can thus be estimated to be LX ≈ (2.8 ± 1.4)×1032 erg s−1 for an assumed distance of d = 3.4 kpc.
Results of the spectral analysis performed with XSPEC.
4. Discussion
4.1. Optical spectrum
The optical spectra of AGB stars may present Fe II emission lines irrespective of the Mira, SR-type, and L-type class of variability, but the H I Balmer series appear in emission only in the spectrum of Mira-type variables. The origin of both Fe II and H I lines can be attributed to shocks propagating in the star’s upper atmosphere (Fox et al. 1984; Richter & Wood 2001), but their intensities are highly variable along the Mira pulsation cycle, as they are practically absent at stellar minimum and increase in intensity when the star approaches the maximum of its light curve, remaining strong until it completes one-third of its period (Guerrero & Ortiz 2020). Thus, the acquisition of spectra of suspected SySts at the minimum of the pulsation cycle of the giant component not only favors the detection of faint nebular lines, such as those of [O I] and [O III] in CGCS 6306, which might be completely outshone at maximum light, but it also discards the origin of Balmer lines in the giant photosphere. This supports the classification of CGCS 6306 as a bona fide SySt, as its optical spectra fulfill the traditional criteria for SySt classification, as outlined in the introduction section. Moreover, the position of the star in the [O III] diagnostic diagram (Gutierrez-Moreno et al. 1995; Iłkiewicz & Mikołajewska 2017) further confirms its symbiotic nature ([O III] λ4363/Hγ = 0.30 and [O III] λ5007/Hβ = 0.32).
The emission lines observed in the spectrum of CGCS 6306 (Hα, Hβ, HeIλ5876 and [O I] λλ6300,6363) show some similarities with those observed in the spectrum of RS Oph (i.e., the Balmer series, He Iλ5876 and [O I] λ6300, Brandi et al. 2009), a recurrent symbiotic nova star, during its quiescence phase. Recombination lines such as the Balmer series are generally formed in SySts close to the secondary star, which acts as a photoionization source (Contini 1997). The high electron density in this region (Ne > 106 cm−3) would suppress the formation of some forbidden lines, which are generally formed farther away from the secondary, where the density is lower (between 104 and 106 cm−3, Arrieta & Torres-Peimbert 2003). However, CGCS 6306 unexpectedly shows broad [O I] λλ6300,6363 profiles, with WFWHM ≈ 70 km s−1, which is comparable to the width of the Hα line, WFWHM ≈ 110 km s−1 (Fig. 4). Therefore, differently from most SySts, the [O I] doublet seems to be formed in a relatively dense gas, with Ne ≃ 106 cm−3. Actually, the critical density of this doublet is one of the highest among the nebular lines commonly observed in SySts and PNe (Ncrit = 2 × 106 cm−3, Appenzeller & Östreicher 1988). On the other hand, the spectral resolution of the available LAMOST spectrum detecting the [O III] emission lines is not sufficient to determine their width and thus to assess their possible origin in the accretion disk. Nevertheless, the extremely low ratio of the [O III] λ5007 nebular line to the [O III] λ4363 auroral line, ≈2.4, is indicative of a high density. Although this cannot be firmly assessed due to the unknown extinction and electron temperature, reasonable assumptions suggest that the density is at least five times higher than the critical density of 6.3 × 105 cm−3 for the [O III] λλ4959,5007 emission lines. The high density of the emitting region is further supported by the non-detection of the [S II] λλ6716,6731 doublet, which have critical densities of 1.6 × 10³ and 4.0 × 103 cm−3, respectively.
If we assume an accretion disk with Keplerian rotation, the velocity of material rotating in a circular orbit at radius R around the secondary star with mass M is described (Arrieta & Torres-Peimbert 2003; Brandi et al. 2009) as
 (4)
(4)
where V is in kilometers per second, and M and R are given in solar units. Assuming a typical mass of a white dwarf, M = 0.6 M⊙, and adopting a rotation velocity of 90 km s−1 correcting the velocity derived from the FWHM of the Hα line profile for an inclination angle of 45°, a disk radius of 14 R⊙ (= 0.065 AU = 1.0 × 1012 cm) is obtained. This radius is most likely representative of the bulk of the Hα emitting material in the disk.
4.2. X-ray properties
The SySt nature of CGCS 6306 and the X-ray properties of its spectrum classify it as a δ-type X-SySt under the scheme originally proposed by Mürset et al. (1997) and later extended by Luna et al. (2013). These systems are characterized by a heavily extinguished plasma with a hard X-ray-emitting spectrum.
The X-ray luminosity of CGCS 6306 is also typical of δ-type and β/δ-type X-ray-emitting SySts of the order of 1032 erg s−1 (see Figure 5 of Guerrero et al. 2024). If the X-ray emission is the result of accretion, Guerrero et al. (2024) estimate the mass accretion rate for those X-ray luminosities to be  M⊙ yr−1, adopting a typical radius and mass for the accreting WD of 0.01 R⊙ and 0.6 M⊙, respectively. However, this estimate is solely based on the X-ray luminosity, and it does not account for the disk luminosity that is preferentially detected in the UV and in the bluest optical regions. Cohen et al. (1996) noted a possible contribution to the spectrum of CGCS 6306 in the blue region of its optical spectrum, whereas the GALEX NUV absolute magnitude (≃10 mag at the distance of 1.53 kpc) seems to imply UV emission excess (Ortiz & Guerrero 2016), although it cannot be confirmed since there are no available GALEX FUV observations of CGCS 6306. Thus the present estimate of the accretion rate onto the WD companion of CGCS 6306 should be regarded as a lower limit.
4.3. CGCS 6306 as a rare carbon Mira SySt
We note that CGCS 6306 belongs to a small group of carbon-rich SySts in the Milky Way. Among the known Galactic carbon SySts, five are reported to host Mira-type pulsating components. The giant in V1196 Sco (= AS 210, with a pulsation period PMira = 423 day, Merrill & Burwell 1950; Henize 1967; Allen 1978); SS73 38 (PMira = 463 day, Sanduleak & Stephenson 1973; Whitelock 1987; Gromadzki et al. 2009); H1-45 (PMira = 409 day, Miszalski et al. 2013); UV Aur4 (PMira = 394 day, Sanford 1950; Seal 1988; Luna et al. 2013; Gal & Szatmary 1995); and IPHAS J205836.43+503307.2 (Corradi et al. 2011), which has been suggested as a likely member of this group, but its pulsation period has not yet been reported. In addition to these confirmed cases, several SySt candidates are listed in the New Online Database of Symbiotic Variables, including IRAS 18120+4530, a carbon Mira (PMira = 392 day, Gigoyan et al. 2014) that exhibits Hα, Hβ, and [O III] emission lines in its optical spectrum (Mauron 2008), and OGLE-BLG-LPV-145820, which shows Hα, [O II], and He I in its spectrum, although the available spectral coverage is limited to the 5600–9200Å range (PMira = 600 day, Matsunaga et al. 2017). Another system frequently mentioned in the literature as a possible SySt is V335 Vul, a carbon Mira (PMira = 347 day, Sobotka et al. 2003) whose symbiotic nature was proposed by Munari et al. (1999) after detecting Balmer lines in its optical spectrum and an apparent outburst. However, Sobotka et al. (2003) suggested that the observed variability was due to a pulsational maximum rather than an actual outburst, leaving the symbiotic classification of V335 Vul uncertain.
As currently listed in the New Online Database of Symbiotic Variables, there are only ten confirmed carbon-rich SySts in the Milky Way. This constitutes a small fraction of the ∼300 known Galactic symbiotic stars (Merc et al. 2019a,b; Akras et al. 2019), in contrast to the Large and Small Magellanic Clouds, where carbon SySts are more prevalent. This difference is probably linked to the lower overall metallicity of the Magellanic Clouds, which facilitates more efficient third dredge-up episodes during the AGB phase, allowing stars to develop carbon-rich atmospheres more easily (Karakas et al. 2002; Mouhcine & Lançon 2003; Shetye et al. 2021).
5. Final remarks
The X-ray emission from CGCS 6306 (Guerrero & Ortiz 2020), as that of many other X-AGB stars (Guerrero et al. 2024), makes it a SySt candidate. As for the case of Y Gem (Guerrero et al. 2025), the acquisition of optical spectroscopic observations of CGCS 6306 has revealed the presence of high-excitation emission lines that disclose a nebula ionized by a hot component. Archival long-term photometric observations confirm a Mira-type pulsation period of 362 days, making CGCS 6306 one of the very few Galactic carbon Mira SySts. There is another long-term period, ≈7 yr, present in the light curve, but its possible association with an orbital origin is unknown. Follow-up observations are necessary to confirm this link.
The X-ray properties of CGCS 6306, with a hard spectrum typical of highly extincted hot plasma emission and an X-ray luminosity of ≈1032 erg s−1, are consistent with those of δ-type X-SySts. Its X-ray luminosity (≈0.07 L⊙) is actually comparable to that of Y Gem (≈0.12 L⊙). The broad Hα profile in CGCS 6306 has been used to derive a characteristic accretion disk radius of ≈14 R⊙, while its X-ray luminosity has allowed us to determine a lower limit to the accretion rate of ≳10−11 M⊙ yr−1. This accretion rate is about 20 000 times smaller than that inferred for Y Gem, but we note that the accretion rate in Y Gem is mostly based on the luminosity of its accretion disk, which is ≳200 times larger than its X-ray luminosity. Unfortunately the contribution to the accretion rate from the luminosity of the accretion disk of CGCS 6306 is unknown since it ought to be derived from UV and blue optical observations, which are either not available or not sufficiently restrictive.
We would like to emphasize the advantages that the acquisition of optical spectroscopic observations carried out at an epoch near the light curve minimum of an X-AGB star have on the assessment of its possible SySt nature. At this phase of the pulsational cycle, some emission features originated in the atmosphere of the AGB star, such as H I recombination lines, are not expected to show, thus strengthening the case for its association with accretion processes (see the inconclusive case of the spectroscopic observations at or near the maximum of UV Aur and V335 Vul described in Sect. 4.3). Furthermore, the higher contrast of nebular emission lines with respect to a diminished stellar continuum at minimum makes their detection more likely, which provides conclusive evidence of the SySt nature.
Data were retrieved via the ATLAS Forced Photometry server (Shingles et al. 2021).
Their figure 4 reveals the presence of an Hβ emission line as well.
The symbiotic nature of UV Aur remains debated, as Herbig (2009) did not detect the previously reported high-excitation emission lines. However, since these observations were obtained at pulsational maximum, it is possible that the emission lines were temporarily obscured, as further discussed in Section 4.1.
Acknowledgments
We thank the anonymous referee for their helpful comments that improved the manuscript. We thank Shreeya Shetye for the fruitful discussion on the third dredge-up in AGB stars. This work is based on service observations made with the Nordic Optical Telescope (programme SST2025-681; PI: M. A. Guerrero), owned in collaboration by the University of Turku and Aarhus University, and operated jointly by Aarhus University, the University of Turku and the University of Oslo, representing Denmark, Finland and Norway, the University of Iceland and Stockholm University at the Observatorio del Roque de los Muchachos, La Palma, Spain, of the Instituto de Astrofísica de Canarias. The contact person, Rosa Clavero, the astronomers who conducted the observations, David Jones and Paulina Sowicka, and the FIES instrument specialist, John Telting, are particularly appreciated for their guidance and support. This work is based on observations obtained with XMM-Newton, an European Science Agency (ESA) science mission with instruments and contributions directly funded by ESA Member States and NASA, and by the Chandra X-ray Observatory. The research of J.M. was supported by the Czech Science Foundation (GACR) project no. 24-10608O. M.A.G. acknowledges financial support from grants CEX2021-001131-S funded by MCIN/AEI/10.13039/501100011033 and PID2022-142925NB-I00 from the Spanish Ministerio de Ciencia, Innovación y Universidades (MCIU) cofunded with FEDER funds. J.A.T. acknowledges support from the UNAM PAPIIT project IN 102324. R.O. thanks the support of the São Paulo Research Foundation (FAPESP), grant #2023/05298-0. This work has made extensive use of NASA’s Astrophysics Data System.
References
- Akras, S., Guzman-Ramirez, L., Leal-Ferreira, M. L., et al. 2019, ApJS, 240, 21 [NASA ADS] [CrossRef] [Google Scholar]
- Alksnis, A., Balklavs, A., Dzervitis, U., et al. 2001, Balt. Astron., 10, 1 [NASA ADS] [Google Scholar]
- Allen, D. A. 1978, MNRAS, 184, 601 [NASA ADS] [Google Scholar]
- Anders, E., & Grevesse, N. 1989, Geochim. Cosmochim. Acta, 53, 197 [Google Scholar]
- Appenzeller, I., & Östreicher, R. 1988, AJ, 95, 45 [NASA ADS] [CrossRef] [Google Scholar]
- Arnaud, K. A. 1996, ASP Conf. Ser., 101, 17 [Google Scholar]
- Arrieta, A., & Torres-Peimbert, S. 2003, ApJS, 147, 97 [NASA ADS] [CrossRef] [Google Scholar]
- Astropy Collaboration (Robitaille, T. P., et al.) 2013, A&A, 558, A33 [NASA ADS] [CrossRef] [EDP Sciences] [Google Scholar]
- Astropy Collaboration (Price-Whelan, A. M., et al.) 2018, AJ, 156, 123 [Google Scholar]
- Astropy Collaboration (Price-Whelan, A. M., et al.) 2022, ApJ, 935, 167 [NASA ADS] [CrossRef] [Google Scholar]
- Ayres, T. R., Linsky, J. L., Vaiana, G. S., Golub, L., & Rosner, R. 1981, ApJ, 250, 293 [NASA ADS] [CrossRef] [Google Scholar]
- Bailer-Jones, C. A. L., Rybizki, J., Fouesneau, M., et al. 2021, AJ, 161, 147 [NASA ADS] [CrossRef] [Google Scholar]
- Belczyński, K., Mikołajewska, J., Munari, U., et al. 2000, A&AS, 146, 407 [NASA ADS] [CrossRef] [EDP Sciences] [Google Scholar]
- Brandi, E., Quiroga, C., Mikolajewska, J., Ferrer, O. E., & García, L. G. 2009, A&A, 497, 815 [NASA ADS] [CrossRef] [EDP Sciences] [Google Scholar]
- Cohen, M., Wainscoat, R. J., Walker, H. J., & Volk, K. 1996, AJ, 111, 1333 [Google Scholar]
- Contini, M. 1997, ApJ, 483, 887 [Google Scholar]
- Corradi, R. L. M., Sabin, L., Munari, U., et al. 2011, A&A, 529, A56 [NASA ADS] [CrossRef] [EDP Sciences] [Google Scholar]
- Cui, X.-Q., Zhao, Y.-H., Chu, Y.-Q., et al. 2012, Res. Astron. Astrophys., 12, 1197 [Google Scholar]
- Cutri, R. M., Skrutskie, M. F., van Dyk, S., et al. 2003, The IRSA 2MASS All-Sky Point Source Catalog, NASA/IPAC Infrared Science Archive [Google Scholar]
- Dyck, H. M., van Belle, G. T., & Benson, J. A. 1996, AJ, 112, 294 [Google Scholar]
- Fox, M. W., Wood, P. R., & Dopita, M. A. 1984, ApJ, 286, 337 [NASA ADS] [CrossRef] [Google Scholar]
- Fruscione, A., McDowell, J. C., Allen, G. E., et al. 2006, Proc. SPIE, 6270, 62701V [Google Scholar]
- Gabriel, C., Denby, M., Fyfe, D. J., et al. 2004, ASP Conf. Proc., 314, 759 [Google Scholar]
- Gaia Collaboration (Vallenari, A., et al.) 2023a, A&A, 674, A1 [NASA ADS] [CrossRef] [EDP Sciences] [Google Scholar]
- Gaia Collaboration (Trabucchi, M., et al.) 2023b, A&A, 680, A36 [NASA ADS] [CrossRef] [EDP Sciences] [Google Scholar]
- Gal, J., & Szatmary, K. 1995, Ap&SS, 225, 101 [Google Scholar]
- Gigoyan, K. S., Sarkissian, A., Russeil, D., et al. 2014, Astrophysics, 57, 510 [Google Scholar]
- Groenewegen, M. A. T., & Whitelock, P. A. 1996, MNRAS, 281, 1347 [NASA ADS] [CrossRef] [Google Scholar]
- Gromadzki, M., Mikołajewska, J., Whitelock, P., et al. 2009, Acta Astron., 59, 169 [Google Scholar]
- Guerrero, M. A., & Ortiz, R. 2020, MNRAS, 491, 680 [NASA ADS] [CrossRef] [Google Scholar]
- Guerrero, M. A., Montez, R., Ortiz, R., Toalá, J. A., & Kastner, J. H. 2024, A&A, 689, A62 [NASA ADS] [CrossRef] [EDP Sciences] [Google Scholar]
- Guerrero, M. A., Vasquez-Torres, D. A., Rodríguez-González, J. B., et al. 2025, A&A, 693, A203 [NASA ADS] [CrossRef] [EDP Sciences] [Google Scholar]
- Gutierrez-Moreno, A., Moreno, H., & Cortes, G. 1995, PASP, 107, 462 [NASA ADS] [CrossRef] [Google Scholar]
- Heinze, A. N., Tonry, J. L., Denneau, L., et al. 2018, AJ, 156, 241 [Google Scholar]
- Henize, K. G. 1967, ApJS, 14, 125 [NASA ADS] [CrossRef] [Google Scholar]
- Herbig, G. H. 2009, AJ, 138, 1502 [NASA ADS] [CrossRef] [Google Scholar]
- Hynes, R. I., Torres, M. A. P., Heinke, C. O., et al. 2014, ApJ, 780, 11 [Google Scholar]
- Ikeda, Y., & Tamura, S. 2004, PASJ, 56, 353 [NASA ADS] [Google Scholar]
- Iłkiewicz, K., & Mikołajewska, J. 2017, A&A, 606, A110 [NASA ADS] [CrossRef] [EDP Sciences] [Google Scholar]
- Ivezic, Z., Nenkova, M., & Elitzur, M. 1999, User Manual for DUSTY (University Kentucky Internal Report) [Google Scholar]
- Izumiura, H., Noguchi, K., Aoki, W., et al. ApJ, 682, 499 [Google Scholar]
- Jayasinghe, T., Kochanek, C. S., Stanek, K. Z., et al. 2018, MNRAS, 477, 3145 [Google Scholar]
- Karakas, A. I., Latanzzio, J. C., & Pols, O. R. 2002, PASA, 19, 515 [NASA ADS] [CrossRef] [Google Scholar]
- Kochanek, C. S., Shappee, B. J., Stanek, K. Z., et al. 2017, PASP, 129, 104502 [Google Scholar]
- Lagadec, E., Sloan, G. C., Zijlstra, A. A., Mauron, N., & Houck, J. R. 2012, MNRAS, 427, 2588 [Google Scholar]
- Lebzelter, T., Mowlavi, N., Lecoeur-Taibi, I., et al. 2023, A&A, 674, A15 [NASA ADS] [CrossRef] [EDP Sciences] [Google Scholar]
- Lomb, N. R. 1976, Ap&SS, 39, 447 [Google Scholar]
- Luna, G. J. M., Sokoloski, J. L., Mukai, K., et al. 2013, A&A, 559, A6 [NASA ADS] [CrossRef] [EDP Sciences] [Google Scholar]
- Masetti, N., Munari, U., Henden, A. A., et al. 2011, A&A, 534, A89 [NASA ADS] [CrossRef] [EDP Sciences] [Google Scholar]
- Matsunaga, N., Menzies, J. W., Feast, M. W., et al. 2017, MNRAS, 469, 4949 [NASA ADS] [CrossRef] [Google Scholar]
- Mauron, N. 2008, A&A, 482, 151 [NASA ADS] [CrossRef] [EDP Sciences] [Google Scholar]
- Mauron, N., Gigoyan, K. S., & Kendall, T. R. 2007, A&A, 475, 843 [NASA ADS] [CrossRef] [EDP Sciences] [Google Scholar]
- Mauron, N., Gigoyan, K. S., Berlioz-Arthaud, P., & Klotz, A. 2014, A&A, 562, A24 [NASA ADS] [CrossRef] [EDP Sciences] [Google Scholar]
- McKeever, J., Lutz, J., Wallerstein, G., Munari, U., & Siviero, A. 2011, PASP, 123, 1062 [NASA ADS] [CrossRef] [Google Scholar]
- Merc, J. 2025, Galaxies, 13, 49 [Google Scholar]
- Merc, J., Gális, R., & Wolf, M. 2019a, Res. Notes Am. Astron. Soc., 3, 28 [Google Scholar]
- Merc, J., Gális, R., & Wolf, M. 2019b, Astron. Nachr., 340, 598 [NASA ADS] [CrossRef] [Google Scholar]
- Merc, J., Gális, R., Wolf, M., et al. 2021, MNRAS, 506, 4151 [NASA ADS] [CrossRef] [Google Scholar]
- Merrill, P. W., & Burwell, C. G. 1950, ApJ, 112, 72 [NASA ADS] [CrossRef] [Google Scholar]
- Mikolajewska, J., Acker, A., & Stenholm, B. 1997, A&A, 327, 191 [NASA ADS] [Google Scholar]
- Miszalski, B., Mikołajewska, J., & Udalski, A. 2013, MNRAS, 432, 3186 [NASA ADS] [CrossRef] [Google Scholar]
- Mouhcine, M., & Lançon, A. 2003, MNRAS, 338, 572 [NASA ADS] [CrossRef] [Google Scholar]
- Munari, U. 2019, arXiv e-prints [arXiv:1909.01389] [Google Scholar]
- Munari, U., Tomov, T., & Rejkuba, M. 1999, Inf. Bull. Var. Stars, 4668, 1 [Google Scholar]
- Mürset, U., Wolff, B., & Jordan, S. 1997, A&A, 319, 201 [NASA ADS] [Google Scholar]
- Ortiz, R., & Guerrero, M. A. 2016, MNRAS, 461, 3036 [NASA ADS] [CrossRef] [Google Scholar]
- Ortiz, R., & Guerrero, M. A. 2021, ApJ, 912, 93 [Google Scholar]
- Pavlinsky, M., Sazonov, S., Burenin, R., et al. 2022, A&A, 661, A38 [NASA ADS] [CrossRef] [EDP Sciences] [Google Scholar]
- Pawlak, M. 2023, A&A, 669, A60 [NASA ADS] [CrossRef] [EDP Sciences] [Google Scholar]
- Pawlak, M., Trabucchi, M., Eyer, L., et al. 2024, A&A, 682, A88 [NASA ADS] [CrossRef] [EDP Sciences] [Google Scholar]
- Richter, H., & Wood, P. R. 2001, A&A, 369, 1027 [NASA ADS] [CrossRef] [EDP Sciences] [Google Scholar]
- Sahai, R., Findeisen, K., Gil de Paz, A., et al. 2008, ApJ, 689, 1274 [NASA ADS] [CrossRef] [Google Scholar]
- Sahai, R., Sánchez Contreras, C., Mangan, A. S., et al. 2018, ApJ, 860, 105 [NASA ADS] [CrossRef] [Google Scholar]
- Sahai, R., Sanz-Forcada, J., Guerrero, M. A., Ortiz, R., & Contreras, C. S. 2022, Galaxies, 10, 62S [Google Scholar]
- Sanduleak, N., & Stephenson, C. B. 1973, ApJ, 185, 899 [Google Scholar]
- Sanford, R. F. 1950, ApJ, 111, 270 [Google Scholar]
- Scargle, J. D. 1982, ApJ, 263, 835 [Google Scholar]
- Schlegel, D. J., Finkbeiner, D. P., & Davis, M. ApJ, 500, 525 [Google Scholar]
- Seal, P. 1988, Astrophys. Space Sci. Lib., 145, 293 [Google Scholar]
- Shappee, B. J., Prieto, J. L., Grupe, D., et al. 2014, ApJ, 788, 48 [Google Scholar]
- Shetye, S., Van Eck, S., Jorissen, A., et al. 2021, A&A, 650, A118 [NASA ADS] [CrossRef] [EDP Sciences] [Google Scholar]
- Shingles, L., Smith, K. W., Young, D. R., et al. 2021, TNSAN, 7, 1 [NASA ADS] [Google Scholar]
- Smith, K. W., Smartt, S. J., Young, D. R., et al. 2020, PASP, 132, 085002 [Google Scholar]
- Sobotka, P., Pejcha, O., Šmelcer, L., et al. 2003, ASP Conf. Proc., 303, 171 [Google Scholar]
- Soszyński, I., Olechowska, A., Ratajczak, M., et al. 2021, ApJ, 911, L22 [CrossRef] [Google Scholar]
- Tonry, J. L., Denneau, L., Heinze, A. N., et al. 2018, PASP, 130, 064505P [CrossRef] [Google Scholar]
- van Belle, G. T., Dyck, H. M., Thompson, R. R., et al. 1997, AJ, 114, 2150 [Google Scholar]
- van Belle, G. T., Paladini, C., Aringer, B., et al. 2013, ApJ, 775(1), 45 [NASA ADS] [CrossRef] [Google Scholar]
- Webb, N. A., Coriat, M., Traulsen, I., et al. 2020, A&A, 641, A136 [NASA ADS] [CrossRef] [EDP Sciences] [Google Scholar]
- Wetuski, J., Hynes, R. I., Maccarone, T. J., et al. 2021, MNRAS, 506, 5619 [Google Scholar]
- Whitelock, P. A. 1987, PASP, 99, 573 [NASA ADS] [CrossRef] [Google Scholar]
- Whitelock, P. A., Feast, M. W., Marang, F., & Groenewegen, M. A. T. 2006, MNRAS, 369, 751 [NASA ADS] [CrossRef] [Google Scholar]
- Wilms, J., Allen, A., & McCray, R. 2000, ApJ, 542, 914 [Google Scholar]
- Wood, P. R., Olivier, E. A., & Kawaler, S. D. 2004, ApJ, 604, 800 [Google Scholar]
- Woźniak, P. R., et al. 2004, AJ, 127, 2436 [NASA ADS] [CrossRef] [Google Scholar]
- Woźniak, P. R., Williams, S. J., Vestrand, W. T., & Gupta, V. 2004, AJ, 128, 2965 [CrossRef] [Google Scholar]
- Wright, E. L., Eisenhardt, P. R. M., Mainzer, A. K., et al. 2010, AJ, 140, 1868 [Google Scholar]
- Zhao, G., Zhao, Y.-H., Chu, Y.-Q., et al. 2012, Res. Astron. Astrophys., 12, 723 [CrossRef] [Google Scholar]
All Tables
All Figures
|
Fig. 1. Left: Inverted grayscale g-SDSS image of CGCS 6306 overlaid with CXO ACIS-S X-ray contours in red. The field of view is 2′×2′. Right: Color-composite CXO X-ray picture (R = 0.35 − 2.0 keV, G = 2.0 − 5.0 keV, B = 5.0 − 9.0 keV). The field of view is 30″ × 30″. In both images, north is up and east is to the left. |
| In the text | |
|
Fig. 2. Photometry of CGCS 6306. A: Light curves from ASAS-SN, ATLAS, and Gaia. The dotted gray sinusoidal line represents the apparent long-term variability trend. The vertical lines in the light curves mark the observation time of the LAMOST (2015 March 11) and NOT/FIES (2025 February 25) spectra. B: Lomb-Scargle periodograms of the photometric data. Due to the short time span of ASAS-SN and GaiaG observations, their periodograms are shown as dotted lines only. C: Phase-folded light curves of CGCS 6306. The long-term sinusoidal trend has been removed, and the median magnitude was subtracted for clarity. |
| In the text | |
|
Fig. 3. LAMOST and NOT FIES optical spectra of CGCS 6306. The spectra have been shifted vertically by a constant. A running window median filter was applied to the NOT FIES spectrum for clarity. Detected prominent emission lines are marked by vertical lines. Telluric lines are marked as well. |
| In the text | |
|
Fig. 4. Zoom-in view of the Hα (top) and [O I] λ6300 Å (bottom) emission lines in the NOT FIES spectrum. Velocities are given with respect to the Heliocentric frame. The narrow blue component of the [O I] λ6300 Å emission line at ≈0 km s−1 corresponds to a telluric contribution. |
| In the text | |
|
Fig. 5. Background-subtracted X-ray spectra of CGCS 6306. Different symbols show the spectra from different epochs. The solid lines show the best-fit models described in Table 2. We note that the spectrum labeled as MOS is the combination of the MOS1 and MOS2 spectra. |
| In the text | |
Current usage metrics show cumulative count of Article Views (full-text article views including HTML views, PDF and ePub downloads, according to the available data) and Abstracts Views on Vision4Press platform.
Data correspond to usage on the plateform after 2015. The current usage metrics is available 48-96 hours after online publication and is updated daily on week days.
Initial download of the metrics may take a while.