Fig. 2.
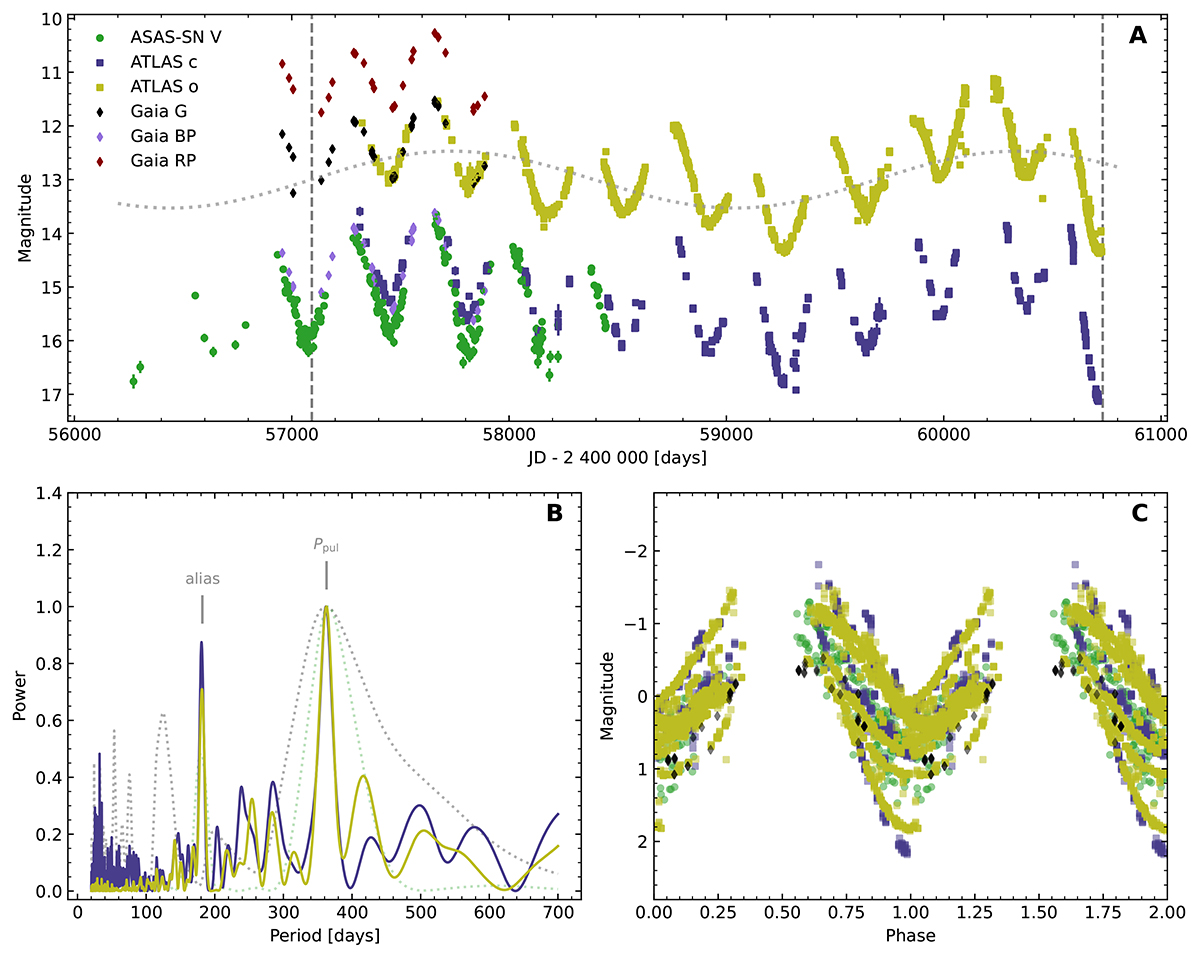
Download original image
Photometry of CGCS 6306. A: Light curves from ASAS-SN, ATLAS, and Gaia. The dotted gray sinusoidal line represents the apparent long-term variability trend. The vertical lines in the light curves mark the observation time of the LAMOST (2015 March 11) and NOT/FIES (2025 February 25) spectra. B: Lomb-Scargle periodograms of the photometric data. Due to the short time span of ASAS-SN and GaiaG observations, their periodograms are shown as dotted lines only. C: Phase-folded light curves of CGCS 6306. The long-term sinusoidal trend has been removed, and the median magnitude was subtracted for clarity.
Current usage metrics show cumulative count of Article Views (full-text article views including HTML views, PDF and ePub downloads, according to the available data) and Abstracts Views on Vision4Press platform.
Data correspond to usage on the plateform after 2015. The current usage metrics is available 48-96 hours after online publication and is updated daily on week days.
Initial download of the metrics may take a while.