| Issue |
A&A
Volume 689, September 2024
|
|
|---|---|---|
| Article Number | A62 | |
| Number of page(s) | 14 | |
| Section | Catalogs and data | |
| DOI | https://doi.org/10.1051/0004-6361/202450155 | |
| Published online | 04 September 2024 | |
Asymptotic giant branch stars in the eROSITA-DE eRASS1 catalog
1
Instituto de Astrofísica de Andalucía, CSIC,
Glorieta de la Astronomía S/N,
Granada
18008,
Spain
e-mail: This email address is being protected from spambots. You need JavaScript enabled to view it.
2
Center for Astrophysics | Harvard & Smithsonian,
60 Garden St.,
Cambridge,
MA
01238,
USA
3
Escola de Artes, Ciências e Humanidades, USP,
Av. Arlindo Bettio 1000,
03828-000
São Paulo,
Brazil
4
Instituto de Radioastronomía y Astrofísica, Universidad Nacional Autónoma de México,
58089
Morelia,
Michoacán,
Mexico
5
School of Physics and Astronomy and Laboratory for Multiwavelength Astrophysics, Rochester Institute of Technology,
Rochester,
NY,
USA
6
Chester F. Carlson Center for Imaging Science, Rochester Institute of Technology,
USA
Received:
27
March
2024
Accepted:
28
June
2024
Abstract
Context. Asymptotic giant branch (AGB) stars are not expected to be X-ray-emitters, yet a small fraction of them, the so-called X-AGBs, show X-ray emission that can be attributed to coronal activity of a companion or accretion onto one.
Aims. By searching the recently released SRG eROSITA-DE eRASS1 source catalog, we aim to increase the sample of known X-AGBs and investigate their X-ray and far-UV properties. So far, 36 X-AGBs have been reported, which includes 21 previous detections from ROSAT RASS, Chandra, and XMM-Newton and 15 recent detections from eROSITA eRASS1.
Methods. We cross-correlated the position of sources in the eROSITA-DE eRASS1 catalog with the largest available samples of AGB stars in order to find possible X-ray counterparts. We carefully checked the possible counterparts by comparing X-ray and near-IR K images, disregarding those affected by optical loading, those found to be diffuse sources, or those simply considered unreliable positional associations.
Results. We have found seven high-confidence X-AGBs and another seven possible ones. Accounting for previous X-ray detections, the sample of X-AGBs is increased by 11 new sources, increasing the sample of X-AGBs from 36 up to 47. Adding these sources to previous eROSITA-DE eRASS1 X-AGB detections, eROSITA has so far discovered 26 new X-AGBs, more than doubling the number of known X-AGBs. This demonstrates eROSITA’s capability to detect X-AGBs despite the challenge posed by the optical loading caused by their near-IR brightness, which makes the X-ray detection untrustworthy in a number of cases.
Conclusions. The eRASS1 X-AGBs tend to have a higher X-ray luminosity than that of previously detected X-AGBs, suggesting a bias toward brighter sources that is very likely due to the short exposure time of eRASS1 sources. A comparison of the X-ray and far-UV luminosity of X-AGBs with those of X-ray-emitter symbiotic stars (X-SySts) revealed an overlap in the X-ray luminosity range 1029.5 < LX (erg s−1) <1033.0. The average higher X-ray luminosity of X-SySts AGBs (≈1032 erg s−1) can be interpreted as X-ray emission arising from a boundary layer between an accretion disk and a white dwarf, whereas the average lower X-ray luminosity (≈5 × 1030 erg s−1) of X-AGBs would arise from an accretion disk around main-sequence or subgiant F-K companion stars.
Key words: accretion, accretion disks / stars: AGB and post-AGB / binaries: general / X-rays: binaries
© The Authors 2024
 Open Access article, published by EDP Sciences, under the terms of the Creative Commons Attribution License (https://creativecommons.org/licenses/by/4.0), which permits unrestricted use, distribution, and reproduction in any medium, provided the original work is properly cited.
This article is published in open access under the Subscribe to Open model. This email address is being protected from spambots. You need JavaScript enabled to view it. to support open access publication.
1 Introduction
Asymptotic giant branch (AGB) stars are bright cool giant stars with an inert core of carbon and oxygen, an inner shell where helium is burned into carbon, an outer shell where hydrogen is burned into helium, and an extended hydrogen-rich envelope. AGB stars are the immediate progenitors of planetary nebulae (PNe), and as such, they hold the keys to understanding their formation. Most PNe are believed to be shaped by binary interactions (De Marco 2009), and thus AGB stars have become a target for companion searches.
The discovery of a companion to an AGB star, however, is only straightforward when it is a member of a symbiotic star (SySt), a close binary system composed by a red giant and a white dwarf (WD). In these systems the components are so close to each other that mass transfer takes place from the giant primary to the secondary WD, very likely through an accretion disk around the latter (Merc et al. 2024). Thus, although the secondary cannot generally be visually detected, the spectrum of a SySt usually contains (in addition to absorption lines produced at the atmosphere of the cooler red giant; e.g., Schmidt et al. 2006) emission lines formed in the accretion disk that unveils the presence of the companion. On the other hand, if a binary system consists of an AGB star and a low- or intermediate-mass main-sequence or subgiant companion, the detection of the secondary is cumbersome because (1) the high luminosity of the AGB star overshines its companion, (2) no emission lines from an accretion disk are detected, and (3) the radial pulsations of the AGB star hamper the detection of the radial velocity variations caused by the mutual orbital motion.
Alternatively, the binarity of an AGB star can be revealed at high energies, particularly in X-rays. Single AGB stars are expected to be X-ray quiet because they are slow rotators and thus unlikely to have strong surface magnetic fields to support a corona (Ayres et al. 1981; Linsky & Haisch 1979). Therefore, AGB stars with X-ray counterparts (hereafter X-AGBs) are believed to be members of binary systems, particularly those with X-ray luminosity in excess of a few times 1029 erg s−1 (Soker & Kastner 2003), that is, most X-AGBs (Sahai et al. 2015; Ortiz & Guerrero 2021). The X-ray emission would originate either in the corona of their companion or in an accretion disk around a secondary, such as those around the degenerate WD component of X-ray-emitting SySts (hereafter X-SySts). Such an example is Y Gem, an X-AGB showing far-UV excess and a double-peaked X-ray spectrum (Ortiz & Guerrero 2021) that has recently been proposed to actually be a SySt (Yu et al. 2022).
To date, a growing number of AGB stars with X-ray counterparts have been reported in the literature (Jorissen et al. 1996; Hünsch et al. 1998; Kastner & Soker 2004; Ramstedt et al. 2012; Sahai et al. 2015), making X-AGBs an interesting class of objects in the zoo of X-ray sources. A recent search for X-AGBs (Ortiz & Guerrero 2021) carried out a cross-correlation between the 4XMM-DR9 catalog and various lists of AGB stars (exhibiting high mass-loss rates; nearby, listed in the HIPPARCOS catalog; showing various [C/O] relative abundances) and found eight new objects, increasing the number of known X-AGBs at that time to 26, although five of them were later found to not be AGB stars (e.g., DT Psc and HD 35155 in Jorissen et al. 1996, now known to be SySts). Their X-ray spectra can be described by absorbed optically thin plasma emission models with a wide interval of plasma temperatures, from 4 MK to 117 MK, which is similar to that displayed by X-SySts (see Merc et al. 2019, and references therein). On the other hand, the luminosity of X-AGBs is typically in the range 10−8 < LX/Lbol < 10−6 (1029 ~ 1031 L⊙), whereas X-SySts generally exhibit higher values, 10−7 < LX/Lbol < 10−2 (1030 ~ 1033 L⊙). The X-ray emission from X-AGBs was interpreted by Ortiz & Guerrero (2021) as being a consequence of binarity, especially because of the positive correlation between X-ray and far-UV luminosity.
The aim of the extended ROentgen Survey with an Imaging Telescope Array (eROSITA) on board the Russian-German Spectrum-Roentgen-Gamma (SRG) observatory is to survey the whole sky at a depth much greater than the available ROSAT All-Sky Survey (RASS). The recent release of the first eROSITA German catalog, the so-called eROSITA-DE eRASS1 (hereafter eRASS1), provides a unique opportunity to increase the sample of X-AGBs. We present here a search of the eRASS1 catalog for point-source X-ray counterparts of AGB stars. After the first release of the eROSITA catalog, Schmitt et al. (2024) identified 15 new X-ray sources associated with very red giant stars1, namely DREri, BH Eri, UU Ret, CD–51 1503, CPD 84–86, BD+32 1528, TYC9506-1836-1, MV Hya, EH Leo, HD 84048, WW Crt, TW Cen, IRAS 19204-3959, HD 181817, and HD 199203, as well as the additional detection of the previously known X-AGB CI Hyi (Sahai et al. 2015) among a sample of Gaia DR3 sources closer than 1300 pc. These X-AGBs show LX in the range ≃ 2 × 1030 to ≃ 2 × 1031 erg s−1. Their X-ray emission is attributed to unseen companions of these AGB stars, even though just a few of them have been confirmed to be binaries by other means. The total number of X-AGBs identified so far amounts to 36.
In this paper, we search the eRASS1 catalog for X-ray counterparts of AGB stars among a larger sample of AGB stars. This paper is organized as follows: In Section 2, we describe the sample of AGB stars, the eRASS1 catalog, and our search procedure. The list of potential X-AGBs is presented and discussed in Section 3. The discussion of our results is presented in Section 4. Finally, our conclusions are presented in Section 5.
2 The sample of asymptotic giant branch stars and the eROSITA eRASS1 catalog
2.1 The sample of asymptotic giant branch stars
Asymptotic giant branch stars are recognized by their high luminosity, late spectral type, strong emission in the infrared, and the enrichment of their atmosphere by elements generated during the third dredge-up episode, such as carbon and s-process elements. A significant fraction of AGBs cannot be detected at visual wavelengths and are only detectable at infrared wavelengths because their optically thick circumstellar dust shells (CDSs) block the visual radiation emitted by their photosphere.
Most samples of AGB stars in the literature are based on the properties described above. For example, the vast majority of the 2341 stars in the catalog of OH/IR stars of Engels & Bunzel (2015) are in the AGB phase, with a minor fraction of super-giants. In the cases where the abundance ratio [C/O] exceeds unity, other molecular species can be formed in the CDS besides OH and SiO, such as HCN, for example. The catalog of CO and HCN observations by Loup et al. (1993) contains 184 O-rich, 205 C-rich, and 9 S-type AGB stars (the latter showing [C/O] ≈ 1). More recently, Suh & Hong (2017) compiled a new list of AGB stars based on K+[IRAS] color-color diagrams, which was eventually updated by Suh (2021) using IR photometry obtained by various surveys (e.g., near-IR 2MASS, mid-IR MSX and WISE, and far-IR IRAS and AKARI). The latest version of their catalog also includes 6528 large amplitude, regularly pulsating AGB stars (i.e., “Mira-type” variables) located in the Galactic bulge detected during the OGLE project (Soszyński et al. 2013). In spite of all attempts to compile a definitive, updated list of Galactic AGB stars, there are still a significant number of objects that have been overlooked. For example, the following AGB stars with X-ray emission (Sahai et al. 2015; Ortiz & Guerrero 2021) are not listed in the catalog by Suh (2021): CI Hyi, CD–33º2309, CD–38º3905, CSS 1244, DH Eri, and EY Hya, among others.
In the present work, we have considered four samples of AGB stars: (1) the full New Catalog of Asymptotic Giant Branch Stars in Our Galaxy (Suh 2021), amounting to 11,209 O-rich and 7,172 C-rich stars; (2) the sample of 469 AGB stars examined by Montez et al. (2017); (3) the 13 previously detected X-AGBs by Ortiz & Guerrero (2021) and Sahai et al. (2015); and (4) 10 820 Miras, SR- and Lb-type variables listed in the General Catalog of Variable Stars (GCVS, Samus et al. 2017) showing any of the following characteristics, a Mira or semi-regular variable with P > 100d, a spectral type later than M3 III, and being a C- or S-type. We reckon, as shown later in Sect. 3.1 during the identification of eRASS1 X-ray counterparts of AGB stars, that the samples of AGB stars used here are not completely pure, meaning that they include non-AGB contaminant sources such as SySts and red dwarfs, among others.
2.2 The eROSITA eRASS1 catalog
Launched on 2019 July 13, eROSITA is a Russian-German mission that consists of an array of seven X-ray telescopes. It offers wide field and high-throughput X-ray spectroscopic imaging in the 0.2–8 keV energy range with an energy resolution of ≃80 eV at 1.5 keV and an imaging resolution with a half energy width (HEW) ≃ 26″ (Predehl et al. 2021).
The initial 184-day all-sky survey of eROSITA was performed from 2019 December 12 to 2020 June 11. The data rights are split by Galactic longitude (l), with the “eastern” (l < 180º) data for the Russian consortium and the “western” (l > 180º) data for the German consortium. The first data release of the western Galactic hemisphere of the eROSITA all-sky survey (the eROSITA-DE eRASS 1; hereafter eRASS 1) was made public on 2024 January 31 (Merloni et al. 2024). It has a typical average flux sensitivity limit of 5 × 10⁻¹⁴ cm−2 s−1 that improves at high ecliptic latitudes due to the all-sky survey scanning pattern and an average spatial resolution with HEW ≃ 30″. The eRASS1 data provides a suite of calibrated data products and source catalogs produced with the eROSITA standard data processing pipeline. In this work, we used the eRASS 1 Main Catalog, which includes calibrated event lists and count numbers, count rates, flux estimates, detection likelihood, observing time, and quality flags for 903521 point sources and 26682 extended sources detected in the 0.2–2.3 keV band. The reader is referred to Predehl et al. (2021) and Merloni et al. (2024) for complete information on eROSITA and eRASS1, respectively.
It is relevant to note here that the eROSITA CCD detectors are prone to optical loading caused by the accumulation of low-energy photons within a CCD pixel over the frame integration time of 50 ms for bright optical/UV sources. This results in false, predominantly soft X-ray events. The adopted brightness limits of eRASS1 are B,V,G ≤ 4.5 mag and J ≤ 3 mag for tagging a source as potentially being the result of optical loading. If one or more of these criteria are fulfilled, the FLAG_OPT column entry of the eRASS1 catalog is set to one. It is still worthwhile to remark that AGB stars can not only be bright, particularly at IR wavelengths, but also variable on timescales of months to years, adding special concern to spurious X-ray detections caused by optical load.
2.3 Cross-correlation of the asymptotic giant branch sample with the eRASS1 catalog
We searched the eROSITA-DE eRASS1 Main Catalog for X-ray counterparts of AGB stars in the samples presented in Sect. 2.1. Since sources in the eRASS1 catalog are only to be found in the German “western” hemisphere, the approximately 30 000 AGB stars in these samples actually registered by eRASS1 go down to 13 139 sources. Given the typical eRASS1 imaging resolution (HEW≈ 30″) and the possible crowding at the location of AGB stars in the Galactic plane, the search was limited to X-ray sources with a positional coincidence within 20″ of an AGB star. This provided a first sample of 130 X-AGB candidates, and they are presented in Figure 1. In the figure, we have plotted their count rate in the 0.2–2.3 keV ML 1 eROSITA band versus their Gaia DR3 average G magnitude. The plot then distinguishes between sources flagged in the eROSITA-DE eRASS1 catalog as suffering from optical loading (FLAG_OPT set to 1, blue open circles) and those not flagged (FLAG_OPT set to 0, black dots). Optical loading causes a well-known relation between the observed count rate and the G magnitude (red-dashed line in Fig. 1, Schmitt et al. 2024), which is followed by stars in our sample brighter than G < 6 mag, instead of the canonical G ≤ 4.5 mag brightness limit (Merloni et al. 2024). This is probably caused by the large G − J color of AGB stars, but it is also because AGB stars are variable and may have been brighter in the G-band at the time they were observed by eROSITA than the average values adopted in this figure. Thus, sources brighter than G ≤ 6 were considered to be affected by optical loading and subsequently discarded regardless of their FLAG_OPT value. On the other hand, sources fainter than G ≥ 6 but flagged in the eRASS 1 catalog as being affected by optical loading (FLAG_OPT set to 1) were still considered because some of them are listed by Schmitt et al. (2024). Finally, sources flagged as being extended were also considered unlikely X-AGB stars and then excluded. The selection criteria described above provide a final sample of 59 X-AGB candidates in the eROSITA-DE eRASS1 main source catalog.
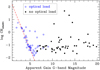 |
Fig. 1 Count rate of eRASS1 ML1 (0.2–2.3 keV) versus Gaia DR3 G magnitudes of AGB stars in eRASS1. The blue open symbols correspond to X-ray sources flagged as likely contaminated by optical loading. |
3 Data analysis
3.1 X-ray asymptotic giant branch stars in the eRASS1 catalog
We individually assessed the quality of the association between these 59 X-AGB candidates and their possible X-ray counterparts in the eRASS1 main source catalog. We then carefully compared the eROSITA 0.2–2.3 keV X-ray images of these X-AGB candidates to their near-IR 2MASS K images to assess the quality of the positional coincidence between AGB stars and their possible X-ray counterparts.
Sources were then regarded as “high confidence X-AGBs″ if there was a positional coincidence within 5″ of the AGB star and its X-ray counterpart, and the latter could not be better associated with any other UV, optical, or near-IR source2. The seven bona fide X-AGBs in the eRASS1 catalog are listed in Table 1, and their images are presented in Figs. A.1 to A.7. Table 1 provides their IRAS number and common name (Columns #1 and #2); their Gaia DR3 average  and minimum and maximum G magnitudes (Columns #3 and #4); the IAU name of their eRASS 1 counterpart and spatial offset (Columns #5 and #6); and the 1-σ positional uncertainty, count number, and count rate of the eRASS1 counterpart (Columns #7 to #9). Comments on the sources are given in the last column (Column #10). In all cases but one (TW Cen), their G magnitudes are larger than 6 mag at any time.
Sources were regarded to be “possible X-AGBs” if there was a positional coincidence between 5″ and 12″ of the AGB star and its X-ray counterpart and the AGB star was the most viable counterpart of the X-ray source at the UV, optical, or near-IR. The seven possible X-AGB stars in the eRASS1 catalog are listed in Table 2, and their images are presented in Figs. B.1 to B.7.
The cross-correlation between the X-ray source and a possible AGB counterpart is very dubious for a couple of sources, which are projected against a very crowded field of view. These sources, which we considered “confused X-AGBs”, are listed in Table 3, and their images are presented in Figs. C.1 and C.2.
Seven of the (presumed to be) AGB stars in our sample with X-ray source counterparts in the eRASS1 catalog have been found, a posteriori, to not be AGB stars according to SIMBAD. These seven “miscellaneous X-ray sources” are listed in Table 4. We note that the descriptions of the columns in Tables 2-4 are the same as those in Table 1.
Finally, spurious X-AGB stars are listed in Table D.1. The list includes 11 sources flagged as being affected by optical loading, namely CI Hyi, R Hor, U Men, U Ori, V340 Car, R Gem, Y Gem, Y Pup, R LMi, W Vel, and AX Sco. These sources are generally fainter than G ≥ 6 mag but brighter than J ≤ 3, one of the criteria to set a value of one for the FLAG_OPT flag. The list of spurious X-AGB stars also includes 25 extended X-ray sources and/or very unlikely or simply erroneous matches between the AGB star and an X-ray counterpart. We note that the average surface density of eRASS1 sources of ≈3.5 × 10⁻⁶ source arcsec2 implies that 0.0044 sources are expected to be within the 20 arc-sec in radius search aperture around each AGB star. Therefore a total of ≈60 spurious sources are anticipated for the total sample of 13,139 AGB stars registered by eRASS1-DE (i.e., ≈45% chance alignments in the original sample of 130 X-AGB candidates). Since this sample of 130 X-AGB candidates was reduced to the 59 that passed the optical loading and brightness criteria, 27 sources can be expected to be the result of changes in alignments, which is notably consistent with the number of spurious sources in Table D.1 according to positional criteria. Furthermore, the offset between AGB stars and their X-ray counterparts in Tables 1 and 2 is always within 3-σ of the X-ray source positional uncertainty provided by the eRASS1 catalog, but the offset is larger than 3-σ for sources in Table D.1, with the X-ray source being best associated with a background stellar source in quite a number of cases (e.g., V677 Pup, V434 Vel, V1110 Cen, and GI Lup). The distribution of the offset between the AGB stars and their X-ray counterparts relative to the 1-σ positional uncertainty shown in Figure 2 clearly illustrates the inferior quality of the association between AGB stars and spurious X-ray counterparts in Table D.1.
To summarize, this search found 14 X-AGBs in the eRASS1 catalog among an input sample of 13,139 AGB stars (with a small fraction of contaminants). This implies that one out of 1,000 AGB stars is an X-ray source in the eRASS 1 catalog. Since three of the 14 X-AGBs in Tables 1 and 2 had been identified previously in the eRASS1 catalog, namely CPD-84 86 and TW Cen (Schmitt et al. 2024) and HD 120832 (Ortiz & Guerrero 2021), the total number of X-AGBs is increased from 36 up to 47, that is, the known sample of X-AGBs is increased by ≃30% in this work.
High confidence X-AGB stars in the eROSITA-DE eRASS1 catalog.
Possible X-AGB stars in the eROSITA-DE eRASS1 catalog.
Confused X-AGB stars in the eROSITA-DE eRASS1 catalog.
Miscellaneous X-ray sources in the eROSITA-DE eRASS1 catalog.
Results of the spectral analysis performed with XSPEC.
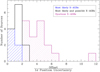 |
Fig. 2 Histogram of the positional offset between an AGB star and its associated eRASS1 X-ray counterpart relative to the 1-σ positional uncertainty of the latter for most likely, possible, and spurious X-AGBs in Tables 1, 2, and D.1, respectively. The histogram of the possible X-AGBs (black histogram) was added together with that of the most likely X-AGBs (blue histogram and shade). The histogram and shade of the spurious X-AGBs are shown in purple. The spurious X-AGBs associated with diffuse X-ray sources or those superimposed on diffuse emission are not included. |
3.2 Spectral analysis
The cross-correlation of the eRASS1 catalog with the sample of AGB stars identified seven high confidence X-AGBs (Table 1) and another seven possible X-AGBs (Table 2). The eRASS1 catalog includes source and background spectra only for the few sources with a sufficient count number, namely CPD–84 86 (IRAS 06024–8403), VX Cir (IRAS 14188-6943), and IRAS 16263–4910 in Table 1 and HD 120832 (IRAS 13494–0313) in Table 2. These spectra were obtained by combining multiple exposures of the seven modules on board eROSITA. The corresponding RMF and ARF calibration files are provided by the eRASS1 catalog as well. The background-subtracted spectra of CPD–8486, HD 120832, VX Cir, and IRAS 16263–4910 are presented in Fig. 3. All spectra peak at ≈ 1 keV, and there is no emission above 2 keV. These spectral properties discard nonthermal emission and rather hint at plasma emission with a high temperature.
The spectral analysis of CPD–84 86, IRAS 16263–4910, and VX Cir was performed using the X-ray spectral fitting package (XSPEC; Arnaud 1996). A grouped file was created by using the grppha task of HEASoft3 requesting five counts per bin. Models adopting a tbabs absorption model in conjunction with an optically thin apec emission plasma model with solar abundances were attempted in the energy range with detected emission, mostly below 2 keV. The best-fit hydrogen column density NH and plasma temperature TX listed in Table 5 are consistent with those reported for X-AGBs by Ortiz & Guerrero (2021). Slightly different abundances might be needed in order to improve the fit, but such a detailed model is not well justified given the small count number.
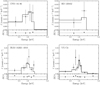 |
Fig. 3 Background-subtracted eROSITA spectra of CPD–84 86, HD 120832, IRAS 16263–4910, and VX Cir (black diamonds). The black solid histograms represent the best fits. Fractional residuals are presented in the bottom panels. The spectra were binned requesting a minimum of five counts per spectral bin. |
Energy conversion factors (ECFs) for absorbed apec plasma models.
3.3 X-ray flux and luminosity of X-AGBs in eRASS1
The majority of X-AGBs and potential X-AGBs in Tables 1 and 2, respectively, do not have sufficient eRASS1 counts for spectral analysis. For those sources, the eRASS1 catalog provides estimates of the X-ray flux, applying to the observed count rates an energy conversion factor (ECF) derived from an emission model consisting of an absorbed power-law with a slope of 2.0 and an absorbing column density NH = 3 × 1020 cm−2 typical of Galactic absorption (Brunner et al. 2022; Merloni et al. 2024) This emission model, which is suitable for AGNs (Liu et al. 2022), is obviously not satisfactory for X-AGBs, whose X-ray emission is best described by an absorbed optically thin plasma emission model, such as the apec model, with plasma temperatures in the range of 4 MK to 117 MK (Sahai et al. 2015; Ortiz & Guerrero 2021). Therefore, appropriate ECFs were computed for a grid of an absorbed apec plasma emission model from count rates in the 0.2–2.3 keV eROSITA ML 1 band to observed X-ray fluxes (Table 6) using the following equation:
 (1)
(1)
The typical hydrogen column densities and plasma temperatures of X-AGBs (Table 5 and Ortiz & Guerrero 2021) are found to be 3 × 1021 cm−2 and 30 MK, respectively. This “standard X-AGB spectral model” results in the “central” value in Table 6 (ECF0 ≈ 4.5 × 1011 cm2 erg−1; shown in boldface), which we used in this work for the energy conversion.
For comparison, the eRASS1 catalog flux correction factors (FCF) to apec plasma model fluxes
 (2)
(2)
are shown in Table 7. The standard X-AGB spectral model results in the central value in Table 7 (FCF0 = 2.368), which implies that the X-ray flux of the X-AGBs derived above is ≈2.4 times larger than those listed in the eRASS1 catalog.
We note that most X-AGBs are actually found to have NH values in the range from 1 × 10²¹ to 1 × 1022 cm−2 and TX in the range from 10 to 50 MK. The ECFs for these values of NH and TX, which encircle the central value in Table 6, reveal very likely excursions for the value ECF0 adopted here that can amount up to ≃90%. Hence, for the likely extremes of the values of NH and TX, particularly for high absorption columns and low plasma temperatures, the value of the ECF may depart notably from the one adopted here.
Based on the ECF ratio described above, the observed X-ray flux and intrinsic X-ray luminosity of the AGB stars whose spectral fit was not possible are listed in Table 8. The standard X-AGB spectral model was also used to derive the observed X-ray flux and intrinsic X-ray luminosity of HD 120832 (also known as IRAS 13494-0313), whose photon-starved spectrum made performing a reliable spectral fit impossible. Otherwise, the ECFs that can be derived from Eq. (1) using the measured count rates and X-ray fluxes derived from the spectral fits of CPD–8486, IRAS 16263–4910, and VX Cir have values of ≃1.2 × 1012 cm2 erg−1, which are consistent with those expected for sources with low hydrogen column densities and temperatures in the range of 10 to 30 MK (Table 6).
The stellar luminosity (L) in Table 8 was obtained from Gaia parallaxes and near-IR magnitudes using the (J − K) × BCK relationship derived by Whitelock et al. (2000, 2006). The uncertainty in luminosity depends on the error in the stellar distance (D) and the amplitude of variability (∆M). Table 8 lists the parallax distances along with their uncertainties. All objects closer than 1 kpc show σD/D < 10%, while those beyond 1 kpc exhibit σD/D < 18% (except for CH Ara, σD/D = 27%). As a result, the bolometric magnitudes would be uncertain by up to 0.21m and 0.36m, respectively (0.52m for CHAra). For AGB Mira and semi-regular (SR) variables, the amplitude of the bolomet-ric magnitude is strongly correlated with the K-band amplitude (∆Mbol = 1.210∆K, Whitelock et al. 2000). Unfortunately, there is no similar correlation between ∆Mbol and ∆V (or ∆mυ), and only one star in our sample (V 1245 Cen) has been monitored in the K-band (∆K = 0.78, implying ∆Mbol = 0.94, Whitelock et al. 2006). Consequently, except for this star, we cannot individually determine the effect of the variability on the stellar luminosity. However, in a sample consisting mainly of 92 Mira-type variables found in the HIPPARCOS catalog, Whitelock et al. (2000) observed 0.0 < ∆Mbol < 1.2, which corresponds to a maximum variation in luminosity of  . Therefore, the effect caused by the error in the parallax is generally less important than the variation of luminosity caused by pulsation, especially for the high-amplitude Mira-type variables.
Table 8 shows the properties of the X-AGBs found in our cross-correlation of the samples of AGB stars described in Sect. 2.1 and the eRASS1 catalog. Eleven are completely new discoveries, whereas three have been reported previously, including CPD–84 86 and TW Cen (Schmitt et al. 2024) and HD 120832 (Ortiz & Guerrero 2021). Most X-AGBs in Table 8 show LX/Lbol larger than the previous upper limit for this ratio established by Ortiz & Guerrero (2021): Lx/Lbol ≲ 3 × 10⁻⁶. Notably, the AGB star IRAS 16263–4910 exhibits an exceptionally high relative luminosity (LX/Lbol = 2.69 × 10⁻⁵), much higher than most X-AGBs and X-SySts considered by Ortiz & Guerrero (2021).
Flux correction unitless factors (FCFs) of the eRASS1 catalog for absorbed apec plasma models.
Observed X-ray flux (0.2–2.3 keV) and intrinsic luminosity (0.3–10.0 keV) of eRASS1 X-AGBs.
4 Discussion
Since the first discoveries of X-ray emission associated with AGB stars, the origin of their high-energy radiation has been attributed to various mechanisms that also operate in X-SySts and/or cataclysmic variables (CVs), such as shell burning at the surface of the WD (Orio et al. 2007) and/or shocks produced by the winds of both components (Mürset et al. 1997). The X-ray emission of confirmed SySts (i.e., showing typical SySts spectral features, such as the He II λ4686 emission line and O VI λ6825 Raman band) can certainly be associated with a degenerate companion (Orio et al. 2007). The scenario involving accretion onto a degenerate companion, however, is found to be inconsistent in most X-AGBs due to their low X-ray luminosity. In these cases, a main-sequence star accreting mass from the primary AGB seems more plausible given the observed X-ray luminosity (Kastner & Soker 2004).
The objects classified as “X-ray AGB stars” (or simply X-AGBs) in the literature and in the present study generally do not show the emission lines characteristic of X-SySts (but see the case of the Fe K-shell 6.4 and 6.7 keV emission lines in Y Gem, Ortiz & Guerrero 2021). Thus, the nature of their X-ray emission is still debated. For X-AGBs with main-sequence or WD companions, the AGB star would generally outshine the companion in the infrared and visual spectral regions. However, in the far-UV, the companion can outshine the AGB star. Therefore a comparison between their UV and X-ray properties may shed light on the mechanisms that produce high-energy photons in AGB stars.
Far-UV excess in AGBs has been detected in the GALEX bands and in IUE spectra (e.g. Ortiz & Guerrero 2016; Sahai et al. 2022). Figure 4 presents the LX−M[FUV] diagram for X-SySts and X-AGBs for which far-UV data are available in the GALEX archive. The list of X-SySts was taken from the New Online database of Symbiotic Variables4 (Merc et al. 2019); included in the plot are the Galactic X-SySts observed in X-rays during quiescence, whereas X-AGBs were taken from various references in the literature (Hünsch et al. 1998; Kastner & Soker 2004; Ramstedt et al. 2012; Sahai et al. 2015; Ortiz & Guerrero 2021; Schmitt et al. 2024). We note that some sources formerly known as X-AGBs have been suggested to be X-SySts (e.g., Y Gem; Yu et al. 2022), but Fig. 4 does not include those unless their SySt nature has been confirmed (Merc et al. 2019).
X-AGBs are generally distributed in the LX–M[FUV] diagram as an extension of the X-SySts branch toward lower far-UV and X-ray luminosities. Although X-AGBs can be better disentangled from X-SySts by their M[FUV] , the X-SySts DT Psc and o Cet (aka Mira) exhibit very low X-ray and far-UV luminosity, consistent with those of X-AGBs. These two X-ray faint X-SySts are actually “weakly SySts,” where the red giant and the WD are in a wide orbit. Thus, the abnormally low X-ray luminosity of o Cet, LX = 5 × 1029 erg s−1 initially attributed to a low-mass main-sequence companion (Jura & Helfand 1984; Kastner & Soker 2004) had to be reassessed when its WD nature was confirmed. The low X-ray luminosity of o Cet was accordingly ascribed to a low accretion rate onto the WD on a wide orbit. Meanwhile, DT Psc, a Tc-poor S3/2-type AGB star showing a highly variable X-ray emission (Jorissen et al. 1996), has a relatively low far-UV flux that does not seem to support a high temperature WD companion. Monitoring of its radial velocity resulted in an orbital period of 4596 yr and e = 0.18 (Jorissen et al. 2019), which implies a large separation between the two components except at periastron. On the other hand, the X-AGB CI Hyi exhibits a very high far-UV and X-ray luminosity5 comparable to the bright X-SySts.
Apart from these exceptional cases, a correlation between far-UV and X-ray luminosity is found when X-AGBs and X-SySts are considered altogether. Generally, objects brighter in the far-UV have higher X-ray luminosity. The linear regression fit to all sources in the LX–M[FUV] diagram,
![Mathematical equation: $\log \left( {{L_{\rm{X}}}} \right) = 32.44 - \left( {0.146 \cdot {M_{[{\rm{FUV}}]}}} \right),$](/articles/aa/full_html/2024/09/aa50155-24/aa50155-24-eq18.png) (3)
(3)
is plotted in Fig. 4. The fit has a low regression coefficient, ≈ 0.34, and a non-negligible standard deviation, σ = 0.65, though it implies only a mild correlation.
The X-ray luminosity distributions of X-AGBs and X-SySts are shown more comprehensively in Fig. 5 because many objects, those not having a GALEX detection in the far-UV band, are absent in Fig. 4. The X-SySts in the figure are highlighted by different colors depending on their X-ray spectral type (Mürset et al. 1997; Luna et al. 2013), from the softest sources (α-type) to those emitting in the hard X-ray regime (δ-type). For comparison, we also plot those of the γ-type, but it must be noted that their compact object is accepted to be a neutron star (see Merc et al. 2019) and their spectra have a nonthermal origin.
The X-ray luminosity distributions of X-AGBs and X-SySts in Fig. 5 can be fitted with Gaussian curves to each population corresponding to averaged values of log(LX/erg s−1)=30.6±0.8 for X-AGBs and log(LX/erg s−1)=32.1±1.0 for X-SySts. The X-ray luminosities of AGBs below log(LX/ergs−1) < 30.0 were not considered in the fit because of the strong selection effect that prevents the detection of distant, low-luminosity X-ray sources. Actually, most X-AGBs found in the present work have an X-ray luminosity more than one standard deviation above the average LX (i.e., log(LX/erg s−1) > 31.4). This bias is probably caused by the low sensitivity of the eROSITA eRASS1 survey when compared with previous pointed XMM-Newton or Chandra observations.
A two-sample Kolmogorov-Smirnov test to check whether the samples of X-AGBs and X-SySts were drawn from the same population resulted in a p-value of about 0.0015, which is much smaller than the typical threshold of 0.05 to reject the null hypothesis. A two-sample Anderson-Darling test also resulted in a similar conclusion. Although the two samples are not drawn from the same population, the overlap of the X-ray distributions of X-AGBs and X-SySts is notorious (apart from the extremely high X-ray luminosity of γ-type X-SySts), as both exhibit X-ray luminosity as low as a few times 1029 erg s−1 . Therefore, it is not possible to determine whether an X-ray source is an X-AGB or an X-SySt within the interval 1029.5 < Lx (erg s−1) < 1033.0 and based solely on its X-ray luminosity.
Some X-AGBs showing Lx ≳ 1032 erg s−1 and/or M[FUV] < 8.0 can actually very likely be SySts not recognized so far. There are four objects detected in the present study that exceed this limit of luminosity, but none of them were detected and/or observed by GALEX in the far-UV: the “high-confidence” X-AGBs VX Cir and IRAS 16263–4910 and the “possible” X-AGBs V501 Nor and CH Ara (Table 8). As for CGCS 3366, it shows LX ≃ 1033 erg s−1, but this figure is dubious due to its uncertain distance, the largest among all objects in this study. The plasma temperatures of VX Cir and IRAS 16263–4910 are 17.4 and 22.0 MK, respectively, similar to the typical coronal temperatures of A- to K-type giants (≈ 1.0 × 10⁷ K, Schmitt et al. 1990), but their X-ray luminosity (LX = (1.15 ± 0.60) × 1032 and (1.60 ± 1.00) × 1032, respectively) are near the maximal value of normal A- to K-type giants (LX < 1032 erg s−1, Schmitt et al. 1990). On the other hand, the wide interval of temperatures observed among X-SySts (4 MK < Tplasma < 130 MK; Nuñez et al. 2014, 2016) does not allow one to classify a source as an X-AGB or an X-SySt based solely on their plasma temperature.
The luminosity ratio LX/L of the eRASS1 X-AGBs, mostly in the range 10−6 to 2 × 10⁻⁵, is similar to that of X-SySts with an AGB star (see the left panel of figure 12 in Ortiz & Guerrero 2021). This fact in conjunction with the compatible X-ray temperature and X-ray luminosity within the interval 29.5 < log(LX/erg s−1) < 33.0 of X-AGBs and X-SySts noted above implies that their X-ray emission mechanisms may be similar. The initial X-ray spectral classification of X-SySts proposed different emission mechanisms that could generate X-rays in SySts: α-type have very soft spectra (E < 0.4 keV), usually associated with thermonuclear burning on the WD surface (Orio et al. 2007);β-type have harder spectra, peaking at ~0.8 keV and initially attributed to the collision of the stellar winds of both components or to jets (Luna et al. 2013; Mürset et al. 1997); and δ-type have highly absorbed harder spectra (E>4 keV) with Fe emission lines in the 6.0–7.0 keV energy range, most probably generated in the boundary layer between the accretion disk and the WD. Finally the spectra of β/δ-type spectra have similar properties to the δ-type but with a considerable contribution in the 0.3–4.0 keV energy range. There is convincing evidence, however, that most X-SySts can be interpreted within a unified scenario consisting of an accretion disk with an X-ray-emitting boundary layer and the additional occurrence of jets, where the different X-SySts types depend on the viewing angle and the different accretion conditions (see Toalá 2024).
Under this scenario, the X-ray-emitting plasma in X-SySts of β-, δ-, and β/δ-type spectra is expected to at least be produced at the inner boundary layer of the accretion disk, with the possible contribution of soft X-ray emission from jets. The temperature of the plasma there depends on the efficiency of the accretion process: The formation of plasma with temperature of ~105 K is expected for highly efficient accreting sources, while low efficiency accreting ones are expected to produce plasma with temperatures of ~ 108 K (Pringle & Savonije 1979; Patterson & Raymond 1985). If accretion is indeed the same mechanism producing the X-ray emission from X-AGB stars, one can estimate accretion rates from their X-ray luminosities. For the typical X-ray luminosity of X-SySts derived above of log(Lx/erg s−1)=32.0±0.8, a standard accretion rate of 1.3×10¹⁵ g s−1 (≈ 2 × 10⁻¹¹ M⊙ yr−1) can be estimated using the expression
 (4)
(4)
assuming that all compact companions in X-SySts are WDs with a radius of 0.015 R⊙ and typical masses of 0.6 M⊙. If the X-ray emission in X-AGBs has the same origin and efficiency, similar accretion rates imply solar-like (F-K type) stars as companions in X-AGB systems for their typical log(LX/erg s−1)=30.6±0.8 X-ray luminosity.
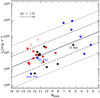 |
Fig. 4 GALEX [FUV] absolute magnitude (M[FUV]) versus the X-ray luminosity of AGB and SySts. The X-ray AGB stars discovered by eROSITA are plotted with red symbols (squares = this work; circles = Schmitt et al. 2024); X-AGBs discovered by other X-ray surveys are shown with black circles; and SySts are shown with blue circles. The open symbols represent upper limits for M[FUV], calculated at the GALEX detection threshold according to Montez et al. (2017). The arrow represents the far-UV extinction corresponding to one visual magnitude, assuming A[FUV]/AV = 2.6 (Cardelli et al. 1989). The solid line shows a least-squared fit (see Eq. 3) to all detected sources, while the dashed and dotted lines represent the 1-σ and 2-σ confidence levels, respectively. |
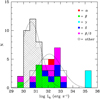 |
Fig. 5 Histogram of the X-ray luminosity of AGB stars and SySts. Previously known X-AGB stars are shown with black crossed-dashed symbols, newly found X-AGBs are shown with black diagonal-dashed symbols. The X-SySts are shown with colors, according to the classification of their X-ray spectra, as labeled. The dotted and solid histograms are the best least-squared Gaussian fits to the X-AGBs and X-SySts, respectively. |
5 Conclusions and summary
We have presented a search for X-ray counterparts of AGB stars in the eROSITA-DE eRASS1, the first eROSITA data release. Seven X-AGBs are confirmed and another seven are identified as possible X-AGBs, increasing the known sample of X-AGBs from 36 up to 47 (three out of these fourteen eRASS1 X-AGBs had been identified in a previous X-ray search). This confirms that X-ray emission is ordinary among AGB stars and that the eROSITA sky survey is very useful for detecting X-AGBs despite the fact that the majority of the new X-AGB stars found in the present work are more than one standard deviation above the average X-ray luminosity of all X-AGBs known to date. The first eROSITA sky survey is thus only sensitive to the brightest X-AGBs, but future higher-sensitivity data releases will be capable of detecting an increasing number of X-AGB stars, especially those showing LX < 1030 erg s−1.
The X-ray emission of the eRASS1 X-AGBs with sufficient quality spectrum can be described by an optically thin thermal plasma emission model. The best-fit plasma temperatures and column densities of the X-AGBs presented here are similar to those of previously identified X-AGBs. The X-ray luminosity of the eRASS1 X-AGBs with a low count number has been derived using the count rate to energy conversion factor for a “standard X-AGB spectral model” with NH = 3 × 1021 cm−2 and TX = 30 MK.
In this work, we extended the comparison of the X-ray and far-UV properties of X-AGBs with those of X-SySts presented by Ortiz & Guerrero (2021). After analyzing the far-UV and X-ray fluxes of all X-AGBs and X-SySts known to date, we confirm the relationship between the far-UV and X-ray luminosity formerly described by those authors. Besides, X-SySts tend to have higher far-UV and X-ray luminosity than X-AGBs, even though there is a notable overlap in the 29.5 < log(LX)(erg s−1)< 33.0 luminosity range. Most X-SySts within this luminosity range have β-, δ-, or β/δ-type X-ray spectra, suggesting that X-AGBs may share the same emission mechanisms (i.e., colliding winds and a boundary layer between an accretion disk and a companion, or a combination of both). Whereas the typical X-ray luminosity LX ≈ 1032 erg s−1 of X-SySts requires a WD accretor, the lower typical X-ray luminosity of X-AGBs, LX ≈ 5 × 1030 erg s−1 , implies a main-sequence solar-like F-K accretor.
The X-AGBs VXCir, IRAS 16263-4910, V501 Nor, and CH Ara exhibit the highest X-ray luminosities in the sample, similar to the maximum values observed among normal A- to K-giant stars. Consequently, they are considered potential SySts, and perhaps spectroscopic observations can eventually confirm this suspicion.
Future releases of eRASS will certainly discover new X-AGBs. Since the X-ray properties of β, δ, and β/δ type SySts are well-known to evolve fast in time, a similar behavior can be expected in X-AGBs, and therefore, this behavior should be monitored in time. Thus future releases of eRASS and/or devoted X-ray observations of X-AGBs may reveal an intrinsic variability in these sources as well.
Acknowledgements
M.A.G. acknowledges financial support from grants CEX2021-001131-S funded by MCIN/AEI/10.13039/501100011033 and PID2022-142925NB-I00 from the Spanish Ministerio de Ciencia, Innovación y Universidades (MCIU) cofunded with FEDER funds. J.A.T. thanks Dirección General de Asuntos del Personal Académico (DGAPA) of the Universidad Nacional Autónoma de México (UNAM, Mexico) project IA102324. R.O. acknowledges the São Paulo Research Foundation (FAPESP) for its financial support under grant #2023/05298-0. This work is based on data from eROSITA, the soft X-ray instrument aboard SRG, a joint Russian-German science mission supported by the Russian Space Agency (Roskosmos), in the interests of the Russian Academy of Sciences represented by its Space Research Institute (IKI), and the Deutsches Zentrum für Luft- und Raumfahrt (DLR). The SRG spacecraft was built by Lavochkin Association (NPOL) and its subcontractors, and is operated by NPOL with support from the Max Planck Institute for Extraterrestrial Physics (MPE). The development and construction of the eROSITA X-ray instrument was led by MPE, with contributions from the Dr. Karl Remeis Observatory Bamberg & ECAP (FAU Erlangen-Nuernberg), the University of Hamburg Observatory, the Leibniz Institute for Astrophysics Potsdam (AIP), and the Institute for Astronomy and Astrophysics of the University of Tübingen, with the support of DLR and the Max Planck Society. The Argelander Institute for Astronomy of the University of Bonn and the Ludwig Maximilians Universität Munich also participated in the science preparation for eROSITA. This publication makes also use of data products from the Two Micron All Sky Survey, which is a joint project of the University of Massachusetts and the Infrared Processing and Analysis Center/California Institute of Technology, funded by the National Aeronautics and Space Administration and the National Science Foundation. Finally, this work has made extensive use of the NASA’s Astrophysics Data System (ADS). RMJ acknowledges support from NASA contract NAS8-03060.
Appendix A eROSITA X-ray and 2MASS near-infrared images of high confidence X-AGB stars
In this appendix we present a comparison between X-ray and near-IR images of the sources classified as very likely detection in the eROSITA first data release.
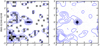 |
Fig. A.1 Images of eROSITA eRASS1 0.2-2.3 keV (left) and 2MASS K (right) overlaid with X-ray contours of IRAS 02346-6248 (also known as RS Hor). The contours have been derived from a resampled and Gaussian-smoothed X-ray image with levels at 30%, 50%, 70%, and 90% of the count peak in the central 2′ × 2′ region. |
Appendix B eROSITA X-ray and 2MASS near-infrared images of possible X-AGB stars
In this appendix we present X-ray and near-IR images of the sources defined as possible X-ray detections of AGB stars in the eROSITA first data release.
Appendix C eROSITA X-ray and 2MASS near-infrared images of confused X-AGB stars
Appendix D Spurious X-AGB stars in the eROSITA eRASS1 catalog
Spurious X-AGB stars in the eROSITA eRASS1 catalog.
References
- Arnaud, K. A. 1996, in Astronomical Society of the Pacific Conference Series, 101, Astronomical Data Analysis Software and Systems V, eds. Jacoby, G. H., & Barnes, J., 17 [Google Scholar]
- Ayres, T. R., Linsky, J. L., Vaiana, G. S., Golub, L., & Rosner, R. 1981, ApJ, 250, 293 [NASA ADS] [CrossRef] [Google Scholar]
- Brunner, H., Liu, T., Lamer, G., et al. 2022, A&A, 661, A1 [NASA ADS] [CrossRef] [EDP Sciences] [Google Scholar]
- Cardelli, J. A., Clayton, G. C., & Mathis, J. S. 1989, ApJ, 345, 245 [Google Scholar]
- Crandall, S., & Smith, G. H. 2023, AJ, 165, 70 [NASA ADS] [CrossRef] [Google Scholar]
- De Marco, O. 2009, PASP, 121, 316 [NASA ADS] [CrossRef] [Google Scholar]
- Engels, D., & Bunzel, F. 2015, A&A, 582, A68 [NASA ADS] [CrossRef] [EDP Sciences] [Google Scholar]
- Farihi, J., Hoard, D. W., & Wachter, S. 2010, ApJS, 190, 275 [NASA ADS] [CrossRef] [Google Scholar]
- Guerrero, M. A., & Ortiz, R. 2020, MNRAS, 491, 680 [NASA ADS] [CrossRef] [Google Scholar]
- Hünsch, M., Schmitt, J. H. M. M., Schroder, K.-P., & Zickgraf, F.-J. 1998, A&A, 330, 225 [NASA ADS] [Google Scholar]
- Jorissen, A., Schmitt, J .H. M. M., Carquillat, J. M., Ginestet, N., & Bickert, K. F. 1996, A&A, 306, 467 [NASA ADS] [Google Scholar]
- Jorissen, A., Boffin, H. M. J., Karinkuzhi, D., et al. 2019, A&A, 626, A127 [NASA ADS] [CrossRef] [EDP Sciences] [Google Scholar]
- Jura, M., & Helfand, D.J. 1984, ApJ, 287, 785 [NASA ADS] [CrossRef] [Google Scholar]
- Kastner, J. H., & Soker, N. 2004, ApJ, 616, 1188 [CrossRef] [Google Scholar]
- Linsky, J. L., & Haisch, B. M. 1979, ApJ, 229, L27 [Google Scholar]
- Liu, T., Buchner, J., Nandra, K., et al. 2022, A&A, 661, A5 [NASA ADS] [CrossRef] [EDP Sciences] [Google Scholar]
- Loup, C., Forveille, T., Omont, A., & Paul, J. F. 1993, A&AS, 99, 291 [NASA ADS] [Google Scholar]
- Luna, G. J. M., Sokoloski, J. L., Mukai, K., & Nelson, T. 2013, A&A, 559, A6 [NASA ADS] [CrossRef] [EDP Sciences] [Google Scholar]
- McDonald, I., Zijlstra, A. A., & Boyer, M. L. 2012, MNRAS, 427, 343 [Google Scholar]
- Merc, J., Gális, R., & Wolf, M. 2019, AN, 340, 598 [NASA ADS] [Google Scholar]
- Merc, J., Beck, P. G., Mathur, S.,& Garcia, R. A. 2024, A&A, 683, A84 [NASA ADS] [CrossRef] [EDP Sciences] [Google Scholar]
- Merloni, A., Lamer, G., Liu, T., et al. 2024, A&A, 682, A34 [NASA ADS] [CrossRef] [EDP Sciences] [Google Scholar]
- Montez, R.Jr., Ramstedt, S., Kastner, J. H., Vlemmings, W., & Sanchez, E. 2017, ApJ, 841, 33 [NASA ADS] [CrossRef] [Google Scholar]
- Mürset, U., Wolff, B., & Jordan, S. 1997, A&A, 319, 201 [NASA ADS] [Google Scholar]
- Nuñez, N. E., Luna, G. J. M., Pillitteri, I., & Mukai, K. 2014, A&A, 565, A82 [NASA ADS] [CrossRef] [EDP Sciences] [Google Scholar]
- Nuñez, N. E., Nelson, T., Mukai, K., Sokoloski, J. L., & Luna, G. J. M. 2016, ApJ, 824, 23 [CrossRef] [Google Scholar]
- Orio, M., Zezas, A. Munari, U., Siviero, A., & Tepedelenlioglu, E. 2007, ApJ, 661, 1105 [NASA ADS] [CrossRef] [Google Scholar]
- Ortiz, R., & Guerrero, M. A. 2016, MNRAS, 461, 3036 [NASA ADS] [CrossRef] [Google Scholar]
- Ortiz, R., & Guerrero, M. A. 2021, ApJ, 912, 93 [Google Scholar]
- Ortiz, R., Guerrero, M. A., & Costa, R. D. D. 2019, MNRAS, 482, 4697 [CrossRef] [Google Scholar]
- Patterson, J., & Raymond, J. C. 1985, ApJ, 292, 535 [NASA ADS] [CrossRef] [Google Scholar]
- Predehl, P., Andritschke, R., Arefiev, V., et al. 2021, A&A, 647, A1 [EDP Sciences] [Google Scholar]
- Pringle, J. E., & Savonije, G. J. 1979, MNRAS, 187, 777 [NASA ADS] [CrossRef] [Google Scholar]
- Ramstedt, S., Montez, R., Kastner, J., & Vlemmings, W. H. T. 2012, A&A, 543, A147 [NASA ADS] [CrossRef] [EDP Sciences] [Google Scholar]
- Sahai, R., Sanz-Forcada, J., Sánchez-Contreras, C., & Stute, M. 2015, ApJ, 810, 77 [NASA ADS] [CrossRef] [Google Scholar]
- Sahai, R., Sanz-Forcada, J., Guerrero, M., Ortiz, R., & Sánchez-Contreras, C. 2022, Galaxies, 10, 62 [NASA ADS] [CrossRef] [Google Scholar]
- Samus, N. N., Kazarovets, E. V., Durlevich, O .V., Kireeva, N. N., & Pastukhova, E. N. 2017, Astron. Rep., 61, 80 [CrossRef] [Google Scholar]
- Schmitt, J. H. M. M., Collura, A., Sciortino, S., Vaiana, G. S., & Rosner, R. 1990, ApJ, 365, 704 [NASA ADS] [CrossRef] [Google Scholar]
- Schmidt, M. R., Zacs, L., Mikolajewska, J., et al. 2006, A&A, 446, 603 [NASA ADS] [CrossRef] [EDP Sciences] [Google Scholar]
- Schmitt, J. H. M. M., Hünsch, M., Schneider, P. C., et al. 2024, A&A, 688, A9 [NASA ADS] [CrossRef] [EDP Sciences] [Google Scholar]
- Soker, N., & Kastner, J. H. 2003, ApJ, 592, 498 [NASA ADS] [CrossRef] [Google Scholar]
- Sokolovski, J. L., & Bildstein, L. 2010, ApJ, 723, 1188 [NASA ADS] [CrossRef] [Google Scholar]
- Soszynski, I., Udalski, A., Szymaski, M. K., et al. 2013, Acta Astron., 63, 21 [Google Scholar]
- Suh, K-.W., & Hong, J. 2017, JKAS, 50, 131 [NASA ADS] [Google Scholar]
- Suh, K.-W. 2021, ApJS, 256, 43 [NASA ADS] [CrossRef] [Google Scholar]
- Toalá, J. A. 2024, MNRAS, 528, 987 [CrossRef] [Google Scholar]
- Whitelock, P. A., Marang, F., & Feast, M. 2000, MNRAS, 319, 728 [Google Scholar]
- Whitelock, P. A., Feast, M. W., Marang, F., & Groenewegen, M.A.T. 2006, MNRAS, 369, 751 [NASA ADS] [CrossRef] [Google Scholar]
- Yu, Z.-L., Xu, X.-J., Shao, Y., Wang, Q. D., & Li, X.-D. 2022, ApJ, 932, 132 [NASA ADS] [CrossRef] [Google Scholar]
Schmitt et al. (2024) considered R Hor, U Men, and RL Mi to be spurious detections caused by optical loading of the X-ray detectors.
GALEX, DSS, and 2MASS images were examined as well.
Sahai et al. (2015) determined an X-ray luminosity of 3.0 × 1031 erg s−1 for a plasma with temperature 7.4 × 10⁷ K using XMM-Newton data.
All Tables
Flux correction unitless factors (FCFs) of the eRASS1 catalog for absorbed apec plasma models.
Observed X-ray flux (0.2–2.3 keV) and intrinsic luminosity (0.3–10.0 keV) of eRASS1 X-AGBs.
All Figures
|
Fig. 1 Count rate of eRASS1 ML1 (0.2–2.3 keV) versus Gaia DR3 G magnitudes of AGB stars in eRASS1. The blue open symbols correspond to X-ray sources flagged as likely contaminated by optical loading. |
| In the text | |
|
Fig. 2 Histogram of the positional offset between an AGB star and its associated eRASS1 X-ray counterpart relative to the 1-σ positional uncertainty of the latter for most likely, possible, and spurious X-AGBs in Tables 1, 2, and D.1, respectively. The histogram of the possible X-AGBs (black histogram) was added together with that of the most likely X-AGBs (blue histogram and shade). The histogram and shade of the spurious X-AGBs are shown in purple. The spurious X-AGBs associated with diffuse X-ray sources or those superimposed on diffuse emission are not included. |
| In the text | |
|
Fig. 3 Background-subtracted eROSITA spectra of CPD–84 86, HD 120832, IRAS 16263–4910, and VX Cir (black diamonds). The black solid histograms represent the best fits. Fractional residuals are presented in the bottom panels. The spectra were binned requesting a minimum of five counts per spectral bin. |
| In the text | |
|
Fig. 4 GALEX [FUV] absolute magnitude (M[FUV]) versus the X-ray luminosity of AGB and SySts. The X-ray AGB stars discovered by eROSITA are plotted with red symbols (squares = this work; circles = Schmitt et al. 2024); X-AGBs discovered by other X-ray surveys are shown with black circles; and SySts are shown with blue circles. The open symbols represent upper limits for M[FUV], calculated at the GALEX detection threshold according to Montez et al. (2017). The arrow represents the far-UV extinction corresponding to one visual magnitude, assuming A[FUV]/AV = 2.6 (Cardelli et al. 1989). The solid line shows a least-squared fit (see Eq. 3) to all detected sources, while the dashed and dotted lines represent the 1-σ and 2-σ confidence levels, respectively. |
| In the text | |
|
Fig. 5 Histogram of the X-ray luminosity of AGB stars and SySts. Previously known X-AGB stars are shown with black crossed-dashed symbols, newly found X-AGBs are shown with black diagonal-dashed symbols. The X-SySts are shown with colors, according to the classification of their X-ray spectra, as labeled. The dotted and solid histograms are the best least-squared Gaussian fits to the X-AGBs and X-SySts, respectively. |
| In the text | |
|
Fig. A.1 Images of eROSITA eRASS1 0.2-2.3 keV (left) and 2MASS K (right) overlaid with X-ray contours of IRAS 02346-6248 (also known as RS Hor). The contours have been derived from a resampled and Gaussian-smoothed X-ray image with levels at 30%, 50%, 70%, and 90% of the count peak in the central 2′ × 2′ region. |
| In the text | |
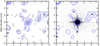 |
Fig. A.2 Same as Fig. A.1 but for IRAS 05166–2215 (also known as RZ Lep). |
| In the text | |
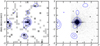 |
Fig. A.3 Same as Fig. A.1 but for IRAS 06024–8403 (also known as CPD–84 86). |
| In the text | |
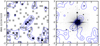 |
Fig. A.4 Same as Fig. A.1 but for IRAS 12118-5115 (also known as TV Cen). |
| In the text | |
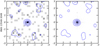 |
Fig. A.5 Same as Fig. A.1 but for IRAS 13548–3049 (also known as TWCen). |
| In the text | |
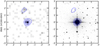 |
Fig. A.6 Same as Fig. A.1 but for IRAS 14188-6943 (also known as VX Cir). |
| In the text | |
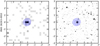 |
Fig. A.7 Same as Fig. A.1 but for IRAS 16263-4910. |
| In the text | |
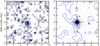 |
Fig. B.1 Same as Fig. A.1 but for IRAS 11390–7213 (also known as MQ Mus). |
| In the text | |
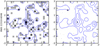 |
Fig. B.2 Same as Fig. A.1 but for IRAS 11510–6046 (also known as V1245 Cen). |
| In the text | |
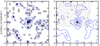 |
Fig. B.3 Same as Fig. A.1 but for J131821.14–504539.7 (also known as CGCS 3366). |
| In the text | |
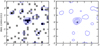 |
Fig. B.4 Same as Fig. A.1 but for IRAS 13494–0313 (also known as HD 120832). |
| In the text | |
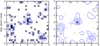 |
Fig. B.5 Same as Fig. A.1 but for IRAS 16047–5449 (also known as V501 Nor). |
| In the text | |
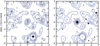 |
Fig. B.6 Same as Fig. A.1 but for IRAS 17023–5859 (also known as CH Ara). |
| In the text | |
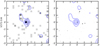 |
Fig. B.7 Same as Fig. A.1 but for V371 CrA. |
| In the text | |
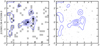 |
Fig. C.1 Same as Fig. A.1 but for J132601.58–473306.0 (aka CGCS 3382). |
| In the text | |
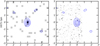 |
Fig. C.2 Same as Fig. A.1 but for V975 Oph. |
| In the text | |
Current usage metrics show cumulative count of Article Views (full-text article views including HTML views, PDF and ePub downloads, according to the available data) and Abstracts Views on Vision4Press platform.
Data correspond to usage on the plateform after 2015. The current usage metrics is available 48-96 hours after online publication and is updated daily on week days.
Initial download of the metrics may take a while.