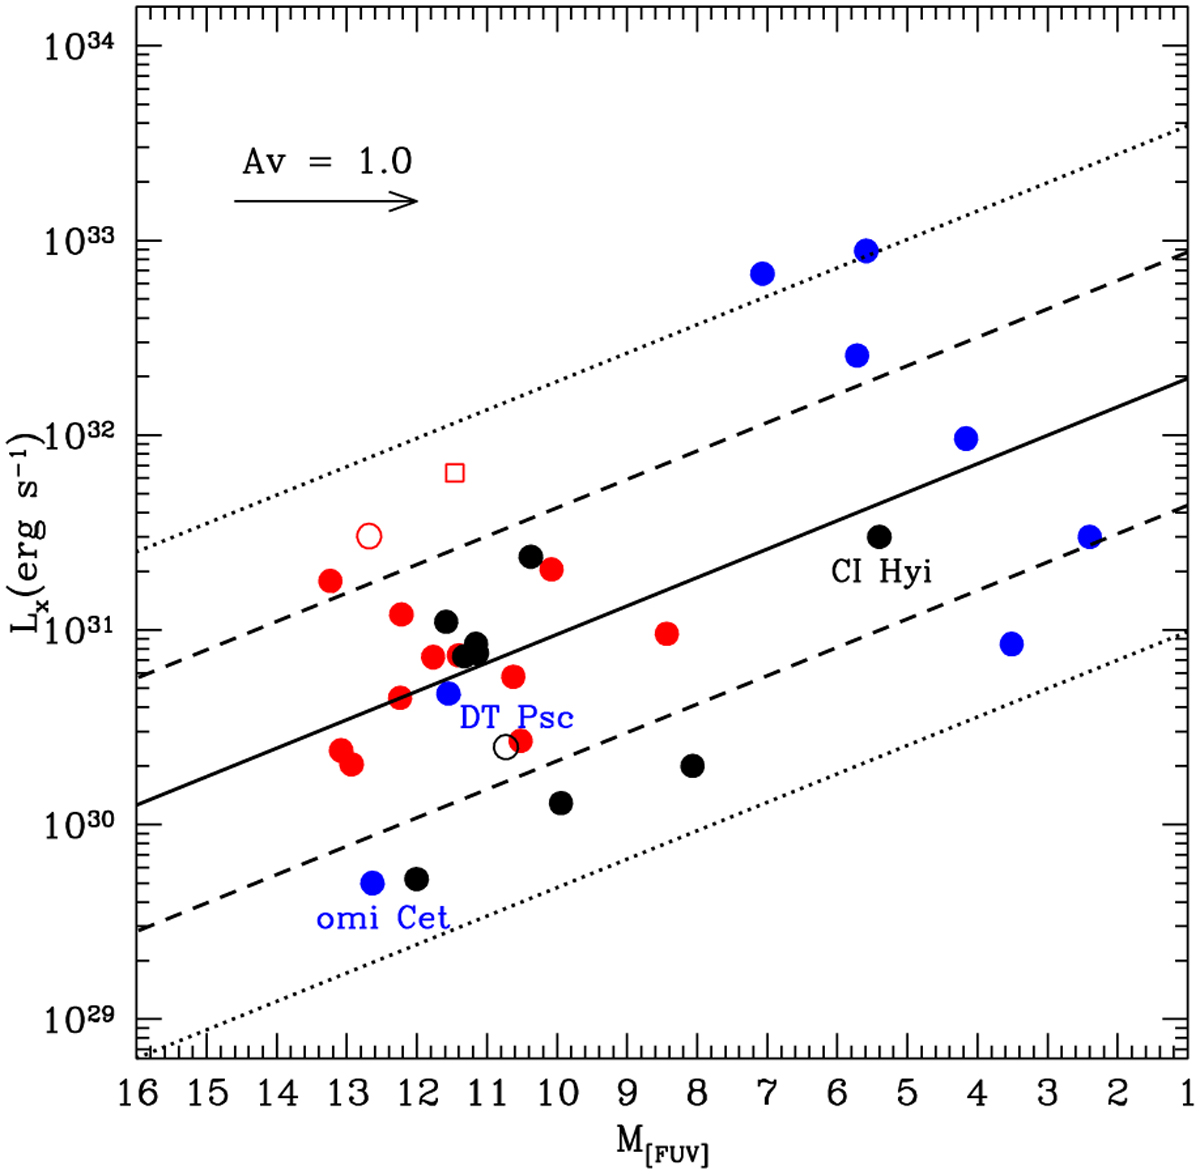
Fig. 4
Download original image
GALEX [FUV] absolute magnitude (M[FUV]) versus the X-ray luminosity of AGB and SySts. The X-ray AGB stars discovered by eROSITA are plotted with red symbols (squares = this work; circles = Schmitt et al. 2024); X-AGBs discovered by other X-ray surveys are shown with black circles; and SySts are shown with blue circles. The open symbols represent upper limits for M[FUV], calculated at the GALEX detection threshold according to Montez et al. (2017). The arrow represents the far-UV extinction corresponding to one visual magnitude, assuming A[FUV]/AV = 2.6 (Cardelli et al. 1989). The solid line shows a least-squared fit (see Eq. 3) to all detected sources, while the dashed and dotted lines represent the 1-σ and 2-σ confidence levels, respectively.
Current usage metrics show cumulative count of Article Views (full-text article views including HTML views, PDF and ePub downloads, according to the available data) and Abstracts Views on Vision4Press platform.
Data correspond to usage on the plateform after 2015. The current usage metrics is available 48-96 hours after online publication and is updated daily on week days.
Initial download of the metrics may take a while.