| Issue |
A&A
Volume 688, August 2024
|
|
|---|---|---|
| Article Number | A9 | |
| Number of page(s) | 12 | |
| Section | Galactic structure, stellar clusters and populations | |
| DOI | https://doi.org/10.1051/0004-6361/202449181 | |
| Published online | 30 July 2024 | |
“Forbidden” stars in the eROSITA all-sky survey: X-ray emission from very late-type giants
1
Hamburger Sternwarte Universität Hamburg, Gojenbergsweg 112, 21029 Hamburg, Germany
e-mail: This email address is being protected from spambots. You need JavaScript enabled to view it.
2
Max-Planck-Institut für Extraterrestrische Physik, Gießenbachstraße 1, 85748 Garching bei München, Germany
3
Thüringer Landessternwarte Karl-Schwarzschild- Observatorium, Sternwarte 5, 07778 Tautenburg, Germany
4
Leibniz-Institut für Astrophysik, An der Sternwarte 16, 14482 Potsdam, Germany
Received:
8
January
2024
Accepted:
25
April
2024
Abstract
We present the results of the first X-ray all-sky survey (eRASS1) performed by the eROSITA instrument aboard the Spectrum-Roentgen-Gamma (SRG) mission on X-ray emitting red giants and supergiants. Focusing on stars positioned at high galactic latitudes above 20°, we constructed a complete sample of such objects using the Gaia DR3 catalog and identified a sample 96 stars that appear as bona fide entries in the eRASS1 source catalog. By again restricting the sample to objects nearer than 1300 pc and eliminating all catalog entries that are due to optical contamination, we ended up with a sample of 16 genuine red giant or supergiant X-ray sources, most of which represent new X-ray detections. We present a low signal-to-noise X-ray spectrum of the nearby low-activity giant Arcturus obtained from a pointed observation with the XMM-Newton satellite and give a detailed account of our data analysis. We show that Arcturus-like X-ray emission cannot be the explanation for the X-ray emissions observed by eROSITA and provide a discussion of the possible nature of the detected X-ray sources.
Key words: stars: activity / binaries: close / binaries: symbiotic / Hertzsprung-Russell and C-M diagrams
© The Authors 2024
 Open Access article, published by EDP Sciences, under the terms of the Creative Commons Attribution License (https://creativecommons.org/licenses/by/4.0), which permits unrestricted use, distribution, and reproduction in any medium, provided the original work is properly cited.
This article is published in open access under the Subscribe to Open model. This email address is being protected from spambots. You need JavaScript enabled to view it. to support open access publication.
1. Introduction
In flux-limited large-area soft X-ray surveys, such as those carried out by the Einstein and ROSAT observatories (Stocke et al. 1991; Freund et al. 2022), “normal” (i.e., coronal) stars constitute a significant fraction of the overall source population and are typically responsible for about a fourth to a third of the detected X-ray source population. In this context, we refer to normal stars as stars for which accretion processes do not play a significant role for the generation of X-ray emission. The vast majority of these X-ray-detected objects are late-type stars on or near the main sequence with rather deep outer convection zones, where – presumably – dynamo-related magnetic activity processes similar to those observed on the Sun take place but at levels usually much higher than the emission levels encountered in the Sun. Other normal stars would be early-type stars of spectral types O or B and (non-accreting) white dwarfs. However, these source types account only for a very small fraction of the overall stellar X-ray source population detected, for example, by eROSITA.
In stars with outer convection zones, coronal X-ray emission is essentially ubiquitous, as demonstrated by volume-limited X-ray surveys of late-type (main-sequence) stars in the immediate solar vicinity where one achieves X-ray detection rates of almost 100% (Schmitt 1997). This finding lends strong support to the view that magnetic activity and X-ray emission is indeed a very typical characteristic of such stars and directly leads to the rotation-age-activity paradigm, which holds that stars are born as rapid rotators with ensuing high levels of magnetic activity. Magnetic braking then leads to a slow-down of stellar rotation that in turn leads to a reduction of activity, eventually reaching the levels known from the Sun, which is quite inactive compared to a typical stellar source detected in an X-ray survey.
This paradigm applies to stars on or near the main sequence, and the question arises as to whether it also applies to giants of late spectral type. For such stars, the picture, which we briefly sketch in the following paragraph, is more complicated. Evolved giants have an internal structure very different from their dwarf (main-sequence) siblings. Stars of low to intermediate mass leave the main sequence once the core hydrogen (H) is exhausted. In such stars, H-burning continues in a shell around an inert helium core, while the outer regions expand so that the stars become sub-giants and eventually red giant branch (RGB) stars. With the star moving up the RGB, the outer convective envelope becomes deeper and deeper, and shell energy production increases. Once at the tip of the RGB, the core mass is sufficiently large and the core temperature is sufficiently high to start the burning of helium in the core. Helium burning starts with an He flash, and finally the stars arrive on the horizontal branch, that is, the He-burning main sequence. Stars of solar mass spend a comparatively long time in that stage and are therefore prominently seen in many surveys, including X-ray surveys. Eventually, all of the core helium is transformed into carbon and oxygen, He-burning in the core ceases, and the star travels up the asymptotic giant branch (AGB).
As described above, late-type giants have deep convection zones, which is one of the prerequisites for stellar activity, yet the rotational velocities of such stars are usually quite low, as they were already slow rotators on the main sequence or were slowed down during their evolution toward the giant phase, depending on the initial mass. However, there are exceptions to this “rule”. In close binary systems, tidal forces can maintain large rotational velocities, and for example, the short period RS CVn binaries, which are composed of two giants of late spectral type, are among the brightest coronal X-ray sources. The very few known fast-rotating single giants are either situated in the Hertzsprung gap or may have formed out of coalesced binaries of the W UMa type (Bopp & Stencel 1981).
Extensive studies of X-ray emission among giant stars have been carried out with the Einstein Observatory (Ayres et al. 1981) and ROSAT (Haisch et al. 1991, 1992; Hünsch et al. 1996, 1998b; Schröder et al. 1998). These studies have indicated at least a strong decrease in X-ray emission toward later spectral types with a virtual extinction of X-ray emission near spectral type K3. This decrease in X-ray emission goes along with a corresponding decrease in UV emission lines, indicating the presence of hot transition regions. These findings have led to the concept of a so-called X-ray dividing line (XDL) in the HR diagram. Giants on the “X-ray side” of the XDL have hot coronae, while giants on the other side have massive cool winds, as first realized by Linsky & Haisch (1979) on the basis of IUE spectra, and the non-detection of X-rays to the right of the XDL has been attributed to the absence of hot plasma in the low-gravity atmospheres of these stars.
No generally accepted physical interpretation of the XDL has been put forward. Hünsch & Schröder (1996) investigated the X-ray emission of late-type giants in relation to their masses and evolutionary status and suggested that the XDL does not actually reflect the decrease of stellar activity in the course of stellar evolution, yet they proposed the XDL to lie approximately parallel to the RGB, and it seems to be a consequence of lower stellar masses and longer evolutionary timescales. Hence the virtual absence of X-ray emission among giants later than K3 is more related to their rareness, their generally higher luminosities, and larger distances, yielding less sensitive detection limits in X-ray surveys. On the other hand, Rosner et al. (1991) proposed that the surface magnetic field configuration changes take place as one moves along the giant and supergiant tracks in the Hertzsprung-Russell diagram and that these changes are responsible for the appearance of the XDL. Finally, there is the concept of “buried coronae” introduced by Ayres et al. (2003), who argued that the chromospheres of low-gravity giants are much thicker than those of stars on the main sequence. Therefore, any hot emission zones above the photospheres could be buried – at least partially – by large columns of chromospheric material so severely as to reduce the observable X-ray emission.
A prototypical example of such a buried corona is, according to Ayres (2018), the nearby giant Arcturus (spectral type K1.5III, d = 11.3 pc), a low-mass Pop II star of rather high age. Ayres (2018) reports an X-ray detection at a level of LX ≈ 3 × 1025 erg s−1 obtained from a 98 ksec exposure with the Chandra HRC. This value is almost two orders of magnitude below solar levels and, if typical, makes such stars essentially undetectable if located at larger distances. In terms of fractional X-ray luminosity, Ayres (2018) determined a value of LX/Lbol ≈ 5 × 10⁻¹¹, which is almost 5000 times smaller than the corresponding value for the already rather X-ray dim Sun. Unfortunately, the Chandra HRC does not provide spectral resolution at X-ray wavelengths, so no information on the energy distribution of the Arcturus X-ray emission is available.
However, more sensitive X-ray observations by ROSAT revealed X-ray emission of various giants of later spectral types, which seemed to defy the concept of an XDL. One such class are the hybrid stars, which are giants that simultaneously show both the signatures of hot coronae and cool winds. Reimers & Schmitt (1992) and Reimers et al. (1996) demonstrated the ubiquity of X-ray emission among hybrid stars based on pointed observations with the ROSAT PSPC. Ayres (2005) challenged some of the detections reported by Reimers and collaborators, arguing that nearby companions were actually responsible for the detected X-ray emission. A deeper pointing with the Chandra HRC showed, at least in one of the disputed cases ( i.e., γ Dra), the clear presence of an X-ray source exactly at the expected position (Ayres et al. 2006) of γ Dra; however, the Chandra pointing also revealed a second source 21 arcsec southeast of γ Dra coincident with ADS 10923B (=Gaia DR3 1367669392666164480), which actually dominates the total X-ray flux. Ayres et al. (2006) speculated that this companion is actually physical, a speculation confirmed by the almost identical Gaia parallaxes of γ Dra and ADS 10923B.
Even farther on the cool side of the XDL are the M-type giants. Hünsch et al. (1998a) used the ROSAT all-sky survey data to search for X-ray emission from “bona fide” M-type giants by matching a sample of 482 such stars extracted from the Bright Star Catalog and found eleven positional coincidences. Among those, Hünsch et al. (1998a) expected three spurious coincidences, and in four cases, the X-ray emission was very likely related to the symbiotic nature of the stars, that is, these stars have known companions, while the remaining four cases were identified as bona fide candidates for possibly intrinsic X-ray emission from such stars, which may of course be hitherto unknown binaries, such as symbiotic stars (SySts). We note that SySts are binary systems consisting of a red giant orbited by a sufficiently hot companion, typically a white dwarf or neutron star (for a recent review of SySts, we refer to Munari 2019). High temperature material in such systems may be produced either by accretion or by nuclear burning processes on the surface of the white dwarf. Such systems are prone to producing outbursts and various kinds of photometric variability.
Among the M-type giants, a large fraction are on the asymptotic giant branch (AGB), that is, stars that have finished their helium-burning phase, have an inert core consisting of carbon and oxygen, and thus have advanced considerably in their overall stellar evolution. Located far away from the dividing line, such stars are not really expected to intrinsically emit X-rays, yet some recent studies suggest that such stars can indeed be X-ray sources. Sahai et al. (2015) carried out a pilot study and detected, using data from the XMM-Newton and Chandra Observatories, X-ray emission from three (out of six) AGB stars pre-selected from an FUV excesses. Ortiz & Guerrero (2021) crossmatched the XMM-Newton 4XMM-DR9 catalog of X-ray sources with a list of pre-selected AGB stars and ended up with a sample of 17 reliable detections, six of them being new detections, while the remaining eleven objects had previously been reported as X-ray sources and detected with ROSAT, XMM-Newton, or Chandra. The X-ray luminosities of these objects are typically in the range 1030–1031 erg s−1 (if one leaves out three observations of Y Gem taken in the fall of 2015), which is far larger than “typical” coronal X-ray luminosities, and just like Hünsch et al. (1998a), these authors have suggested that the underlying stars are SySts.
Thus, binarity may indeed play an important role in our understanding of X-ray emission from those objects and of chemical peculiarities of some objects. For example, Jorissen et al. (2019) report the results of a long-term radial velocity monitoring campaign of a few dozen barium stars, that is, a class of red giants of spectral type G or K with strong absorption lines of barium. Orbital motion is detected in all systems with periods ranging from two years to hundreds of years, and further, the masses of the companion white dwarfs are shown to be in the range of 0.5–0.9 M⊙. Given that the bright components in these systems are giants of substantial size, it is very clear that any periodicity due to a fainter companion must occur on rather long timescales, requiring some stamina for optical followup.
Thus, whether very cool giants possess coronal plasma or not is still not fully clear, and furthermore, the role of binarity with regard to the activity properties of these stars is also open. In the meantime, new data sets in the optical and X-ray range have become available, which allow these issues to be reexamined. The eROSITA (extended ROentgen Survey with an Imaging Telescope Array) all-sky survey (Predehl et al. 2021) is far more sensitive than the “old” ROSAT all-sky survey and has a far better positional accuracy. Furthermore, with the information from the Gaia DR3 release of the Gaia mission (Gaia Collaboration 2016), a very deep survey of the optical sky including parallaxes has become available. With these data, it is possible to construct an essentially complete sample of red giants and supergiants in the solar neighborhood and to conduct an unbiased search for X-ray emission from such objects. Finally, a deep XMM-Newton pointing on Arcturus has become available, and it enables the study of the spectral properties of a giant star very close to the dividing line.
The plan of our paper is therefore as follows: We first present (in Sect. 2) new XMM-Newton data of the nearby prototypical K giant Arcturus to set the context for the subsequent eROSITA sample study of M giants. Next, we briefly discuss (in Sect. 3) the eROSITA data used in our analysis, in particular the construction of a complete sample of such M-type giants. In Sect. 4, we then present our results. We discuss our identification procedures, the color-magnitude diagram for the selected sources, the optical contamination problem, and our final candidate sample. Finally, in Sect. 5, we put everything together and provide an in-depth discussion of our results.
2. XMM-Newton observation of Arcturus
Before discussing our main sample of M-type giants, we review the coronal, or perhaps non-coronal, properties of the prototypical “non-coronal” K giant Arcturus, which is just to the right of the coronal dividing line. To this end, we present a new X-ray pointing obtained with the XMM-Newton observatory.
2.1. XMM-Newton data analysis
We observed Arcturus for 80 ks in a continuous exposure using XMM-Newton; the details of this observation are listed in Table 1. The optical brightness of Arcturus required the use of the “thick filter” for all EPIC detectors and mandated the optical monitor to be switched off so that no simultaneous UV or optical data were obtained. We processed the data with SAS version 19.1.0, using standard procedures and applying standard filters. The observation was unaffected by background flares.
XMM-Newton observing details for Arcturus (Obs-Id 0865070101).
No strong X-ray source was immediately visible at the nominal position of Arcturus. To check for possible weak X-ray emission from Arcturus, we therefore concentrated on the pn-detector1 and specifically examined the energy range between 300 eV to 725 eV, which is centered on the O VII triplet. Source photons were extracted in a circular source region at the nominal position of Arcturus. Here we report numbers using a source region circle with a 15-arcsec radius which contains 66 photons, and we note that smaller source region radii produce comparable results.
The background around Arcturus does show some spatial structure so that (a) it is not a priori clear where the bona fide background should be placed on the detector and (b) the number of excess photons depends, to some degree, on the choice of the background region. The most realistic background region is likely an annulus around the source without the part of the annulus that would extend closer to the detector gap than the source itself. We used inner and outer radii of the annulus of 31 and 61 arcsec, so its size is almost eight times larger than the 15 arcsec source circle. Different choices for the background lead to slightly different but statistically comparable results. In particular, we considered circular background regions at different reasonable locations near the nominal source position (e.g., at various distances to the source and of different radii). These various background regions suggest expectation values for the background in the source region of ∼50 counts with a range of 46 and 56 counts, while the annulus gives 50.4.
With everything taken together, the XMM-Newton data reveal a small but significant photon excess in the source region of approximately 16 photons. Depending on the exact choice of the background region, we found a range of ten to 20 net source photons. The inhomogeneous background thus leads to a systematic uncertainty in the net source photon number of about 50%. The “nominal” value of 66 photons in the source region on an expected background of 50.4 counts gives a statistical chance of 1.5% to be a background fluctuation (the probability range using the different background regions extends from 0.2% to 8.3%). Therefore, we concluded that a small but statistically significant photon excess is indeed detected at the position of Arcturus.
2.2. Spectral analysis of the XMM-Newton Arcturus data
We next discuss to what extent Arcturus can be considered a “prototypical” X-ray emitting giant. Unfortunately, the rather small number of recorded source photons from Arcturus prohibits detailed spectral modeling of the X-ray data. Nevertheless, the number of source photons recorded in the different energy bands does allow some estimates of the plasma temperature.
An investigation of the spectral distribution of the source photons showed that most events are detected with energies between 300 and 725 eV, and a marginal excess may also be present at energies between 200 and 300 eV, but this is not significant and confirms that optical contamination is insignificant for our XMM-Newton data. Also, no significant excess was seen at energies above 725 eV, with the measured counts matching expectations from background extrapolations (i.e., only very soft source photons are detected). This pattern is indicative of emission from a (very) cool plasma compared to the active stellar coronae typically encountered in flux-limited surveys. We further note that it is the use of the thick filter and its small effective area that leads to the small number of detected photons below 300 eV.
The lack of more energetic source photons does imply a plasma temperature below 3 MK; otherwise, the predicted number of 725–1500 eV source photons would violate the 90 % upper limit. The nominally measured band count rates are best compatible with a plasma temperature around 1.5 MK, leading to a 0.2–2.0 keV flux of about 1.3 × 10⁻¹⁵ erg s−1 cm−2 (LX = 2 × 1025 erg s−1). Requiring that Arcturus has the same nominal flux as that reported by Ayres (2018) would require a plasma temperature closer to 1 MK, while temperatures below 8 × 10⁵ K would produce an equal number of 200–300 eV and 300–725 eV photons, which is incompatible with the data. In summary, the XMM-Newton data of Arcturus are compatible with the Chandra HRC-I data for plasma temperatures around 1 MK and independently restrict the plasma temperature to log T = 5.9…6.5. Within this temperature range, the energy conversion factor (ECF) may deviate by approximately 50% from its value at 1.5 MK.
We point out that the above flux and temperature estimates ignore any potential circumstellar absorption, and the data are surprisingly insensitive to adding moderate amounts of absorption. For example, a column density of NH = 2 × 1021 cm−2 shifts the corresponding nominal plasma temperature to 1 MK but remains compatible with the data. This is due to two factors. First, increasing the absorbing column density can be compensated by decreasing the plasma temperature to some degree. Second, the rather high background in the lowest energy bands prevents strong flux constraints with regard to intermediate photon energies (above 0.3 keV), that is, an observed spectrum without flux below 0.3 keV is compatible with the data. For the Arcturus XMM-Newton data, column densities above 5 × 1021 cm−2 start to produce too few photons below 500 eV, even for very low plasma temperatures of 0.5 MK. The latter case corresponds to an emitted flux of about 10−12 erg s−1 cm−2 and an intrinsic X-ray luminosity LX of 1.5 × 1028 erg s−1. However, whether such low “coronal” temperatures2 are realistic is debatable. At any rate, requiring that the plasma temperature is greater than 106 K implies a column density below 2 × 1021 cm−2.
2.3. Arcturus X-ray emission in context
We first note that Arcturus appears to be a persistent X-ray source. The nominal X-ray flux from Arcturus of about 1.3 × 10⁻¹⁵ erg s−1 cm−2 as measured by XMM-Newton is somewhat lower than the value reported by Ayres (2018) from the combined Chandra HRC-I data (2 × 10⁻¹⁵ erg s−1 cm−2), but it is compatible within the uncertainties. Interestingly, Ayres (2018) noted that the count rate for the 2018 Chandra observation is about twice as high as during 2002, with large uncertainties, however. Thus, the somewhat lower nominal flux during the XMM-Newton observation may indicate some intrinsic variability in the X-ray flux of Arcturus. In any case, Arcturus is certainly among the faintest X-ray stars detected so far, and its X-ray emission does stem from rather cool plasma around 1 MK. There is no evidence for significant absorption, yet the available limits on the absorbing column density permit moderate absorption columns of up to 2 × 1021 cm−2.
Extrapolating the Arcturus results then suggests that the fate of X-ray emission near the dividing line is caused by a true decrease in coronal emission and not just by extinction of bright X-ray emission of an intrinsically “powerful” corona. If Arcturus is indeed typical for the giant stars near the XDL, the results imply that the X-ray flux and the plasma temperature decrease when moving from left to right of the dividing line, and both features together make stars to the right of the dividing line X-ray faint.
In summary, the new XMM-Newton data of Arcturus suggest the presence of a very weak, low-temperature corona. This is likely typical for “non-coronal” K giants at and immediately to the right of the originally proposed XDL. In the following section, we evaluate the properties of the detected eROSITA target M giants far to the right of the XDL with our Arcturus results in mind.
3. Data and data analysis
3.1. SRG data
For our study, we used data from the eROSITA instrument on board the Russian-German Spectrum-Roentgen-Gamma (SRG) mission. After its launch from Baikonur, Kazachstan, SRG was put into a halo orbit around L2, whereupon it started its all-sky survey in December 2019. The eROSITA all-sky survey is carried out in a way very similar to the ROSAT all-sky survey, that is, the sky is scanned in great circles perpendicular to the plane of the ecliptic. The longitude of the scanned great circle moves by ∼1° per day. Thus, after half a year, the whole sky is covered. A detailed description of the eROSITA instrument and its hardware has been presented by Predehl et al. (2021).
For this study we only used the data from the first eROSITA all-sky survey, specifically the first catalog covering the western Galactic hemisphere published by Merloni et al. (2024), who provide a detailed account of the eROSITA hardware as well as the data products derived by the eSASS software system used for source detection and X-ray source catalogs creation. It is important to keep in mind that the quoted catalog count rates are fiducial count rates in the sense that they refer to the on-axis count rates one would have measured if all seven eROSITA telescopes were simultaneously observing the source under consideration on axis. During the survey operations, the off-axis angle changes all the time, and all seven telescopes may not deliver useful data at any given time. Hence, the actually measured mean count rates are converted to a fiducial on-axis count rate. The SASS software performs source detection in various energy bands, and in this paper, we use the count rates derived from the so-called 1B detection in the 0.2–2.3 keV energy band using a flux conversion factor of (ECF) of 9 × 10⁻¹³ erg cm−2 cnt−1 to convert count rates into energy fluxes. This ECF is appropriate for a thermal plasma emission with a temperature of 1 keV and an absorption column of 3 × 1019 cm−2 and differs slightly from the fluxes quoted by Merloni et al. (2024), who used an ECF appropriate for non-thermal sources. No attempt was made to apply individual conversion factors to individual sources based on their X-ray spectra. Thus, the quoted X-ray fluxes refer to the energy band 0.2 keV–2.3 keV, which is well matched to the ROSAT band. We have access to eROSITA data only at galactic longitudes l ≥ 180°, and furthermore, to avoid source confusion and any ensuing identification problems, we only considered the high galactic latitude sky with |b| = 20°. Finally, we note that we used only sources with a detection likelihood greater than six. Merloni et al. (2024) also published a supplementary catalog with sources with a detection likelihood between five and six; however, since the level of contamination with spurious sources in this catalog is quite high, we refrained from using this catalog for the time being. A detailed explanation of the eROSITA source detection procedures and the definition of the likelihood parameter have been provided by Brunner et al. (2022).
3.2. Gaia data: Red giants and supergiants in the Milky Way
Before discussing the eROSITA X-ray detected red supergiants, we examine the occurrence of such stars in the Gaia catalog in general. Red giants and supergiants are intrinsically very bright and can therefore be seen out to rather large distances. However, as is well known, the space density of those stars is quite low. Using the new Gaia DR3 data, we can actually construct a complete sample of such objects in the Milky Way. If one considers only catalog entries with measured parallaxes and with absolute magnitudes brighter than ten (which corresponds to an early M-type star on the main sequence) and an apparent magnitude brighter than 17.5 (otherwise an eROSITA detection as a stellar X-ray source would be implausible), one finds many millions of such entries. However, if one restricts attention to red giants and supergiants, which are brighter Gabs = 0 and redder than the color BP-RP = 2, the corresponding catalog numbers become reduced very dramatically. To demonstrate this, we plotted a color-magnitude diagram (CMD) of such sources located in our X-ray search region at galactic latitudes larger than |b| = 20° and galactic longitudes l > 180° in Fig. 1. Specifically focusing on the CMD region in the BP-RP range 2.5 < BP-RP < 7.5 and the Gabs − 7 < Gabs < 2, we found only 7234 Gaia entries in this CMD region, out of which only 1735 are located closer than 1300 pc. Naturally, these stars are concentrated toward the galactic plane, yet it is also clear that in the optical, such red giants and supergiants are rather rare objects. We constructed a complete sample of such objects in our study region in this fashion.
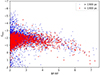 |
Fig. 1. Color-magnitude diagram of high latitude red giant and supergiant stars. The red symbols mark giants nearer than 1300 pc. |
4. Results
4.1. Color-magnitude diagram of stellar X-ray sources
In Fig. 2, we have plotted a color-magnitude diagram of high latitude (|b|> 20°) and high probability (pstellar > 0.5; more details are provided in Sect. 4.2) of stellar eRASS1 detections. As is obvious from Fig. 2 and well known from many previous studies, stellar X-ray sources are found all along the main sequence and in the regions where subgiants and giants are found. For orientation, we estimated the BP-RP color and absolute G magnitude of Arcturus (BP-RP ≈ 1.55 and G ≈ −0.7), Arcturus itself is not contained in Gaia DR3 because of its brightness.
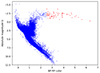 |
Fig. 2. Color-magnitude diagram of X-ray detected high latitude stars. The red symbols mark giants with BP-RP greater than 2.5. Arcturus is expected to be located at BP-RP ≈ 1.55 and G ≈ −0.7. |
An inspection of Fig. 2 revealed that there is a substantial number of stars that are more luminous and redder than Arcturus itself. Surprisingly, given the X-ray faintness of the warmer, lower luminosity Arcturus, one encounters several significant X-ray sources among the very red giants and supergiants (here defined as sources with counterparts redder than BP-BP = 2.5 and in the absolute magnitude range −4 < Gabs < 0; they are marked with red symbols in Fig. 1). The overall number of these sources is rather small, and a list of them is provided in Table A.1, where the relevant Gaia information as well as a flag indicating whether the X-ray counterpart is due to optical contamination or a real X-ray source is included (cf., discussion in Sect. 4.3.1). It is very clear that genuine X-ray emission among those stars is quite unexpected and ought to be – in all likelihood – non-coronal.
4.2. Identification of X-ray emitting red giants and supergiants
In this section, we discuss in detail the reliability of the identifications of the stellar X-ray sources shown in Fig. 2. The eRASS1 catalog contains about 930 000 point-like X-ray sources with galactic longitudes in excess of 180°. To identify those X-ray sources that have red giants and supergiants as counterparts, we followed two different procedures. We first followed the approach described by Schneider et al. (2022), whose aim was to identify all coronal X-ray emitters in the eFEDS data. For a detailed description of the mathematical basis of these identification procedures, we refer to Czesla et al. (2023). We used the so-called HamStar catalog of coronal X-ray sources published by Freund et al. (2024). In this approach each of eROSITA’s cataloged X-ray sources is associated with some probability, pstellar, that the counterpart of the X-ray source in question is a star. Given our knowledge of the properties of stellar X-ray emission, it was clear that the sought-after counterparts must be listed as Gaia DR3 entries, and the probability pstellar was computed using various pieces of information, such as the offset between X-ray and optical position, the physical distance of the star, and the ratio between X-ray and bolometric flux of the counterpart; for details, we refer to Schneider et al. (2022) and to Freund et al. (2024).
In this approach, nearly all of the Gaia entries, which qualify as a potential stellar X-ray counterpart, are considered, so one needs a training set to “teach” the algorithm about the properties of true coronal X-ray sources. Unfortunately, the training sets for red giants and supergiants are by necessity rather small, given the rarity of such objects both at optical and X-ray wavelengths. Therefore, the identification results may be less reliable than for source classes for which much larger training sets are available.
However, since we had constructed a complete sample of red giants and supergiants in the sky region of interest, as described in Sect. 3.2, we actually did not have to consider all the Gaia stars as possible counterparts. Instead, we could use the “classical” identification approach and simply look for straightforward positional coincidences only at the a priori selected positions of these pre-selected objects, that is, at the positions of the 7234 red giants and supergiants determined in Sect. 3.2. By then matching this target sample with the eRASS1 source catalog, we were able to construct the nearest neighbor distribution between the two samples. While clearly the nearest (optical) neighbor to an X-ray source need not necessarily be the correct identification, this usually applies for brighter stars. For a rigorous mathematical treatment of the position matching problem (also in source confusion situations), we again refer to Czesla et al. (2023).
Random matches may occur under all circumstances. For a uniform density distribution of such random “background” sources, ηb, the distance between the nearest such “background” source and some specified position is given by the nearest neighbor distribution. Hence, the (cumulative) probability Pcum(ρ) of finding one or more random sources within the distance ρ is given by the expression Pcum(ρ) = 1 − e−πηbρ2. To obtain the number of true matches, Ntrue, among the considered positions, Ntot, we fit the observed cumulative distribution, Ncum, obs, to the expression Ntrue + (Ntot − Ntrue) × Pcum(ρ) to compute the true number Ntrue of non-random matches. The result of this exercise is shown in Fig. 3, and from the offset, we estimated Ntrue ≈ 80 ± 5 as the estimated number of true (rather than random) matches.
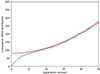 |
Fig. 3. Observed cumulative nearest neighbor distribution of red supergiants (blue dotted curve) together with a model fit (red curve) of the form A + B e−Cρ2. (See the text for details). |
In Fig. 4, we examine in detail the measured differential nearest neighbor distribution versus the expected model distribution. For offset distances below 6 arcsec, a clear excess can be observed, and an excess may extend up to 10 arcsec before it merges with the random background sources. To be on the safe side and capture all possible counterparts, we first considered all matches with offsets below 12.5 arcsec between X-ray and optical positions as potential counterparts, and we list these 96 objects in Table A.1.
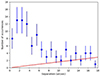 |
Fig. 4. Differential nearest neighbor distribution of red giants and supergiants (blue dots) as a function of position offset and modeled contribution of spurious identifications (red solid curve). (See text for details). |
4.3. Optical contamination
4.3.1. The overall picture
The eROSITA data are known to be subject to optical contamination. Since M giants can be very bright optically, it was necessary for us to examine the influence of optical contamination on our results. For example, the two very bright red supergiants of type M, namely α Ori (V = 0.42) and α Sco (V = 0.91), are actually not listed in the Gaia catalog because of their immense optical brightness, yet a visual inspection showed these two stars to be contained in the eROSITA catalogs, although no X-ray emission from these stars has been detected in the ROSAT all-sky survey. In more general terms, we can plot (shown in Fig. 5) the measured (logarithmic) eROSITA count rate versus the optical G magnitude of the counter parts for objects with counterparts brighter than about g ≈ 13. Figure 5 shows that the bright end of the distribution is more or less linear, where the parameters of the regression curve depend somewhat on the stellar color. The regression plotted in Fig. 5 was derived from our sample stars with apparent g magnitudes brighter than 5.75 and was given by the expression
 (1)
(1)
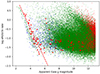 |
Fig. 5. eROSITA count rate versus apparent Gaia G magnitude for stellar X-ray sources. The blue data points refer to stars with BP-RP < 0.25, green data points to stars with 0.25 < BP-RP < 2., and (small) red data points to stars with BP-RP > 2. The large red dots refer to stars considered in this paper. |
where CrX-ray denotes the eROSITA X-ray count rate caused by optical contamination and g is the apparent Gaia g magnitude.
The linearity between the optical and X-ray flux for the brighter Gaia stars suggests optical contamination and not true X-ray flux to be the cause for the eROSITA detections in the vicinity of the dashed line in Fig. 3. These sources are therefore marked with a “Y” in Table A.1. There are also quite a few sources located far away from the optical contamination line in Fig. 5, and these sources are clearly true X-ray sources marked with an “N” in Table A.1. We focus on these sources in the following section.
4.3.2. The Mira stars R Hor, R LMi, U Men, and TW Cen
In our sample there are some Mira-type variable stars that can change their optical flux by a couple of magnitudes, and therefore, the magnitude listed in the Gaia catalog must not necessarily represent the actual magnitude at the time of the eRASS1 observations. One such case is the Mira-like variable R Hor. Using the data from the AAVSO database, we constructed the optical light curve of R Hor (shown in Fig. 6) and estimated its brightness during the time of the eRASS1 observations. As is obvious from Fig. 6, the eRASS1 observations took place during the maximal brightness of R Hor at a level of about 6 mag, yet this magnitude corresponds to the visual band. Using Table 5.7 in the Gaia EDR3 user guide and the very red BP-RP color of 5.6, we computed an estimated G − V color of −4.2, which led to an apparent Gaia magnitude of g = 1.8. From our regression equation (1), the observed eROSITA count rate of 1.14 s−1 results in a g magnitude of about 3.4 if related solely to optical contamination. While these two estimates do not agree (we note that the color is likely to change during a pulsation cycle), it is clear that the apparent g magnitude of R Hor was quite large, and thus we conclude that the X-ray detection of R Hor during eRASS1 is clearly due to optical contamination.
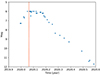 |
Fig. 6. Optical light curve of R Hor derived from the AAVSO database (blue data points) together with scanning time in eRASS1 (red dotted vertical lines). |
A similar case is R LMi, which is also a Mira-like variable, and its light curve is shown in Fig. 7. The light curve shows that the eRASS1 observations took place about a month prior to the optical maximum of R LMi and that its magnitude was at that time was around (visual) mag 8. Thus, the (visual) magnitude difference between R Hor and R LMi at the times of their respective eRASS1 observations was about two, with substantial error given the noise in the light curve data (cf., Figs. 6 and 7), corresponding to a flux ratio of 0.16 if both detections are assumed to be due to optical contamination. Based on Table 2, we computed an observed ratio of 0.07 (i.e., a factor of two within “expectations”). Thus, we conclude that the X-ray detection of R LMi is again very likely due to optical contamination.
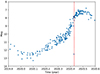 |
Fig. 7. Optical light curve of R LMi (blue data points) together with scanning time in eRASS1 (red dotted vertical lines). The optical light curve was derived from visual V band observations listed in the AAVSO database. |
Physical and X-ray properties of very red giant stars identified with X-ray sources.
For the star U Men, there are unfortunately no optical data available in the AAVSO database contemporaneous to the eRASS1 observations. However, from the light curve resulting from previous observations and considering the well-known 407 d period of U Men, we estimated that the eRASS1 observations fell into a phase close to maximum brightness of U Men, which is typically V ≈ 8. Hence, as in the case of R LMi, and to be on the safe side, we also consider U Men to be optically contaminated. There are previous X-ray observations of U Men discussed in the appendix; in our view the current situation is unclear, and a deeper X-ray pointing avoiding all optical contamination issues would be desirable. However, the situation is different for TW Cen, where two data points available in January 2020 suggest a visual magnitude not brighter than 12 at the time of the eRASS1 observations. We therefore assumed TW Cen not to be optically contaminated.
4.4. Sample selection
In order to obtain a reasonably clean sample, we needed to restrict the number of stars listed in Table A.1. While, clearly, some X-ray emission might be hidden for the stars marked with the optical contamination flag in Table A.1, we cannot distinguish between X-ray and optical signals. Therefore, we excluded those stars from further consideration. Next, inspection of the distance distribution showed a minimum near 1300 pc, and we therefore imposed an arbitrary cut at this distance. We point out, however, that there are quite a few true X-ray emitting red giants and supergiants beyond this distance limit, and usually there is only little additional information on these sources. Finally, we rejected all stars with matching distances larger than 7 arcsec or a stellar probability less than 0.5. In this fashion we arrived at a “clean” sample of 23 stars from which we excluded the sources R Hor, R LMi, and U Men since we attribute the detections of these Mira-like stars to optical contamination, as discussed in detail in Sect. 4.3.2. This clean sample (as well as the data for the three Mira stars with optical contamination) is listed in Table 2, where we again provide the following information: the Gaia DR 3 numbers of the sample stars, an additional name (whenever available), the spectral type, and the relevant X-ray information. We specifically point out that the detection likelihoods of these sources are quite large, and only a smaller number of sources have a detection likelihood below ten, where one might start quibbling about the reality of these sources.
5. Discussion and conclusions
In this paper, we have presented a systematic study of X-ray emitting red giants and supergiants in our Galaxy using the new X-ray data from the first of eROSITA’s all-sky surveys. Using the photometric and astrometric data from Gaia, we constructed a complete sample of X-ray emitting red giants and supergiants located in the western Galactic hemisphere in which we can search for intrinsic X-ray emission.
This pilot study on the X-ray emission of M-type giants and supergiants using data from the first of eROSITA’s all-sky surveys has revealed a number of true and genuine X-ray emitters. By restricting attention to high galactic latitudes, we significantly reduced the problem of erroneous positional misidentifications. A latent problem with all eROSITA data is optical contamination, which may affect the brighter M-giant population. Furthermore, Mira-like variables may change their optical brightness substantially. Hence, it is important to check their optical brightness at the time of the X-ray observations. In this fashion, we attribute the ostensible X-ray detections of R Hor, U Men, and R LMi to optical contamination.
The X-ray luminosities of the securely detected M giants are concentrated in a comparatively narrow range between 1030 erg s−1 and 1031 erg s−1. Since the optically brighter objects of this kind are typically optically contaminated, many of the counterparts we identified are unfortunately little studied so far. As described already in Sect. 1, one does not expect M-type giants to be intrinsic X-ray emitters. Since the number of spurious identifications is low, one cannot attribute the identified counterparts simply to spurious coincidences. Rather, one expects hitherto unseen companions to be the origin of the observed X-ray emission, yet the number of known binaries in this sample is rather low.
The XDL is located in the HRD close to the region where giants develop strong winds (Reimers 1977), which may channel part of the energy away from the corona and toward these winds. Furthermore, the large-scale height of giants to the right of the XDL permits static cool loops (T ∼ 105 K, see Antiochos et al. 1986), and this may be observed for Arcturus (i.e., large but cool loops). Finally, because the X-ray luminosity scales with plasma temperature T as T3.5 (see summary in Güdel 2004), the total X-ray luminosity of Arcturus is as low as observed with LX/Lbol ∼ 10−11 without needing to resort to absorption effects.
These results clearly show that the example of Arcturus cannot be prototypical for the X-ray emission from the red supergiants detected by eROSITA. This caused us to consider other interpretations of the observed X-ray emission of these red supergiants. Given the X-ray luminosities found for these objects, active late-type stars would indeed constitute potential candidates. However, if this is true, these secondaries would have to be fairly young, and consequently, the M-type primaries in these systems would also have to be young and hence relatively massive. Yet an inspection of, for example, PARSEC isochrones (cf., Fig. 17 in Nguyen et al. 2022) showed that such primaries would have G magnitudes larger than those observed for our sample stars (as shown in Fig. 2), which would suggest that neither the hypothesized primaries nor the secondaries are particularly young. Furthermore, for a star similar to the Sun, the X-ray luminosity range observed in our M super giant sample would correspond to LX/Lbol values between −3.6 to −2.6, which (at least at the high end) are not observed when one looks at active late-type stars in young open clusters (cf. Jackson et al. 2012). We therefore ruled out active stars as possible companions and thus looked for counterparts among older stars.
In this context, we recall the star 56 Peg (=HR 8796 = HD 218356), a rather bright mild barium star of spectral type K0.5II. The star 56 Peg was first detected as an X-ray source by Schindler et al. (1982) using the Einstein Observatory, and this detection was confirmed by Hünsch et al. (1998b) using data from the ROSAT all-sky survey. Notably, 56 Peg also appears in the XMM-Newton slew survey catalog (Saxton et al. 2008), and hence there can be no doubt that 56 Peg is a persistent X-ray source. Schindler et al. (1982) reported an X-ray luminosity of 3 × 1031 erg s−1, which is reduced by 30% if one adopts the Gaia distance of 181 pc rather than the distance adopted by Schindler et al. (1982) at the time. Thus the X-ray luminosity of 56 Peg is quite consistent with the X-ray luminosities of our sample stars.
While 56 Peg is much “bluer” than the giants studied in this paper (it is of spectral type K0.5 II), the arguments put forward by Schindler et al. (1982) can be applied in very much the same fashion. In the case of 56 Peg, Schindler et al. (1982) argued that the observed X-ray emission cannot be coronal. Rather, they concluded that the observed X-ray emission stems from a companion white dwarf, which at the time was only known from UV spectroscopy. In the meantime, extensive radial velocity work has been carried out that shows 56 Peg to be indeed a spectroscopic binary, if not a triple system. Griffin (2006) has reported a period of 111 days for 56 Peg, and Escorza & De Rosa (2023) even reported a spectroscopic triple with periods of 111 days and about 15 000 days, with the latter period belonging to the more massive companion. Therefore, the white dwarf postulated on the basis of UV spectroscopy and X-ray emission seems to have been found through extensive long-term radial velocity work.
While we do not have UV spectroscopy for our sample stars, we examined the results of the all-sky imaging survey performed by the GALEX satellite (Bianchi et al. 2017) in an NUV band with λeff ∼ 2310 Å and in an FUV band with λeff ∼ 1528 Å. Using the FUV and NUV magnitudes from the GALEX catalog by Bianchi et al. (2017), we computed the FUV-NUV colors and provide (in Fig. 8) an FUV-NUV color histogram for those of our (complete) sample stars located closer than 1300 pc and with valid FUV and NUV measurements. While it is difficult to interpret the observed color distribution because of extinction effects, it is clear that the observed distribution is concentrated in the color range 2–3.5 with some “tail” of the observed color distribution below values of unity. In Fig. 8, we also indicated the observed GALEX FUV-NUV colors (whenever available) for the X-ray detected supergiants (see also Table 2). As is apparent from Fig. 8, most of these values are located in the bulk of the distribution, with two exceptions, namely the stars DR Eri and HD 84048, which are much “bluer” than the bulk of the observed population. We note in this context that the observed FUV-NUV color of 56 Peg is 1.12, that is, also in the “blue” tail of the FUV-NUV color distribution despite the fact that the primary is of spectral type K0II (i.e., much earlier than our sample stars of spectral type M). Thus, the stars DR Eri and HD 84048 are obviously the prime candidates for the presence of “hidden” WD companions, while for the other sample stars, there is no evidence for hot companions, at least from the available GALEX UV data.
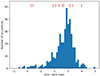 |
Fig. 8. Distribution of FUV-NUV colors derived by GALEX for a sample of nearby (d < 1300 pc) M supergiants. The red marks at the top indicate the GALEX FUV-NUV colors (whenever available) for our sample of X-ray detected supergiants (see text for details). |
Schindler et al. (1982) proposed wind accretion of a small fraction of the emanating wind onto the surface of a white dwarf as the energy source for 56 Peg and argued that by assuming reasonable mass-loss fand accretion rates, this mechanism can explain the observed X-ray emission. Given that the giants investigated in this paper also have strong winds, the same mechanism should be operating if indeed the X-ray sources reported in this paper all have white dwarf companions. Similar conclusions have been arrived at by Sahai et al. (2015) in their pilot study of a search for X-ray emission from AGB stars with far-UV excesses. These authors argued that the “most likely scenario for the origin of the X-ray (and FUV) emission involves accretion activity around a companion star.”
Finding these hypothesized companions is challenging and requires more sensitive UV data and/or extensive radial velocity monitoring, which nonetheless could be carried out with modest-sized telescopes. If our hypothesis is correct, these stars would show some resemblance to the class of barium stars, which were shown most recently by Jorissen et al. (2019) to all be binaries. Another possibility would be to search for chemical peculiarities in the present-day primaries other than barium. For example, as described in detail by Merle et al. (2016), the hypothesized present-day white dwarf must have been located at some point in the past on the asymptotic giant branch producing s-process elements, which might still be visible as pollutants in the spectra of the secondary and later present-day primary.
In summary, the puzzle of X-ray emitting “forbidden” M-type supergiants is not yet solved. However, with the stellar X-ray sources presented in this paper, a sufficiently large sample has become available that has the potential to actually solve this puzzle.
Compared to the pn-detector, the two MOS-detectors have a small effective area in our configuration. They show a weak nominal source photon excess in the same energy bands as the pn-detector but with very low count numbers (i.e., they contribute no significant additional information).
Often, the corona is defined as the region with plasma temperatures in excess of 1 MK.
Acknowledgments
This work is based on data from eROSITA, the primary instrument aboard SRG, a joint Russian-German science mission supported by the Russian Space Agency (Roskosmos), in the interests of the Russian Academy of Sciences represented by its Space Research Institute (IKI), and the Deutsches Zentrum für Luft- und Raumfahrt (DLR). The SRG spacecraft was built by Lavochkin Association (NPOL) and its subcontractors, and is operated by NPOL with support from IKI and the Max Planck Institute for Extraterrestrial Physics (MPE). The development and construction of the eROSITA X-ray instrument was led by MPE, with contributions from the Dr. Karl Remeis Observatory Bamberg & ECAP (FAU Erlangen-Nürnberg), the University of Hamburg Observatory, the Leibniz Institute for Astrophysics Potsdam (AIP), and the Institute for Astronomy and Astrophysics of the University of Tübingen, with the support of DLR and the Max Planck Society. The Argelander Institute for Astronomy of the University of Bonn and the Ludwig Maximilians Universität München also participated in the science preparation for eROSITA. The eROSITA data used for this paper were processed using the eSASS/NRTA software system developed by the German eROSITA consortium. This work has made use of data from the European Space Agency (ESA) mission Gaia (https://www.cosmos.esa.int/gaia), processed by the Gaia Data Processing and Analysis Consortium (DPAC, https://www.cosmos.esa.int/web/gaia/dpac/consortium). Funding for the DPAC has been provided by national institutions, in particular the institutions participating in the Gaia Multilateral Agreement. We gratefully acknowledge the variable star observations from the AAVSO International Database contributed by observers worldwide and used in this research. Furthermore, this research has also made use of the SIMBAD database, operated at CDS, Strasbourg, France. Finally we wish to acknowledge the contributions of our anonymous referee whose thoughtful remarks and suggestions helped to improve our paper significantly.
References
- Antiochos, S. K., Haisch, B. M., & Stern, R. A. 1986, ApJ, 307, L55 [NASA ADS] [CrossRef] [Google Scholar]
- Ayres, T. R. 2005, ApJ, 618, 493 [NASA ADS] [CrossRef] [Google Scholar]
- Ayres, T. R. 2018, AJ, 156, 163 [NASA ADS] [CrossRef] [Google Scholar]
- Ayres, T. R., Linsky, J. L., Vaiana, G. S., Golub, L., & Rosner, R. 1981, ApJ, 250, 293 [NASA ADS] [CrossRef] [Google Scholar]
- Ayres, T. R., Brown, A., & Harper, G. M. 2003, ApJ, 598, 610 [NASA ADS] [CrossRef] [Google Scholar]
- Ayres, T. R., Brown, A., & Harper, G. M. 2006, ApJ, 651, 1126 [NASA ADS] [CrossRef] [Google Scholar]
- Bianchi, L., Shiao, B., & Thilker, D. 2017, ApJS, 230, 24 [Google Scholar]
- Boller, T., Freyberg, M. J., Trümper, J., et al. 2016, A&A, 588, A103 [NASA ADS] [CrossRef] [EDP Sciences] [Google Scholar]
- Bopp, B. W., & Stencel, R. E. 1981, ApJ, 247, L131 [NASA ADS] [CrossRef] [Google Scholar]
- Brunner, H., Liu, T., Lamer, G., et al. 2022, A&A, 661, A1 [NASA ADS] [CrossRef] [EDP Sciences] [Google Scholar]
- Czesla, S., Schneider, P. C., Schmitt, J. H. M. M., et al. 2023, A&A, 674, A136 [NASA ADS] [CrossRef] [EDP Sciences] [Google Scholar]
- Escorza, A., & De Rosa, R. J. 2023, A&A, 671, A97 [NASA ADS] [CrossRef] [EDP Sciences] [Google Scholar]
- Freund, S., Czesla, S., Robrade, J., Schneider, P. C., & Schmitt, J. H. M. M. 2022, A&A, 664, A105 [NASA ADS] [CrossRef] [EDP Sciences] [Google Scholar]
- Freund, S., Czesla, S., Predehl, P., et al. 2024, A&A, 684, A121 [NASA ADS] [CrossRef] [EDP Sciences] [Google Scholar]
- Gaia Collaboration (Prusti, T., et al.) 2016, A&A, 595, A1 [NASA ADS] [CrossRef] [EDP Sciences] [Google Scholar]
- Griffin, R. F. 2006, The Observatory, 126, 1 [NASA ADS] [Google Scholar]
- Güdel, M. 2004, A&A Rev., 12, 71 [Google Scholar]
- Haisch, B., Schmitt, J. H. M. M., & Rosso, C. 1991, ApJ, 383, L15 [NASA ADS] [CrossRef] [Google Scholar]
- Haisch, B., Schmitt, J. H. M. M., & Fabian, A. C. 1992, Nature, 360, 239 [NASA ADS] [CrossRef] [Google Scholar]
- Hünsch, M., & Schröder, K. P. 1996, A&A, 309, L51 [Google Scholar]
- Hünsch, M., Reimers, D., & Schmitt, J. H. M. M. 1996, A&A, 313, 755 [NASA ADS] [Google Scholar]
- Hünsch, M., Schmitt, J. H. M. M., Schröder, K.-P., & Zickgraf, F.-J. 1998a, A&A, 330, 225 [NASA ADS] [Google Scholar]
- Hünsch, M., Schmitt, J. H. M. M., & Voges, W. 1998b, A&AS, 127, 251 [NASA ADS] [CrossRef] [EDP Sciences] [Google Scholar]
- Jackson, A. P., Davis, T. A., & Wheatley, P. J. 2012, MNRAS, 422, 2024 [Google Scholar]
- Jorissen, A., Boffin, H. M. J., Karinkuzhi, D., et al. 2019, A&A, 626, A127 [NASA ADS] [CrossRef] [EDP Sciences] [Google Scholar]
- Linsky, J. L., & Haisch, B. M. 1979, ApJ, 229, L27 [Google Scholar]
- Merle, T., Jorissen, A., Van Eck, S., Masseron, T., & Van Winckel, H. 2016, A&A, 586, A151 [NASA ADS] [CrossRef] [EDP Sciences] [Google Scholar]
- Merloni, A., Lamer, G., Liu, T., et al. 2024, A&A, 682, A34 [NASA ADS] [CrossRef] [EDP Sciences] [Google Scholar]
- Munari, U. 2019, ArXiv e-prints [arXiv:1909.01389] [Google Scholar]
- Nguyen, C. T., Costa, G., Girardi, L., et al. 2022, A&A, 665, A126 [NASA ADS] [CrossRef] [EDP Sciences] [Google Scholar]
- Ortiz, R., & Guerrero, M. A. 2021, ApJ, 912, 93 [Google Scholar]
- Predehl, P., Andritschke, R., Arefiev, V., et al. 2021, A&A, 647, A1 [EDP Sciences] [Google Scholar]
- Reimers, D. 1977, A&A, 57, 395 [NASA ADS] [Google Scholar]
- Reimers, D., & Schmitt, J. H. M. M. 1992, ApJ, 392, L55 [NASA ADS] [CrossRef] [Google Scholar]
- Reimers, D., Hünsch, M., Schmitt, J. H. M. M., & Toussaint, F. 1996, A&A, 310, 813 [NASA ADS] [Google Scholar]
- Rosner, R., An, C. H., Musielak, Z. E., Moore, R. L., & Suess, S. T. 1991, ApJ, 372, L91 [NASA ADS] [CrossRef] [Google Scholar]
- Sahai, R., Sanz-Forcada, J., Sánchez Contreras, C., & Stute, M. 2015, ApJ, 810, 77 [NASA ADS] [CrossRef] [Google Scholar]
- Saxton, R. D., Read, A. M., Esquej, P., et al. 2008, A&A, 480, 611 [NASA ADS] [CrossRef] [EDP Sciences] [Google Scholar]
- Schindler, M., Stencel, R. E., Linsky, J. L., Basri, G. S., & Helfand, D. J. 1982, ApJ, 263, 269 [NASA ADS] [CrossRef] [Google Scholar]
- Schmitt, J. H. M. M. 1997, A&A, 318, 215 [NASA ADS] [Google Scholar]
- Schneider, P. C., Freund, S., Czesla, S., et al. 2022, A&A, 661, A6 [NASA ADS] [CrossRef] [EDP Sciences] [Google Scholar]
- Schröder, K. P., Hünsch, M., & Schmitt, J. H. M. M. 1998, A&A, 335, 591 [Google Scholar]
- Stocke, J. T., Morris, S. L., Gioia, I. M., et al. 1991, ApJS, 76, 813 [Google Scholar]
- Freund, S. 2024, A&A, 684, A121 Czesla, S., Predehl, P., et al. [NASA ADS] [CrossRef] [EDP Sciences] [Google Scholar]
Appendix A: eROSITA detected M-type giants
In Tab. A.1 we provide a list 96 eROSITA X-ray sources in the vicinity of bright M-type giants. The columns in Tab. A.1 show the Gaia DR3 numbers, right ascension, declination, Gaia G band magnitude, and BP-RP color (columns 1-5); the Gaia distance computed from the inverse parallax (column 6); the matching distance between the Gaia position and the eRASS1 X-ray position (column 7); the stellar probability (column 8); a flag indicating optical contamination (column 9; see section 4.3.1 for a detailed discussion); and an asterisk (in column 10) denoting the “good” candidates. In column 8 of Tab. A.1, the stellar probability was computed from our “general” identification scheme. Inspection of Tab. A.1 showed that these probabilities become small for large offsets (as naturally expected), and furthermore, the majority of our accepted candidates (marked with asterisks in Tab. A.1) have stellar probabilities larger than 0.5, with three exceptions.
eRASS1 X-ray sources identified with very red giant stars. Column 1 provides the Gaia DR3 identification number; columns 2 and 3 right show the ascension and declination of the optical counter part; columns 4 and 5 give the Gaia apparent magnitude and BP-RP color; column 6 lists the distance in parsecs) as computed from the Gaia parallax; column 7 gives the matching distance between the eROSITA and Gaia positions (in arcseconds); column 8 gives the probability that the source is coronal; column 9 provides a flag indicating whether we consider the X-ray source to be caused by optical contamination (Y) or to be genuine (N); and the asterisk in column 10 indicates whether the object is considered a “good” candidate (see text for details).
Appendix B: Notes on individually detected SRG sources
In this section, we present some notes on individual objects.
CI Hyi: The only object in our sample with previously reported X-ray emission. Sahai et al. (2015) discussed the X-ray emission of CI Hyi in their pilot study of AGB stars with far-UV excesses (i.e., so-called fuvAGB stars) using data from the XMM-Newton and Chandra observatories, and they found that the X-ray emission is variable on a timescale of hours. CI Hyi is a long-period variable of the SRB type.
DR Eri: An LPV candidate of type LB with a period of 51.3 d.
BH Eri: LPV, type SR; period 89.9 d
UU Ret: LPV, type SRB
U Men: An OH/IR star, type M, period 409 d. This is a binary (Baize 1962, Proust et al. 1981).
Boller et al. (2016) reported the RASS source 2RXS J040931.2-815036 located 42 arcsec away from U Men with a count rate of 0.039 ± 0.014 cts/s. U Men is also listed by Saxton et al. (2008) in the XMM-Newton slew survey catalog as the source XMMSL2 J040936.7-815116 observed on May 6, 2011, with a count rate of 0.55 ± 0.17 cts/s.
MV Hya: LPV, type SRB.
EH Leo: LPV, type SRB, period 39.34 d.
WW Crt: LPV, type SR.
An X-ray source near WW Crt reported by Boller et al. (2016) as the RASS source 2RXS J114610.6-245223 with a count rate of 0.077 ± 0.015 cts/s and with a position offset of 10 arcsec.
TW Cen: Mira star, period 271 d.
All Tables
Physical and X-ray properties of very red giant stars identified with X-ray sources.
eRASS1 X-ray sources identified with very red giant stars. Column 1 provides the Gaia DR3 identification number; columns 2 and 3 right show the ascension and declination of the optical counter part; columns 4 and 5 give the Gaia apparent magnitude and BP-RP color; column 6 lists the distance in parsecs) as computed from the Gaia parallax; column 7 gives the matching distance between the eROSITA and Gaia positions (in arcseconds); column 8 gives the probability that the source is coronal; column 9 provides a flag indicating whether we consider the X-ray source to be caused by optical contamination (Y) or to be genuine (N); and the asterisk in column 10 indicates whether the object is considered a “good” candidate (see text for details).
All Figures
|
Fig. 1. Color-magnitude diagram of high latitude red giant and supergiant stars. The red symbols mark giants nearer than 1300 pc. |
| In the text | |
|
Fig. 2. Color-magnitude diagram of X-ray detected high latitude stars. The red symbols mark giants with BP-RP greater than 2.5. Arcturus is expected to be located at BP-RP ≈ 1.55 and G ≈ −0.7. |
| In the text | |
|
Fig. 3. Observed cumulative nearest neighbor distribution of red supergiants (blue dotted curve) together with a model fit (red curve) of the form A + B e−Cρ2. (See the text for details). |
| In the text | |
|
Fig. 4. Differential nearest neighbor distribution of red giants and supergiants (blue dots) as a function of position offset and modeled contribution of spurious identifications (red solid curve). (See text for details). |
| In the text | |
|
Fig. 5. eROSITA count rate versus apparent Gaia G magnitude for stellar X-ray sources. The blue data points refer to stars with BP-RP < 0.25, green data points to stars with 0.25 < BP-RP < 2., and (small) red data points to stars with BP-RP > 2. The large red dots refer to stars considered in this paper. |
| In the text | |
|
Fig. 6. Optical light curve of R Hor derived from the AAVSO database (blue data points) together with scanning time in eRASS1 (red dotted vertical lines). |
| In the text | |
|
Fig. 7. Optical light curve of R LMi (blue data points) together with scanning time in eRASS1 (red dotted vertical lines). The optical light curve was derived from visual V band observations listed in the AAVSO database. |
| In the text | |
|
Fig. 8. Distribution of FUV-NUV colors derived by GALEX for a sample of nearby (d < 1300 pc) M supergiants. The red marks at the top indicate the GALEX FUV-NUV colors (whenever available) for our sample of X-ray detected supergiants (see text for details). |
| In the text | |
Current usage metrics show cumulative count of Article Views (full-text article views including HTML views, PDF and ePub downloads, according to the available data) and Abstracts Views on Vision4Press platform.
Data correspond to usage on the plateform after 2015. The current usage metrics is available 48-96 hours after online publication and is updated daily on week days.
Initial download of the metrics may take a while.