Open Access
Fig. 8.
Download original image
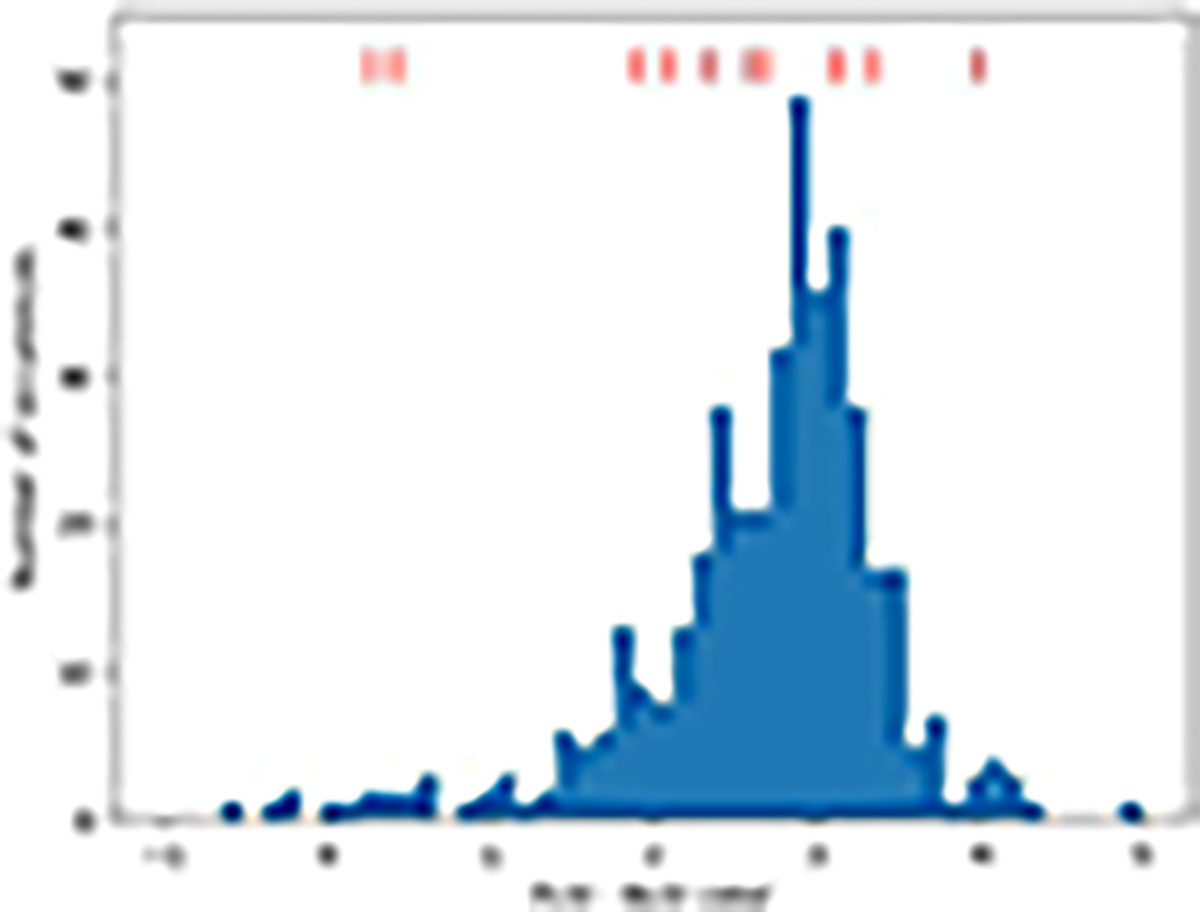
Distribution of FUV-NUV colors derived by GALEX for a sample of nearby (d < 1300 pc) M supergiants. The red marks at the top indicate the GALEX FUV-NUV colors (whenever available) for our sample of X-ray detected supergiants (see text for details).
Current usage metrics show cumulative count of Article Views (full-text article views including HTML views, PDF and ePub downloads, according to the available data) and Abstracts Views on Vision4Press platform.
Data correspond to usage on the plateform after 2015. The current usage metrics is available 48-96 hours after online publication and is updated daily on week days.
Initial download of the metrics may take a while.