| Issue |
A&A
Volume 697, May 2025
|
|
|---|---|---|
| Article Number | A230 | |
| Number of page(s) | 9 | |
| Section | Stellar atmospheres | |
| DOI | https://doi.org/10.1051/0004-6361/202451421 | |
| Published online | 22 May 2025 | |
The stellar corona-chromosphere connection
A comprehensive study of X-ray and Ca II IRT fluxes from eROSITA and Gaia
1
Max-Planck-Institut für extraterrestrische Physik,
Gießenbachstraße 1,
85748
Garching
Germany
2
Hamburger Sternwarte, Universität Hamburg,
Gojenbergsweg 112,
21029
Hamburg,
Germany
3
Thüringer Landessternwarte Tautenburg,
Sternwarte 5,
07778
Tautenburg,
Germany
★ Corresponding author; This email address is being protected from spambots. You need JavaScript enabled to view it.
Received:
8
July
2024
Accepted:
29
March
2025
Abstract
Stellar activity can be observed at different wavelengths in a variety of different activity indicators. We investigated the correlation between coronal and chromospheric emissions by combining X-ray data from stars detected in the eROSITA all-sky surveys (eRASS1 and eRASS:5) with Ca II infrared triplet (IRT) activity indices as published in the third Gaia data release (Gaia DR3). We specifically studied 24 300 and 43 200 stellar sources with reliable Ca II IRT measurement and X-ray detection in eRASS1 and eRASS:5, which is by far the largest stellar sample available so far. The largest detection fraction is obtained for highly active sources and stars of a late spectral type, while F-type and less active stars (as measured in the Ca II IRT) remain mostly undetected in X-rays. Also, the correlation is the strongest for late-type sources, while F-type stars show a rather weak correlation between the X-ray to bolometric flux ratio and the Ca II IRT activity index. The relation between the X-ray and Ca II IRT surface fluxes changes with the fractional X-ray flux without showing two separated branches as described in previous studies. For fast rotators, both activity indicators saturate at a similar Rossby number and the X-ray to bolometric flux ratio decreases faster than the IRT index for slower rotating stars. As a consequence, the ratio between X-ray and IRT fluxes is constant in the saturation regime and decreases for slow rotators.
Key words: stars: activity / stars: chromospheres / stars: coronae / stars: late-type / X-rays: stars
© The Authors 2025
 Open Access article, published by EDP Sciences, under the terms of the Creative Commons Attribution License (https://creativecommons.org/licenses/by/4.0), which permits unrestricted use, distribution, and reproduction in any medium, provided the original work is properly cited.
This article is published in open access under the Subscribe to Open model.
Open Access funding provided by Max Planck Society.
1 Introduction
Magnetic activity of late-type stars reveals itself in different phenomena that originate from different layers of the stellar atmosphere and can be observed at different wavelengths. In the optical, the chromospheric Ca II H&K lines have been studied extensively (Wilson 1978; Linsky et al. 1979; Baliunas et al. 1995; Hall et al. 2009; Hempelmann et al. 2016) and also the Hα line (He et al. 2019) and the Ca II infrared triplet (IRT) lines are well known activity indicators. X-rays emitted from the magnetically heated coronae provide another opportunity to study stellar activity. Martin et al. (2017) compared Ca II IRT with Ca II H&K for more than 2 000 spectra of almost 100 stars obtained by the TIGRE telescope. Also, the correlation between the activity indicators derived from the Ca II H&K lines and X-rays have been intensively investigated (Schrijver 1983; Mittag et al. 2018; Fuhrmeister et al. 2022) but comparisons between the Ca II IRT and X-rays are far less numerous. Martínez-Arnáiz et al. (2011) analyzed flux-flux relationships including basal corrected Ca II IRT emission for a sample of 298 F- to M-type dwarfs with 243 of them being detected in X-rays in the ROSAT all-sky survey (RASS). In addition, Stelzer et al. (2013) present a sample of 24 non-accreting pre-main sequence stars for which Ca II IRT and other chromospheric fluxes are estimated from X-shooter/VLT spectra; X-ray fluxes are available for 19 of these sources.
Ca II IRT activity measurements for a large number of stars have now become available from the Gaia mission (Gaia Collaboration 2016) launched in 2013. In addition to the highly accurate positions, parallaxes, and photometry, high resolution spectra are obtained with the Radial Velocity Spectrometer (RVS) for the brightest Gaia sources. With an effective wavelength range of 846–870 nm these spectra do cover the Ca II IRT with a resolution of R ≈ 11 500, and Lanzafame et al. (2023) used these spectra to estimate Ca II IRT based activity indices for about 2 million Gaia DR3 sources.
On the X-ray side, the deepest all-sky survey at soft X-ray wavelengths is performed by the eROSITA X-ray telescope (Predehl et al. 2021) onboard the Spectrum-Roentgen-Gamma mission (SRG; Sunyaev et al. 2021). The X-ray sources detected during the first eROSITA all-sky survey (eRASS1) carried out between December 2019 and June 2020 are presented by Merloni et al. (2024). The main eRASS1 source catalog contains about 900 000 point-like sources detected in the 0.2–2.3 keV band and located in the western Galactic hemisphere, with nearly 140 000 of them expected to be produced by stellar coronal emission (Freund et al. 2024). After eRASS1, the survey was continued until February 2022 when four all-sky surveys were finished and the fifth survey was partially completed revealing an even larger sample of stellar X-ray sources.
As evidenced by the Sun, chromospheric and coronal emissions are not homogeneously produced over the stellar surface, instead the bulk of the emission is concentrated in active regions. The fraction of the stellar surface covered by active regions and producing most of the activity related emission is often described in terms of a filling factor, which might vary between the corona and the chromosphere. Measurements at X-ray and optical wavelengths cannot spatially resolve stellar surfaces, rather the X-ray and IRT luminosities measured by eROSITA and Gaia are integrated over the whole surface and any reported surface fluxes are then surface averaged mean fluxes.
The combination of Gaia and eROSITA data provide a sample of stars with available Ca II IRT and X-ray measurements of unprecedented size and allows us to study in detail the correlation between the two activity indicators. This paper is structured as follows: we describe the data being used in Sect. 2. In Sect. 3, we specify the fraction of sources with Ca II IRT activity index also detected in X-rays. We discuss various aspects of the correlation between the X-ray and Ca II IRT emission in Sect. 4, and finally draw our conclusions in Sect. 5.
2 Data and measurements
2.1 Gaia DR3 and Ca II IRT measurements
The data taken during the first 34 months of the Gaia mission (Gaia Collaboration 2016) are published in the third Gaia data release (Gaia DR3; Gaia Collaboration 2021, 2023). It contains sub-milliarcsecond accuracy positions for 1.8 billion sources brighter than 21st magnitude. Furthermore, photometry in three bands (G, BP, and RP) as well as parallaxes and proper motions are provided for 1.5 billion sources. Gaia DR3 is expected to be highly complete in the range 7 < G < 19 mag with some of the brightest and faintest sources and objects in crowded regions missing from the catalog.
In addition to the photometry, high resolution spectra from the RVS and low resolution spectra from the BP and RP prism photometers covering the wavelength ranges of 330–680 nm and 640–1050 nm with a resolution between 30 and 100 in λ/Δλ are also obtained as part of Gaia DR3. The General Stellar Parametrizer from Photometry (GSP-Phot) estimated stellar parameters, e.g., effective temperature, surface gravity, metallicity, radius, reddening, and extinction, from the BP and RP spectra for about 500 million sources brighter than G = 19 mag. The effective temperature and metallicity were also estimated from the RVS spectroscopy (GSP-Spec) for about 6 million sources brighter than G = 14 mag.
To derive Ca II IRT activity indices, Lanzafame et al. (2023) used theoretical photospheric spectra for a linear interpolation over a grid of MARCS synthetic spectra adopting the stellar parameters from GSP-Spec whenever available, and otherwise from GSP-Phot. For the synthetic spectra, they assumed local thermodynamic and radiative equilibrium and applied rotational broadening. The activity index α was derived from the ratio between the observed and the template spectrum around the cores of each of the triplet lines with the mean of the three values taken as activity index. The so-obtained activity index is close to zero (or even negative) for inactive stars and positive for active stars, however, it is not suitable for a comparison of the activity of stars with different stellar parameters, i.e., effective temperature, surface gravity, and metallicity. Therefore, Lanzafame et al. (2023) defined a ![Mathematical equation: $\[R_{\text {IRT }}^{\prime}\]$](/articles/aa/full_html/2025/05/aa51421-24/aa51421-24-eq1.png) -index and provide a conversion between the activity index α and the
-index and provide a conversion between the activity index α and the ![Mathematical equation: $\[R_{\text {IRT }}^{\prime}\]$](/articles/aa/full_html/2025/05/aa51421-24/aa51421-24-eq2.png) -index as a function of the effective temperature and metallicity. The
-index as a function of the effective temperature and metallicity. The ![Mathematical equation: $\[R_{\text {IRT }}^{\prime}\]$](/articles/aa/full_html/2025/05/aa51421-24/aa51421-24-eq3.png) -index is connected with the surface chromospheric flux ℱIRT and the observed flux FIRT of the IRT lines through the bolometric flux Fbol (compare Equation 6 of Lanzafame et al. 2023)
-index is connected with the surface chromospheric flux ℱIRT and the observed flux FIRT of the IRT lines through the bolometric flux Fbol (compare Equation 6 of Lanzafame et al. 2023)
![Mathematical equation: $\[R_{\mathrm{IRT}}^{\prime}=\frac{\mathcal{F}_{\mathrm{IRT}}}{\sigma T_{\mathrm{eff}}^4}=\frac{\mathcal{F}_{\mathrm{IRT}} A}{\sigma T_{\mathrm{eff}}^4 A}=\frac{L_{\mathrm{IRT}}}{L_{\mathrm{bol}}}=\frac{F_{\mathrm{IRT}}}{F_{\mathrm{bol}}},\]$](/articles/aa/full_html/2025/05/aa51421-24/aa51421-24-eq4.png) (1)
(1)
where Teff is the effective temperature, A the surface of the star, and Lbol and LIRT are the bolometric luminosity and the luminosity of the IRT lines, respectively. We emphasize that ℱIRT, FIRT, Fbol, LIRT, and Lbol are the observed mean fluxes and total luminosities.
2.2 eROSITA observations and stellar identification
Similar to the method described in Merloni et al. (2024) for eRASS1, all data collected during the eROSITA all-sky surveys were combined and the source detection was applied to this merged data set. The resulting source catalog (eRASS:5) in the western Galactic hemisphere of the sky is available to the German eROSITA consortium, and we refer in the following to the catalog version 230619 obtained by eSASS version c020 (Brunner et al. 2022). eRASS:5 has a mean vignetting corrected exposure time of about 950 s. However, the survey exposure time is not constant, varying between the ecliptic equator and poles between about 300 s and several thousand seconds due to the eROSITA scanning law. Applying an energy conversion factor (ECF) of 8.5 × 10⁻¹³ erg cm−2 cnt−1 as appropriate for most coronal sources, a mean sensitivity of about 2.0 × 10⁻¹⁴ erg cm−2 s−1 results in the 0.2 − 2.3 keV band for eRASS:5 (compared to 5.5 × 10⁻¹⁴ erg cm−2 s−1 for eRASS1) with substantially higher sensitivities being reached in the vicinity of the southern ecliptic pole. The positional uncertainty of the eRASS:5 sources is on average about 4.3 arcsec, with the positional accuracy generally increasing for brighter X-ray sources due to better photon statistics.
The identification of the coronal content for the eRASS1 catalog is described by Freund et al. (2024) and we applied the same method for eRASS:5. Specifically, we performed a crossmatch of the eRASS:5 sources with eligible counterparts from Gaia DR3, i.e., sources with flux measurements in all three Gaia bands, an accurate parallax (![Mathematical equation: $\[\frac{\pi}{\sigma_{\pi}}>3\]$](/articles/aa/full_html/2025/05/aa51421-24/aa51421-24-eq5.png) ), and brighter than G = 19 mag. Geometric properties as the angular separation between the X-ray and Gaia position and the eRASS:5 positional uncertainty were considered in combination with additional properties, namely the BP-RP color, X-ray over bolometric flux, and the distances of the counterparts, within a Bayesian framework to identify the correct association. As a result, we obtain 408 000 likely coronal sources out of 2.9 million point-like X-ray sources and expect these identifications to be complete and reliable to about 89% based on the coronal probabilities estimated for every eRASS:5 source (compared to 138 800 coronal eRASS1 identifications with a completeness and reliability of 91.5%).
), and brighter than G = 19 mag. Geometric properties as the angular separation between the X-ray and Gaia position and the eRASS:5 positional uncertainty were considered in combination with additional properties, namely the BP-RP color, X-ray over bolometric flux, and the distances of the counterparts, within a Bayesian framework to identify the correct association. As a result, we obtain 408 000 likely coronal sources out of 2.9 million point-like X-ray sources and expect these identifications to be complete and reliable to about 89% based on the coronal probabilities estimated for every eRASS:5 source (compared to 138 800 coronal eRASS1 identifications with a completeness and reliability of 91.5%).
3 Source selection and statistics of X-ray detections
We considered Gaia Ca II IRT activity indices only for eligible coronal counterparts according to our definition (Sect. 2.2) and sources located in western Galactic sky hemisphere. Furthermore, we excluded sources with negative activity index values and those objects for which the derived activity index does not exceed three times its estimated uncertainty as we consider the activity of these sources to have remained undetected with the Gaia RVS spectra. This leaves us with 556 700 sources with a measured Ca II IRT activity index and 34 300 and 70 600 of them are identified as likely coronal counterparts of an eRASS1 and eRASS:5 source, respectively. A further set of 13 100 sources with a Ca II IRT measurement are located within the formal 5σ of the eRASS:5 positional uncertainty, yet these sources have rather low matching probabilities and are – in their majority – more likely chance alignments. However, our identification procedure does not consider the Ca II IRT activity and the matching probability of some sources with high Ca II IRT activity might increase if this additional information was considered. To obtain the most reliable association, we nonetheless restricted the analysis in this paper to the likely identifications obtained with the method described in Freund et al. (2024).
For the sources with both Ca II IRT activity index and eRASS:5 identification, we applied Equation 7 and Table 1 of Lanzafame et al. (2023) to estimate the value of log(![Mathematical equation: $\[R_{\text {IRT }}^{\prime}\]$](/articles/aa/full_html/2025/05/aa51421-24/aa51421-24-eq8.png) ) by adopting the same stellar parameters used by Lanzafame et al. (2023). For a few sources, this equation cannot be used because the effective temperature and/or the metallicity are not available in Gaia DR3. Thus, we are left with 70 300 sources with a valid log(
) by adopting the same stellar parameters used by Lanzafame et al. (2023). For a few sources, this equation cannot be used because the effective temperature and/or the metallicity are not available in Gaia DR3. Thus, we are left with 70 300 sources with a valid log(![Mathematical equation: $\[R_{\text {IRT }}^{\prime}\]$](/articles/aa/full_html/2025/05/aa51421-24/aa51421-24-eq9.png) )-index and a good eRASS:5 identification.
)-index and a good eRASS:5 identification.
In Fig. 1, we show the distribution of the ![Mathematical equation: $\[R_{\mathrm{IRT}}^{\prime}\]$](/articles/aa/full_html/2025/05/aa51421-24/aa51421-24-eq10.png) -index as a function of the GBP − GRP color1 for our eROSITA X-ray detected sources. Although we excluded sources with activity indices of low significance, the
-index as a function of the GBP − GRP color1 for our eROSITA X-ray detected sources. Although we excluded sources with activity indices of low significance, the ![Mathematical equation: $\[R_{\text {IRT }}^{\prime}\]$](/articles/aa/full_html/2025/05/aa51421-24/aa51421-24-eq11.png) -index still reaches quite low values because the provided uncertainty of the activity index does not consider all sources of error. The quoted errors typically have values of about 0.001 nm, yet according to the Gaia DR3 online documentation (Ulla et al. 2022), a sample of activity indices of low activity stars has a standard deviation of 0.015 and 0.022 nm for GSP-Spec and GSP-Phot input, which is an upper limit of the random errors. In Fig. 1 we show the
-index still reaches quite low values because the provided uncertainty of the activity index does not consider all sources of error. The quoted errors typically have values of about 0.001 nm, yet according to the Gaia DR3 online documentation (Ulla et al. 2022), a sample of activity indices of low activity stars has a standard deviation of 0.015 and 0.022 nm for GSP-Spec and GSP-Phot input, which is an upper limit of the random errors. In Fig. 1 we show the ![Mathematical equation: $\[R_{\text {IRT }}^{\prime}\]$](/articles/aa/full_html/2025/05/aa51421-24/aa51421-24-eq12.png) -index corresponding to these limits as dashed and solid black lines. Ca II IRT activity below this limit cannot be reliably detected in Gaia DR3, hence we consider stars with log(
-index corresponding to these limits as dashed and solid black lines. Ca II IRT activity below this limit cannot be reliably detected in Gaia DR3, hence we consider stars with log(![Mathematical equation: $\[R_{\text {IRT }}^{\prime}\]$](/articles/aa/full_html/2025/05/aa51421-24/aa51421-24-eq13.png) ) < −5.4 as inactive in the following. This leaves us with 24 300 eRASS1 and 43 200 eRASS:5 X-ray detections out of 180 700 sources with reliable activity indices.
) < −5.4 as inactive in the following. This leaves us with 24 300 eRASS1 and 43 200 eRASS:5 X-ray detections out of 180 700 sources with reliable activity indices.
In Fig. 2, we compare the ![Mathematical equation: $\[R_{\mathrm{IRT}}^{\prime}\]$](/articles/aa/full_html/2025/05/aa51421-24/aa51421-24-eq16.png) -index distribution for all Gaia DR3 sources and those sources also detected as X-ray sources in eRASS1 and eRASS:5. Fig. 2 shows that most of the sources with log(
-index distribution for all Gaia DR3 sources and those sources also detected as X-ray sources in eRASS1 and eRASS:5. Fig. 2 shows that most of the sources with log(![Mathematical equation: $\[R_{\text {IRT }}^{\prime}\]$](/articles/aa/full_html/2025/05/aa51421-24/aa51421-24-eq17.png) ) > −5 are detected in eRASS:5 and the detection fraction increases up to more than 90%. However, the fraction of X-ray detected sources rapidly decreases for smaller
) > −5 are detected in eRASS:5 and the detection fraction increases up to more than 90%. However, the fraction of X-ray detected sources rapidly decreases for smaller ![Mathematical equation: $\[R_{\text {IRT }}^{\prime}\]$](/articles/aa/full_html/2025/05/aa51421-24/aa51421-24-eq18.png) -indices. Especially sources with a low
-indices. Especially sources with a low ![Mathematical equation: $\[R_{\text {IRT }}^{\prime}\]$](/articles/aa/full_html/2025/05/aa51421-24/aa51421-24-eq19.png) -index remain undetected in eRASS1. Following Lanzafame et al. (2023) we divided our sample in different groups: the very high activity group (VHA; log(
-index remain undetected in eRASS1. Following Lanzafame et al. (2023) we divided our sample in different groups: the very high activity group (VHA; log(![Mathematical equation: $\[R_{\text {IRT }}^{\prime}\]$](/articles/aa/full_html/2025/05/aa51421-24/aa51421-24-eq20.png) ) > −4.9) and the high activity group (HA; −5.4 < log(
) > −4.9) and the high activity group (HA; −5.4 < log(![Mathematical equation: $\[R_{\text {IRT }}^{\prime}\]$](/articles/aa/full_html/2025/05/aa51421-24/aa51421-24-eq21.png) ) < −4.9). Lower activity values are usually not reliably detected in Gaia DR3 and these sources can be considered as inactive (IA; log(
) < −4.9). Lower activity values are usually not reliably detected in Gaia DR3 and these sources can be considered as inactive (IA; log(![Mathematical equation: $\[R_{\text {IRT }}^{\prime}\]$](/articles/aa/full_html/2025/05/aa51421-24/aa51421-24-eq22.png) ) < −5.4) so that no correlation with other activity indicators such as X-rays is expected within this group.
) < −5.4) so that no correlation with other activity indicators such as X-rays is expected within this group.
In Table 1 we provide the total number of sources and the number of likely eRASS1 and eRASS:5 identifications in each of these groups separated by spectral type and luminosity class. Specifically, we divided our sample in giants (located more than 2 mag above the main sequence and with GBP − GRP < 1.84 mag) and dwarfs of spectral type F (GBP − GRP < 0.78 mag), G (0.78 ≤ GBP − GRP < 0.98 mag), K (0.98 ≤ GBP − GR < 1.84 mag), and M (GBP − GRP ≥ 1.84 mag). For the VHA sources, more than 80% are detected as X-ray sources in eRASS: 5 but this fraction decreases to 7.2% for the inactive sources; only for stars classified as F-type we find a detection rate of only 54% for the VHA sources.
In Fig. 3, we compare the G-band magnitudes, distances, GBP − GRP colors and the reddening for all sources with reliable Ca II IRT measurements with those also identified as eRASS1 and eRASS:5 X-ray emitters. In general, the sources detected in X-rays are somewhat brighter and closer to the Sun. Furthermore, we detect more of the redder sources in X-rays but the reddest objects with GBP − GRP-values greater than about 3 mag remain undetected; an inspection of these sources revealed that they are typically giants with very little or no X-ray emission (see Schmitt et al. (2024) for a detailed study). Since the majority of the sources in our sample is quite close to the Sun, the reddening is small for most objects, but extends to larger values for a few sources. The sample of eRASS1 detected sources has overall very similar properties although more of the sources at higher distances remain undetected.
Since Lanzafame et al. (2023) estimated the Ca II IRT activity index by subtracting photospheric model spectra, their activity indices do include the basal flux. A basal flux contribution is well known for the Ca II H&K lines (e.g. Mittag et al. 2013). Together with conversions between the Ca II IRT and Ca II H&K activity, e.g. from Martin et al. (2017) or Lanzafame et al. (2023), the ![Mathematical equation: $\[R_{\mathrm{IRT}}^{\prime}\]$](/articles/aa/full_html/2025/05/aa51421-24/aa51421-24-eq23.png) -index corresponding to the Ca II H&K basal flux can be estimated. (We note that there are also direct basal flux estimates for the Ca II IRT lines (Martin 2017).) The resulting value of log(
-index corresponding to the Ca II H&K basal flux can be estimated. (We note that there are also direct basal flux estimates for the Ca II IRT lines (Martin 2017).) The resulting value of log(![Mathematical equation: $\[R_{\text {IRT }}^{\prime}\]$](/articles/aa/full_html/2025/05/aa51421-24/aa51421-24-eq24.png) ) is expected between about −6.0 and −5.5 depending on the color and the adopted IRT-H&K conversion, making its detection challenging with the current Gaia data. However, more sensitive data, possibly contained in the next Gaia data release, are likely to improve the detectability of the expected basal IRT flux contribution.
) is expected between about −6.0 and −5.5 depending on the color and the adopted IRT-H&K conversion, making its detection challenging with the current Gaia data. However, more sensitive data, possibly contained in the next Gaia data release, are likely to improve the detectability of the expected basal IRT flux contribution.
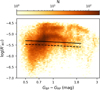 |
Fig. 1 Distribution of the log( |
![Mathematical equation: $\[R_{\text {IRT }}^{\prime}\]$](/articles/aa/full_html/2025/05/aa51421-24/aa51421-24-eq6.png)
![Mathematical equation: $\[R_{\text {IRT }}^{\prime}\]$](/articles/aa/full_html/2025/05/aa51421-24/aa51421-24-eq7.png)
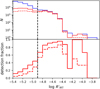 |
Fig. 2 Distribution of log( |
![Mathematical equation: $\[R_{\text {IRT }}^{\prime}\]$](/articles/aa/full_html/2025/05/aa51421-24/aa51421-24-eq14.png)
![Mathematical equation: $\[R_{\mathrm{IRT}}^{\prime}\]$](/articles/aa/full_html/2025/05/aa51421-24/aa51421-24-eq15.png)
X-ray detection fraction.
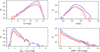 |
Fig. 3 G-band magnitude, distance, GBP − GRP color, and reddening distribution of the Gaia DR3 sources with reliable activity index. The blue histogram shows the distribution for all and those sources identified as eRASS1 and eRASS:5 X-ray emitter are indicated by the red dashed and solid lines, respectively. |
4 Correlation between chromospheric and X-ray activity
To investigate the relation between chromospheric and coronal activity, we show the X-ray to bolometric2 flux ratio as derived from eRASS:5 as a function of the ![Mathematical equation: $\[R_{\text {IRT }}^{\prime}\]$](/articles/aa/full_html/2025/05/aa51421-24/aa51421-24-eq25.png) -index as derived by Lanzafame et al. (2023) in Fig. 4. As evidenced by Fig. 4, both activity indicators are reasonably well correlated for the highly and very highly active sources. We then fitted a linear relation between the logarithmic X-ray to bolometric flux ratio and the logarithmic
-index as derived by Lanzafame et al. (2023) in Fig. 4. As evidenced by Fig. 4, both activity indicators are reasonably well correlated for the highly and very highly active sources. We then fitted a linear relation between the logarithmic X-ray to bolometric flux ratio and the logarithmic ![Mathematical equation: $\[R_{\text {IRT }}^{\prime}\]$](/articles/aa/full_html/2025/05/aa51421-24/aa51421-24-eq26.png) -index for the VHA and HA sources satisfying log(
-index for the VHA and HA sources satisfying log(![Mathematical equation: $\[R_{\text {IRT }}^{\prime}\]$](/articles/aa/full_html/2025/05/aa51421-24/aa51421-24-eq27.png) ) > −5.4 using the ordinary least-squares (OLS) bisector regression as described by Isobe et al. (1990). The resulting best fit parameters and the Pearson correlation coefficients (PCC) are listed in Table 2, the best fit is also shown as black solid line in Fig. 4. For comparison, we show in Fig. 4 the best fit to the eRASS1 detected sources as black dashed line. The slope of the fit is slightly flatter because more sources at low fractional X-ray fluxes remain undetected.
) > −5.4 using the ordinary least-squares (OLS) bisector regression as described by Isobe et al. (1990). The resulting best fit parameters and the Pearson correlation coefficients (PCC) are listed in Table 2, the best fit is also shown as black solid line in Fig. 4. For comparison, we show in Fig. 4 the best fit to the eRASS1 detected sources as black dashed line. The slope of the fit is slightly flatter because more sources at low fractional X-ray fluxes remain undetected.
Although most of the VHA sources are also detected in X-rays, about 2500 of these remain undetected even in eRASS:5. The detection fraction of the VHA sources is the highest for K-type dwarfs, while almost half of F-type sources remain undetected in eRASS:5 (see Table 1); this group accounts for 53% of the undetected VHA sources; we obtained upper limits for the undetected VHA sources from Tubín-Arenas et al. (2024). In some cases, the upper limits are less reliable due to a nearby eRASS:5 source. Although most of these X-ray sources are unlikely to be associated with the VHA source, they may prevent the detection of another nearby X-ray source. In Fig. 5 we compare the upper limits of the remaining 1600 sources with the detected VHA sources. Even for sources with log(![Mathematical equation: $\[R_{\text {IRT }}^{\prime}\]$](/articles/aa/full_html/2025/05/aa51421-24/aa51421-24-eq29.png) ) > −4.7, we find some detected sources down to log(FX/Fbol) = −4 causing the correlation to appear quite flat but they are mostly F- and G-type sources that generally do not reach very high fractional X-ray fluxes (cf. Sect. 4.1). Most of the upper limits on the fractional X-ray flux are lower than for similar detected sources, which shows that the reason for their non-detection is a lower X-ray activity of these sources.
) > −4.7, we find some detected sources down to log(FX/Fbol) = −4 causing the correlation to appear quite flat but they are mostly F- and G-type sources that generally do not reach very high fractional X-ray fluxes (cf. Sect. 4.1). Most of the upper limits on the fractional X-ray flux are lower than for similar detected sources, which shows that the reason for their non-detection is a lower X-ray activity of these sources.
Parameters of OLS bisector for the different spectral types.
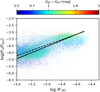 |
Fig. 4 X-ray to bolometric flux ratio as function of the index |
![Mathematical equation: $\[R_{\text {IRT }}^{\prime}\]$](/articles/aa/full_html/2025/05/aa51421-24/aa51421-24-eq28.png)
4.1 Dependence on spectral type
The activity of the sample sources also varies for different spectral types as shown by a color–magnitude diagram of these sources in Fig. 6. Most of the F-type sources have rather low chromospheric activity, while higher activity values are found among the later type stars. Especially for M-type dwarfs, sources with high and low activity are separated, with highly active dwarfs being located above the main sequence, which indicates youth. Among giants, highly active sources are found in the subgiant regime, likely caused by RS CVn-type systems, while the more evolved stars are generally less active.
We compare the relation between the X-ray over bolometric flux ratio and the ![Mathematical equation: $\[R_{\text {IRT }}^{\prime}\]$](/articles/aa/full_html/2025/05/aa51421-24/aa51421-24-eq32.png) -index for the different spectral types in Fig. 7 and specify the best fit parameters and their statistical uncertainties of the OLS bisector regression for sources with log(
-index for the different spectral types in Fig. 7 and specify the best fit parameters and their statistical uncertainties of the OLS bisector regression for sources with log(![Mathematical equation: $\[R_{\text {IRT }}^{\prime}\]$](/articles/aa/full_html/2025/05/aa51421-24/aa51421-24-eq33.png) ) > −5.4 in Table 2. We note that, e.g., the extension of the fit to different
) > −5.4 in Table 2. We note that, e.g., the extension of the fit to different ![Mathematical equation: $\[R_{\text {IRT }}^{\prime}\]$](/articles/aa/full_html/2025/05/aa51421-24/aa51421-24-eq34.png) -indices affects the parameters more strongly than the provided statistical errors. While both activity indicators are poorly correlated for F-type dwarfs, the strength of the correlation as well as the slope of the regression curve increase for G- and K-type stars. The slope and the correlation coefficient decrease again for M-type dwarfs because many of these sources in our sample are saturated in X-rays. We also find a strong correlation over a large range for giants although with a flatter slope. The best fits to the eRASS1 detected sources (shown by the black dashed lines in Fig. 7) are very similar except for M-type dwarfs, for which the number of sources is quite small especially for lower activities.
-indices affects the parameters more strongly than the provided statistical errors. While both activity indicators are poorly correlated for F-type dwarfs, the strength of the correlation as well as the slope of the regression curve increase for G- and K-type stars. The slope and the correlation coefficient decrease again for M-type dwarfs because many of these sources in our sample are saturated in X-rays. We also find a strong correlation over a large range for giants although with a flatter slope. The best fits to the eRASS1 detected sources (shown by the black dashed lines in Fig. 7) are very similar except for M-type dwarfs, for which the number of sources is quite small especially for lower activities.
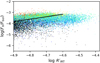 |
Fig. 5 X-ray to bolometric flux ratio as function of the index |
![Mathematical equation: $\[R_{\text {IRT }}^{\prime}\]$](/articles/aa/full_html/2025/05/aa51421-24/aa51421-24-eq30.png)
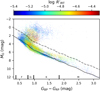 |
Fig. 6 Color–magnitude diagram of the eRASS:5 sources with reliable activity index in Gaia DR3. The color scales with the index |
![Mathematical equation: $\[R_{\text {IRT }}^{\prime}\]$](/articles/aa/full_html/2025/05/aa51421-24/aa51421-24-eq31.png)
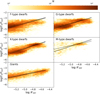 |
Fig. 7 X-ray to bolometric flux ratio as function of the index |
![Mathematical equation: $\[R_{\text {IRT }}^{\prime}\]$](/articles/aa/full_html/2025/05/aa51421-24/aa51421-24-eq35.png)
4.2 Flux-flux relations
We also estimated the observed, mean surface flux of the IRT lines ℱIRT by Equation (1) and the surface X-ray flux through
![Mathematical equation: $\[\mathcal{F}_X=F_X \cdot \frac{d^2}{R^2},\]$](/articles/aa/full_html/2025/05/aa51421-24/aa51421-24-eq36.png) (2)
(2)
where d is the distance estimated by the inverse parallax and R is the radius of the star provided by GSP-Phot. Since the radius is not available for a few sources, we have surface IRT and X-ray fluxes for 41 300 eRASS:5 detetcted sources.
The flux-flux relation of the much smaller sample by Martínez-Arnáiz et al. (2011) can be best described by two branches with the upper branch consisting of sources saturated in X-rays. Therefore, we divided our sample in different ranges of log(FX/Fbol) and show the relations of the IRT and X-ray surface fluxes in Fig. 8 and compare the best-fit parameters of the slopes in Table 3. Since the correlation for F-type dwarfs is very weak in all samples, we excluded these sources from this analysis. The flux–flux relation of our sources somewhat differs from the best fits of Martínez-Arnáiz et al. (2011). We also see a decreasing slope for sources with a higher fractional X-ray flux, but this is a more gradual development without two separate branches. Again, the differences between the best fits for the eRASS1 and eRASS:5 detected sources are small.
Parameters of OLS bisector for the different activity levels.
4.3 Correlation between the X-ray and Ca II H&K fluxes
Fuhrmeister et al. (2022) studied the connection between the emission of the chromospheric Ca II H&K lines and simultaneous X-ray measurements for 183 dwarfs and derived a correlation between the X-ray to bolometric flux ratio and the activity index ![Mathematical equation: $\[R_{\mathrm{HK}}^{+}\]$](/articles/aa/full_html/2025/05/aa51421-24/aa51421-24-eq37.png) . To make their correlation comparable with our measurements of the X-ray and Ca II IRT fluxes, we applied the conversion between the
. To make their correlation comparable with our measurements of the X-ray and Ca II IRT fluxes, we applied the conversion between the ![Mathematical equation: $\[R_{\mathrm{IRT}}^{\prime}\]$](/articles/aa/full_html/2025/05/aa51421-24/aa51421-24-eq38.png) - and
- and ![Mathematical equation: $\[R_{\mathrm{HK}}^{\prime}\]$](/articles/aa/full_html/2025/05/aa51421-24/aa51421-24-eq39.png) -index as derived by Equation 9 of Lanzafame et al. (2023). With these two correlations, we calculated the expected fractional X-ray fluxes from the
-index as derived by Equation 9 of Lanzafame et al. (2023). With these two correlations, we calculated the expected fractional X-ray fluxes from the ![Mathematical equation: $\[R_{\text {IRT }}^{\prime}\]$](/articles/aa/full_html/2025/05/aa51421-24/aa51421-24-eq40.png) -indices as provided in Gaia DR3. In Fig. 9 we compare the calculated with the observed eRASS:5 fractional X-ray flux for the different spectral types. Since the sample of Fuhrmeister et al. (2022) contains only mid F- to late K-type dwarfs, their relation is only valid for these sources. In general, the X-ray activity is well predicted with a mean difference of 0.02 dex. However, the fractional X-ray flux of late K-type dwarfs is systematically underestimated. We also see a slight trend of increasing calculated fractional X-ray fluxes compared to the observed values with increasing
-indices as provided in Gaia DR3. In Fig. 9 we compare the calculated with the observed eRASS:5 fractional X-ray flux for the different spectral types. Since the sample of Fuhrmeister et al. (2022) contains only mid F- to late K-type dwarfs, their relation is only valid for these sources. In general, the X-ray activity is well predicted with a mean difference of 0.02 dex. However, the fractional X-ray flux of late K-type dwarfs is systematically underestimated. We also see a slight trend of increasing calculated fractional X-ray fluxes compared to the observed values with increasing ![Mathematical equation: $\[R_{\text {IRT }}^{\prime}\]$](/articles/aa/full_html/2025/05/aa51421-24/aa51421-24-eq41.png) -index, but also VHA sources at late spectral types are observed at higher X-ray activities. The standard deviation of the calculated minus observed values is with 0.40 dex larger than the error of 0.35 dex for the X ray and Ca II H&K fluxes reported by Fuhrmeister et al. (2022), however, our observations are not simultaneous and can therefore be affected by different states in the flaring activity and activity cycle.
-index, but also VHA sources at late spectral types are observed at higher X-ray activities. The standard deviation of the calculated minus observed values is with 0.40 dex larger than the error of 0.35 dex for the X ray and Ca II H&K fluxes reported by Fuhrmeister et al. (2022), however, our observations are not simultaneous and can therefore be affected by different states in the flaring activity and activity cycle.
We note that Fuhrmeister et al. (2022) compared the fractional X-ray flux with the basal corrected H&K index, while Lanzafame et al. (2023) applied the activity indices without basal correction, which might introduce a small bias. Furthermore, the conversion also depends on the adopted relation between the IRT and H&K activity indices. Applying other relations, the shape of the distribution remains similar, however, e.g., Equation 8 of Lanzafame et al. (2023) results in a general overestimation of the X-ray over bolometric flux by 0.50 dex, while the fractional X-ray flux is systematically underestimated by 0.47 dex if the relation from Martin et al. (2017) is adopted instead. With the eRASS1 sample, we observe similar but slightly higher fractional X-ray fluxes due to its lower sensitivity.
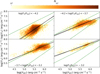 |
Fig. 8 eRASS:5 X-ray as function of the IRT surface fluxes for different ranges of the fractional X-ray flux. The color scales with the number of sources within the bin, the best fits of our data are shown by the black slopes (dashed and solid lines for eRASS1 and eRASS:5 data) and the green dashed lines indicate the upper and lower branch for the data of Martínez-Arnáiz et al. (2011) (cf. Table 3). |
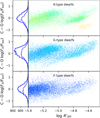 |
Fig. 9 Calculated minus observed X-ray over bolometric flux values as a function of the |
![Mathematical equation: $\[R_{\text {IRT }}^{\prime}\]$](/articles/aa/full_html/2025/05/aa51421-24/aa51421-24-eq42.png)
4.4 Relation with rotation
Distefano et al. (2023) provide rotation periods estimated from variability in Gaia photometric time series. Rotation periods are available for 790 and 1200 of our sources with eRASS1 and eRASS:5 X-ray detection and a reliable ![Mathematical equation: $\[R_{\text {IRT }}^{\prime}\]$](/articles/aa/full_html/2025/05/aa51421-24/aa51421-24-eq43.png) -index and we show the different activity indicators vs. the Rossby number in Fig. 10, adopting the convection turnover times from the broken power law model from Freund et al. (2024). For fast rotators, the X-ray and IRT emission saturate at log(FX/Fbol) ≈ −3 and log(
-index and we show the different activity indicators vs. the Rossby number in Fig. 10, adopting the convection turnover times from the broken power law model from Freund et al. (2024). For fast rotators, the X-ray and IRT emission saturate at log(FX/Fbol) ≈ −3 and log(![Mathematical equation: $\[R_{\text {IRT }}^{\prime}\]$](/articles/aa/full_html/2025/05/aa51421-24/aa51421-24-eq44.png) ) ≈ −4.5 with the saturation regime starting at a similar Rossby number of log(RO) ≈ −1.4. Hence, the ratio between X-ray and IRT flux is quite constant at a level of about log(FX/FIRT) = 1.5. Late type stars often have a lower
) ≈ −4.5 with the saturation regime starting at a similar Rossby number of log(RO) ≈ −1.4. Hence, the ratio between X-ray and IRT flux is quite constant at a level of about log(FX/FIRT) = 1.5. Late type stars often have a lower ![Mathematical equation: $\[R_{\mathrm{IRT}}^{\prime}\]$](/articles/aa/full_html/2025/05/aa51421-24/aa51421-24-eq45.png) -index even in the saturation regime which might be caused by the transition from partially to fully convective stars or might indicate that the conversion between the activity index and
-index even in the saturation regime which might be caused by the transition from partially to fully convective stars or might indicate that the conversion between the activity index and ![Mathematical equation: $\[R_{\text {IRT }}^{\prime}\]$](/articles/aa/full_html/2025/05/aa51421-24/aa51421-24-eq46.png) -index (as estimated by Equation 7 of Lanzafame et al. 2023) is inaccurate for these sources. For slow rotators, both activity indicators show a linear decline, but the X-ray flux decreases faster than the IRT flux. This leads to a linear decrease of the flux ratio log(FX/FIRT) although the scatter between the individual sources is quite large.
-index (as estimated by Equation 7 of Lanzafame et al. 2023) is inaccurate for these sources. For slow rotators, both activity indicators show a linear decline, but the X-ray flux decreases faster than the IRT flux. This leads to a linear decrease of the flux ratio log(FX/FIRT) although the scatter between the individual sources is quite large.
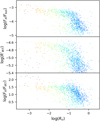 |
Fig. 10 X-ray to bolometric flux ratio, |
![Mathematical equation: $\[R_{\mathrm{IRT}}^{\prime}\]$](/articles/aa/full_html/2025/05/aa51421-24/aa51421-24-eq47.png)
5 Conclusions
We combined Ca II IRT measurements obtained from Gaia with X-ray fluxes obtained from eRASS1 and eRASS:5 and constructed a sample of 24 300 and 43 200 late-type stars, respectively, for which both activity indicators have been reliably detected. The X-ray detection fraction is largest for sources being very highly active in the IRT lines and for stars of spectral type K, where up to 90% of the sources are detected in eRASS:5. The detection fraction very rapidly decreases for sources with lower IRT activity indices and F-type dwarfs often remain undetected as X-ray sources even if they are very active in the IRT lines.
The ![Mathematical equation: $\[R_{\mathrm{IRT}}^{\prime}\]$](/articles/aa/full_html/2025/05/aa51421-24/aa51421-24-eq48.png) -index generally shows a strong correlation with the X-ray to bolometric flux ratio, especially for K-type dwarfs and giants, while the two activity indicators are only poorly correlated for F-type dwarfs and sources in a low activity state. We emphasize that IRT activity values below log(
-index generally shows a strong correlation with the X-ray to bolometric flux ratio, especially for K-type dwarfs and giants, while the two activity indicators are only poorly correlated for F-type dwarfs and sources in a low activity state. We emphasize that IRT activity values below log(![Mathematical equation: $\[R_{\text {IRT }}^{\prime}\]$](/articles/aa/full_html/2025/05/aa51421-24/aa51421-24-eq49.png) ) < −5.4 are not reliably detected in the current Gaia data release and should therefore be considered as inactive. As a consequence, no correlation with the X-ray activity is expected for these sources. For more active sources, the relation is well described by a linear slope but the slope increases towards later spectral types. When we compare the surface IRT and X-ray fluxes, we see a gradual change with the fractional X-ray flux but not two distinct branches as described by Martínez-Arnáiz et al. (2011). The deviation between the
) < −5.4 are not reliably detected in the current Gaia data release and should therefore be considered as inactive. As a consequence, no correlation with the X-ray activity is expected for these sources. For more active sources, the relation is well described by a linear slope but the slope increases towards later spectral types. When we compare the surface IRT and X-ray fluxes, we see a gradual change with the fractional X-ray flux but not two distinct branches as described by Martínez-Arnáiz et al. (2011). The deviation between the ![Mathematical equation: $\[R_{\mathrm{IRT}}^{\prime}\]$](/articles/aa/full_html/2025/05/aa51421-24/aa51421-24-eq50.png) -index and the X-ray to bolometric flux ratio is with about 0.40 dex slightly larger than for simultaneously observed X-ray and Ca II H&K fluxes (Fuhrmeister et al. 2022). This is probably caused by different activity regimes observed by Gaia and eROSITA observations due to the large time difference of the observations. When combined with rotation periods, we see that the X-ray to bolometric flux ratio and the
-index and the X-ray to bolometric flux ratio is with about 0.40 dex slightly larger than for simultaneously observed X-ray and Ca II H&K fluxes (Fuhrmeister et al. 2022). This is probably caused by different activity regimes observed by Gaia and eROSITA observations due to the large time difference of the observations. When combined with rotation periods, we see that the X-ray to bolometric flux ratio and the ![Mathematical equation: $\[R_{\mathrm{IRT}}^{\prime}\]$](/articles/aa/full_html/2025/05/aa51421-24/aa51421-24-eq51.png) -index saturates for fast rotating stars at a similar Rossby number causing the X-ray over IRT flux to be constant. For slow rotators, the fractional X-ray flux shows a steeper decline, and therefore, the X-ray to IRT flux ratio also decreases.
-index saturates for fast rotating stars at a similar Rossby number causing the X-ray over IRT flux to be constant. For slow rotators, the fractional X-ray flux shows a steeper decline, and therefore, the X-ray to IRT flux ratio also decreases.
Data availability
The catalog of the 24 300 sources with reliable Ca II IRT activity and eRASS1 detection is available at the CDS via anonymous ftp to cdsarc.cds.unistra.fr (130.79.128.5) or via https://cdsarc.cds.unistra.fr/viz-bin/cat/J/A+A/697/A230. Future eROSITA data releases including eRASS:5 will be published following the timeline on https://erosita.mpe.mpg.de/erass/.
Acknowledgements
SF gratefully acknowledge supports through the Integrationsamt Hildesheim and the ZAV of Bundesagentur für Arbeit, SC by DFG under grant CZ 222/5-1, JR by DLR under grant 50 QR 2505, PCS by DLR under grants 50 OR 2215 and 50 OR 2412, and BF by DFG under program ID EI 409/20-1 and SCHN 1382/4-1. SF thanks Gabriele Uth and Maria Theresa Lehmann for their support. This work is based on data from eROSITA, the soft X-ray instrument aboard SRG, a joint Russian-German science mission supported by the Russian Space Agency (Roskosmos), in the interests of the Russian Academy of Sciences represented by its Space Research Institute (IKI), and the Deutsches Zentrum für Luft- und Raumfahrt (DLR). The SRG spacecraft was built by Lavochkin Association (NPOL) and its subcontractors, and is operated by NPOL with support from the Max Planck Institute for Extrater-restrial Physics (MPE). The development and construction of the eROSITA X-ray instrument was led by MPE, with contributions from the Dr. Karl Remeis Observatory Bamberg & ECAP (FAU Erlangen-Nuernberg), the University of Hamburg Observatory, the Leibniz Institute for Astrophysics Potsdam (AIP), and the Institute for Astronomy and Astrophysics of the University of Tübingen, with the support of DLR and the Max Planck Society. The Argelander Institute for Astronomy of the University of Bonn and the Ludwig Maximilians Universität Munich also participated in the science preparation for eROSITA. The eROSITA data shown here were processed using the eSASS/NRTA software system developed by the German eROSITA consortium. This work has made use of data from the European Space Agency (ESA) mission Gaia (https://www.cosmos.esa.int/gaia), processed by the Gaia Data Processing and Analysis Consortium (DPAC, https://www.cosmos.esa.int/web/gaia/dpac/consortium). Funding for the DPAC has been provided by national institutions, in particular the institutions participating in the Gaia Multilateral Agreement.
References
- Andrae, R., Fouesneau, M., Sordo, R., et al. 2023, A&A, 674, A27 [CrossRef] [EDP Sciences] [Google Scholar]
- Baliunas, S. L., Donahue, R. A., Soon, W. H., et al. 1995, ApJ, 438, 269 [Google Scholar]
- Brunner, H., Liu, T., Lamer, G., et al. 2022, A&A, 661, A1 [NASA ADS] [CrossRef] [EDP Sciences] [Google Scholar]
- Distefano, E., Lanzafame, A. C., Brugaletta, E., et al. 2023, A&A, 674, A20 [NASA ADS] [CrossRef] [EDP Sciences] [Google Scholar]
- Freund, S., Czesla, S., Predehl, P., et al. 2024, A&A, 684, A121 [NASA ADS] [CrossRef] [EDP Sciences] [Google Scholar]
- Fuhrmeister, B., Czesla, S., Robrade, J., et al. 2022, A&A, 661, A24 [NASA ADS] [CrossRef] [EDP Sciences] [Google Scholar]
- Gaia Collaboration (Prusti, T., et al.) 2016, A&A, 595, A1 [NASA ADS] [CrossRef] [EDP Sciences] [Google Scholar]
- Gaia Collaboration (Brown, A. G. A., et al.) 2021, A&A, 649, A1 [NASA ADS] [CrossRef] [EDP Sciences] [Google Scholar]
- Gaia Collaboration (Vallenari, A., et al.) 2023, A&A, 674, A1 [NASA ADS] [CrossRef] [EDP Sciences] [Google Scholar]
- Hall, J. C., Henry, G. W., Lockwood, G. W., Skiff, B. A., & Saar, S. H. 2009, AJ, 138, 312 [NASA ADS] [CrossRef] [Google Scholar]
- He, L., Wang, S., Liu, J., et al. 2019, ApJ, 871, 193 [NASA ADS] [CrossRef] [Google Scholar]
- Hempelmann, A., Mittag, M., Gonzalez-Perez, J. N., et al. 2016, A&A, 586, A14 [NASA ADS] [CrossRef] [EDP Sciences] [Google Scholar]
- Isobe, T., Feigelson, E. D., Akritas, M. G., & Babu, G. J. 1990, ApJ, 364, 104 [Google Scholar]
- Lanzafame, A. C., Brugaletta, E., Frémat, Y., et al. 2023, A&A, 674, A30 [NASA ADS] [CrossRef] [EDP Sciences] [Google Scholar]
- Linsky, J. L., Worden, S. P., McClintock, W., & Robertson, R. M. 1979, ApJS, 41, 47 [NASA ADS] [CrossRef] [Google Scholar]
- Martin, J. 2017, PhD thesis, University of Hamburg, Germany [Google Scholar]
- Martin, J., Fuhrmeister, B., Mittag, M., et al. 2017, A&A, 605, A113 [NASA ADS] [CrossRef] [EDP Sciences] [Google Scholar]
- Martínez-Arnáiz, R., López-Santiago, J., Crespo-Chacón, I., & Montes, D. 2011, MNRAS, 414, 2629 [CrossRef] [Google Scholar]
- Merloni, A., Lamer, G., Liu, T., et al. 2024, A&A, 682, A34 [NASA ADS] [CrossRef] [EDP Sciences] [Google Scholar]
- Mittag, M., Schmitt, J. H. M. M., & Schröder, K. P. 2013, A&A, 549, A117 [NASA ADS] [CrossRef] [EDP Sciences] [Google Scholar]
- Mittag, M., Schmitt, J. H. M. M., & Schröder, K. P. 2018, A&A, 618, A48 [NASA ADS] [CrossRef] [EDP Sciences] [Google Scholar]
- Pecaut, M. J., & Mamajek, E. E. 2013, ApJS, 208, 9 [Google Scholar]
- Predehl, P., Andritschke, R., Arefiev, V., et al. 2021, A&A, 647, A1 [EDP Sciences] [Google Scholar]
- Schmitt, J. H. M. M., Hünsch, M., Schneider, P. C., et al. 2024, arXiv e-prints [arXiv:2401.17273] [Google Scholar]
- Schrijver, C. J. 1983, A&A, 127, 289 [NASA ADS] [Google Scholar]
- Stelzer, B., Frasca, A., Alcalá, J. M., et al. 2013, A&A, 558, A141 [NASA ADS] [CrossRef] [EDP Sciences] [Google Scholar]
- Sunyaev, R., Arefiev, V., Babyshkin, V., et al. 2021, A&A, 656, A132 [NASA ADS] [CrossRef] [EDP Sciences] [Google Scholar]
- Tubín-Arenas, D., Krumpe, M., Lamer, G., et al. 2024, A&A, 682, A35 [NASA ADS] [CrossRef] [EDP Sciences] [Google Scholar]
- Ulla, A., Creevey, O. L., Álvarez, M. A., et al. 2022, Gaia DR3 documentation Chapter 11: Astrophysical parameters, Gaia DR3 documentation, European Space Agency; Gaia Data Processing and Analysis Consortium. Online at https://gea.esac.esa.int/archive/documentation/GDR3/index.html, id. 11 [Google Scholar]
- Wilson, O. C. 1978, ApJ, 226, 379 [Google Scholar]
We use extinction corrected Gaia magnitudes and reddening corrected colors throughout this paper adopting the values from Andrae et al. (2023).
We adopted the bolometric corrections from a table based upon Pecaut & Mamajek (2013) and regularly updated under http://www.pas.rochester.edu/~emamajek/EEM_dwarf_UBVIJHK_colors_Teff.txt (current version 2022.04.16).
All Tables
All Figures
|
Fig. 1 Distribution of the log( |
| In the text | |
|
Fig. 2 Distribution of log( |
| In the text | |
|
Fig. 3 G-band magnitude, distance, GBP − GRP color, and reddening distribution of the Gaia DR3 sources with reliable activity index. The blue histogram shows the distribution for all and those sources identified as eRASS1 and eRASS:5 X-ray emitter are indicated by the red dashed and solid lines, respectively. |
| In the text | |
|
Fig. 4 X-ray to bolometric flux ratio as function of the index |
| In the text | |
|
Fig. 5 X-ray to bolometric flux ratio as function of the index |
| In the text | |
|
Fig. 6 Color–magnitude diagram of the eRASS:5 sources with reliable activity index in Gaia DR3. The color scales with the index |
| In the text | |
|
Fig. 7 X-ray to bolometric flux ratio as function of the index |
| In the text | |
|
Fig. 8 eRASS:5 X-ray as function of the IRT surface fluxes for different ranges of the fractional X-ray flux. The color scales with the number of sources within the bin, the best fits of our data are shown by the black slopes (dashed and solid lines for eRASS1 and eRASS:5 data) and the green dashed lines indicate the upper and lower branch for the data of Martínez-Arnáiz et al. (2011) (cf. Table 3). |
| In the text | |
|
Fig. 9 Calculated minus observed X-ray over bolometric flux values as a function of the |
| In the text | |
|
Fig. 10 X-ray to bolometric flux ratio, |
| In the text | |
Current usage metrics show cumulative count of Article Views (full-text article views including HTML views, PDF and ePub downloads, according to the available data) and Abstracts Views on Vision4Press platform.
Data correspond to usage on the plateform after 2015. The current usage metrics is available 48-96 hours after online publication and is updated daily on week days.
Initial download of the metrics may take a while.