Fig. 2
Download original image
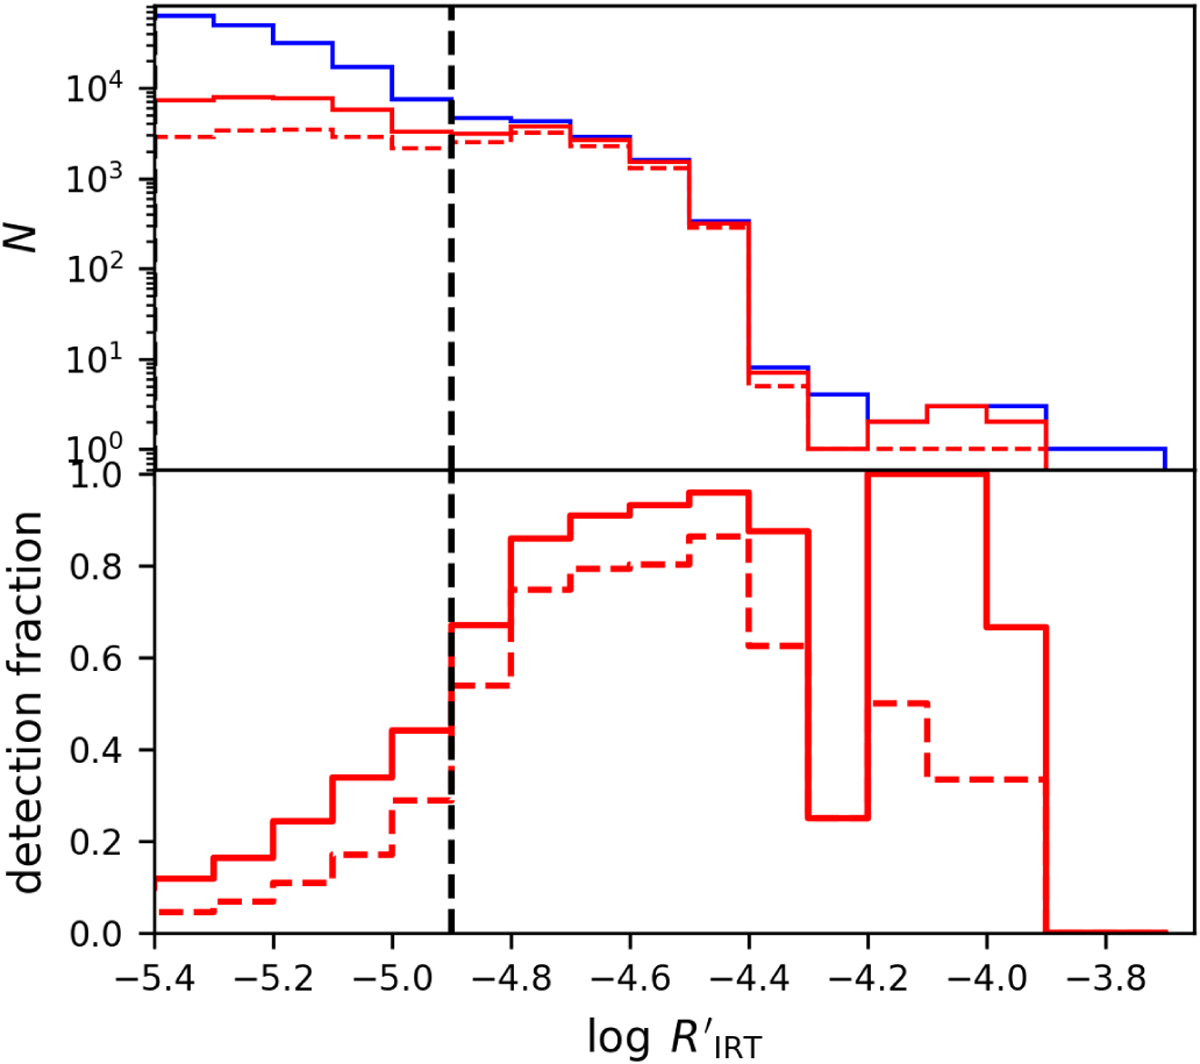
Distribution of log(![]() ) for Gaia DR3 sources. Upper panel: total number of all sources (blue histogram) and those sources identified as eRASS1 and eRASS:5 X-ray emitters (red dashed and solid histogram). Lower Panel: X-ray detection fraction vs.
) for Gaia DR3 sources. Upper panel: total number of all sources (blue histogram) and those sources identified as eRASS1 and eRASS:5 X-ray emitters (red dashed and solid histogram). Lower Panel: X-ray detection fraction vs. ![]() -index; the dashed line indicates the boundary between the HA and VHA groups (see text for details).
-index; the dashed line indicates the boundary between the HA and VHA groups (see text for details).
Current usage metrics show cumulative count of Article Views (full-text article views including HTML views, PDF and ePub downloads, according to the available data) and Abstracts Views on Vision4Press platform.
Data correspond to usage on the plateform after 2015. The current usage metrics is available 48-96 hours after online publication and is updated daily on week days.
Initial download of the metrics may take a while.