Fig. 8
Download original image
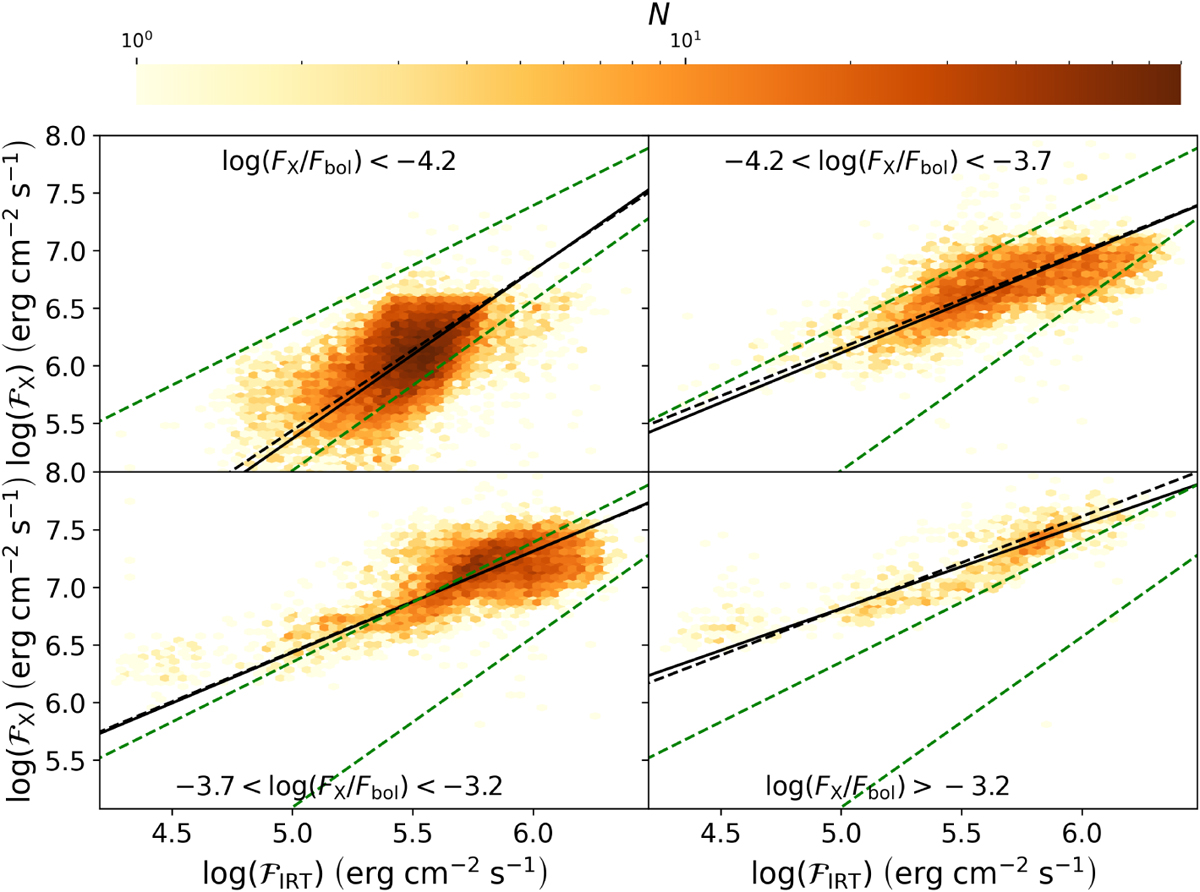
eRASS:5 X-ray as function of the IRT surface fluxes for different ranges of the fractional X-ray flux. The color scales with the number of sources within the bin, the best fits of our data are shown by the black slopes (dashed and solid lines for eRASS1 and eRASS:5 data) and the green dashed lines indicate the upper and lower branch for the data of Martínez-Arnáiz et al. (2011) (cf. Table 3).
Current usage metrics show cumulative count of Article Views (full-text article views including HTML views, PDF and ePub downloads, according to the available data) and Abstracts Views on Vision4Press platform.
Data correspond to usage on the plateform after 2015. The current usage metrics is available 48-96 hours after online publication and is updated daily on week days.
Initial download of the metrics may take a while.