Fig. 9
Download original image
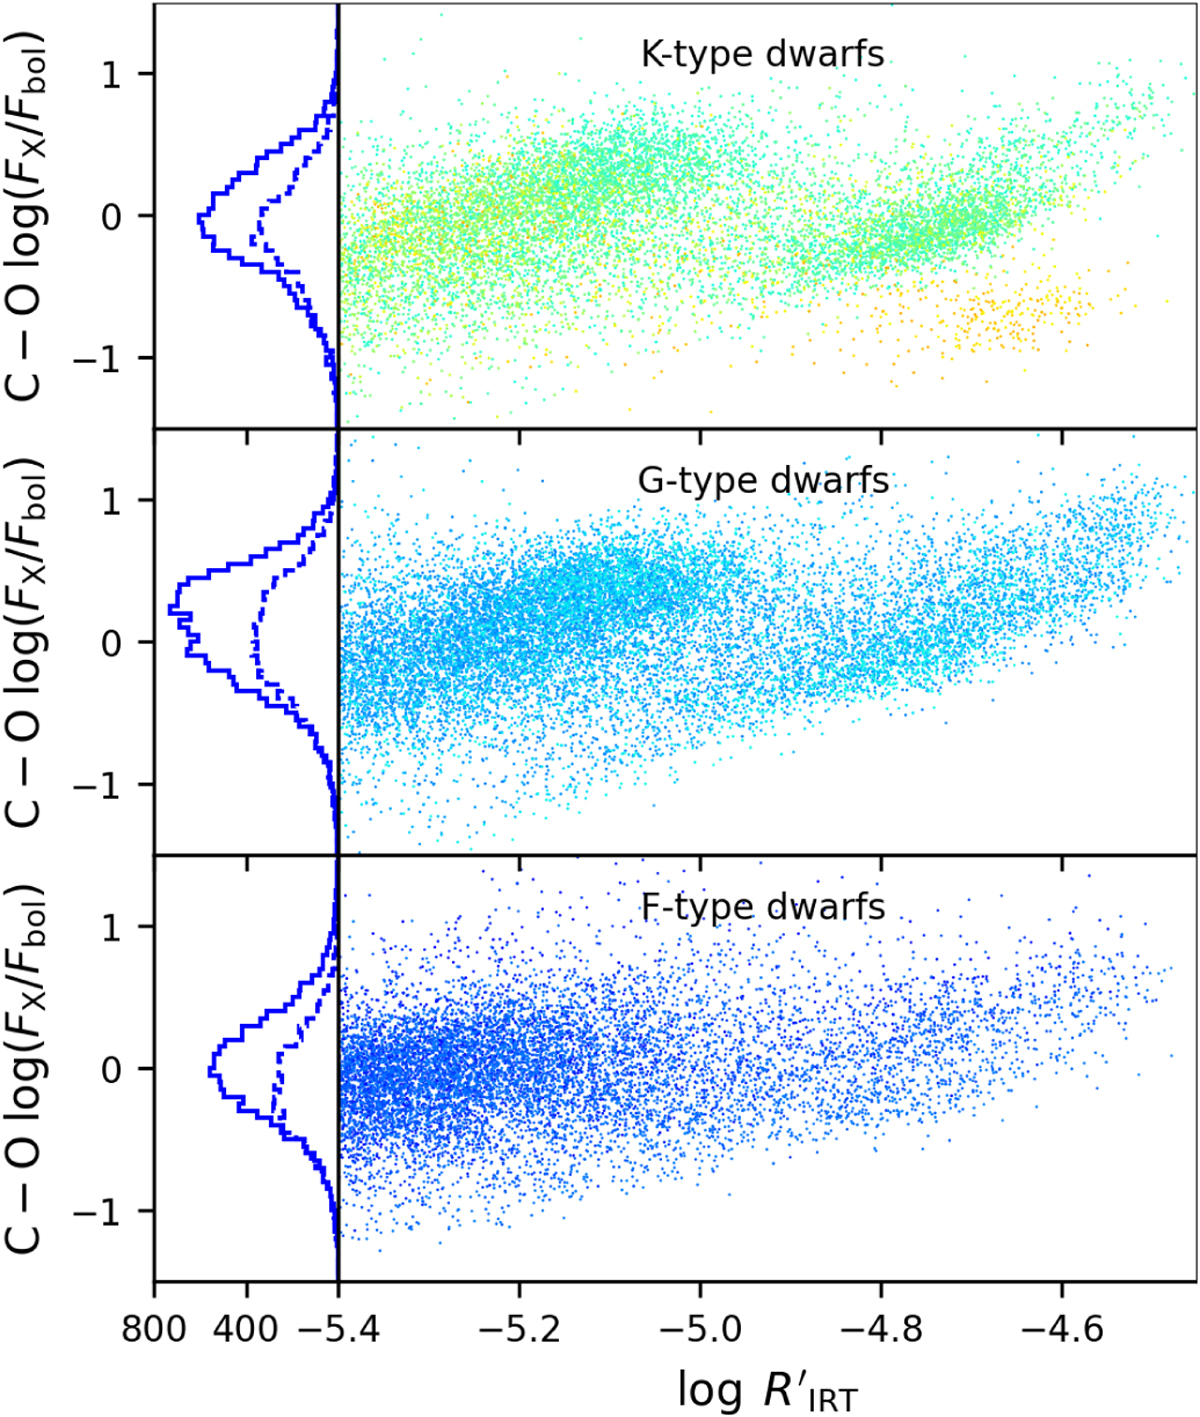
Calculated minus observed X-ray over bolometric flux values as a function of the ![]() -index. The panels show the different spectral types and the color coding of the sources is the same as in Fig. 4. The dots in the right panels show the values for the eRASS:5 detected sources and the dashed and solid histograms in the left panels show the distributions of the calculated minus observed values for eRASS1 and eRASS:5, respectively.
-index. The panels show the different spectral types and the color coding of the sources is the same as in Fig. 4. The dots in the right panels show the values for the eRASS:5 detected sources and the dashed and solid histograms in the left panels show the distributions of the calculated minus observed values for eRASS1 and eRASS:5, respectively.
Current usage metrics show cumulative count of Article Views (full-text article views including HTML views, PDF and ePub downloads, according to the available data) and Abstracts Views on Vision4Press platform.
Data correspond to usage on the plateform after 2015. The current usage metrics is available 48-96 hours after online publication and is updated daily on week days.
Initial download of the metrics may take a while.