Open Access
Fig. 6
Download original image
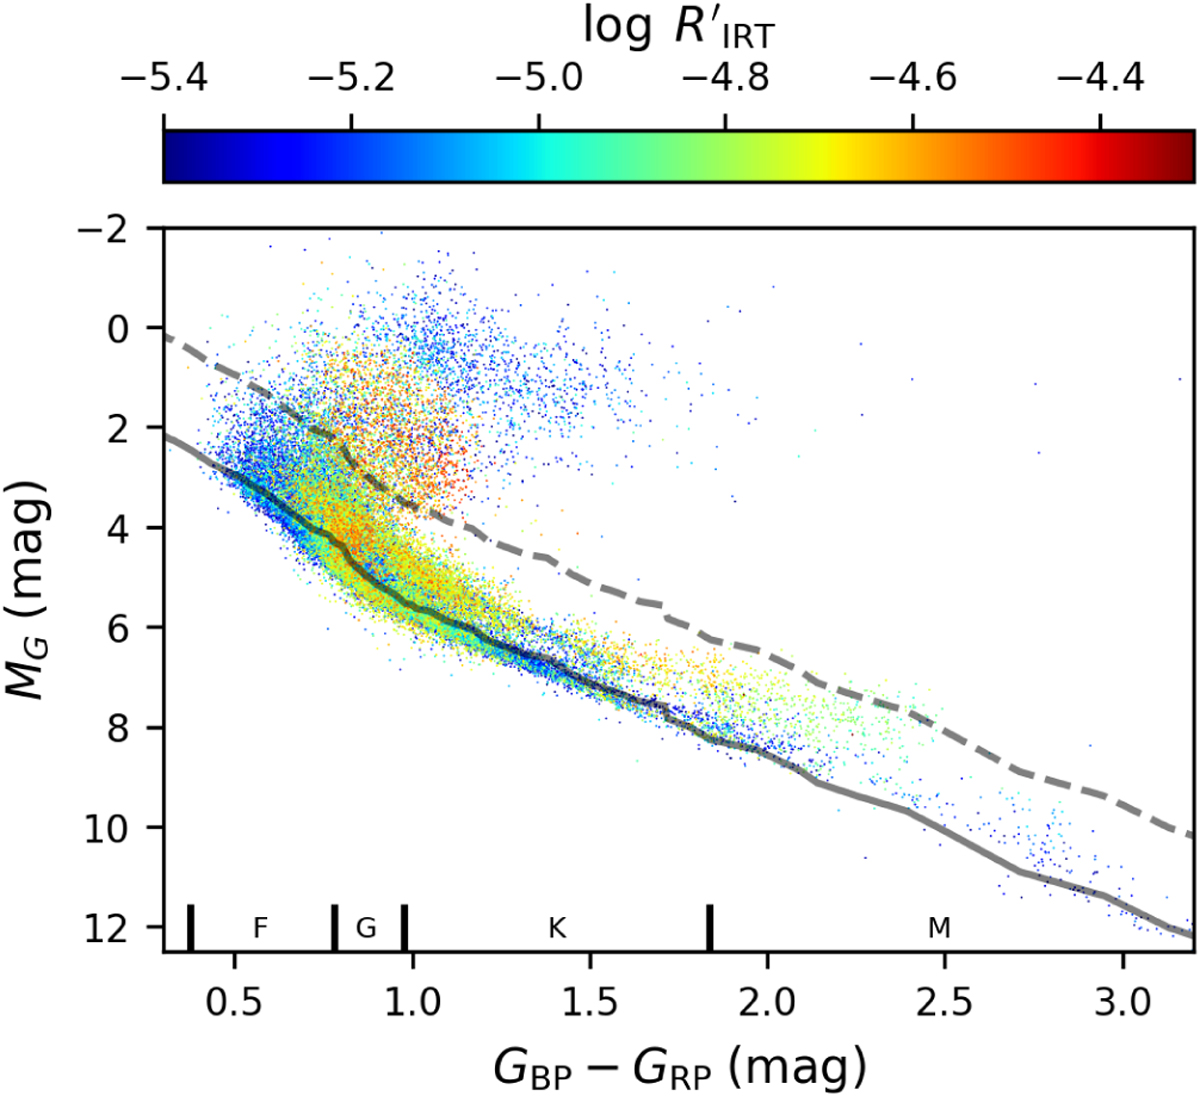
Color–magnitude diagram of the eRASS:5 sources with reliable activity index in Gaia DR3. The color scales with the index ![]() . The solid line indicates the main sequence and sources located on the dashed line are 2 mag brighter than main sequence sources.
. The solid line indicates the main sequence and sources located on the dashed line are 2 mag brighter than main sequence sources.
Current usage metrics show cumulative count of Article Views (full-text article views including HTML views, PDF and ePub downloads, according to the available data) and Abstracts Views on Vision4Press platform.
Data correspond to usage on the plateform after 2015. The current usage metrics is available 48-96 hours after online publication and is updated daily on week days.
Initial download of the metrics may take a while.