Open Access
Fig. 7.
Download original image
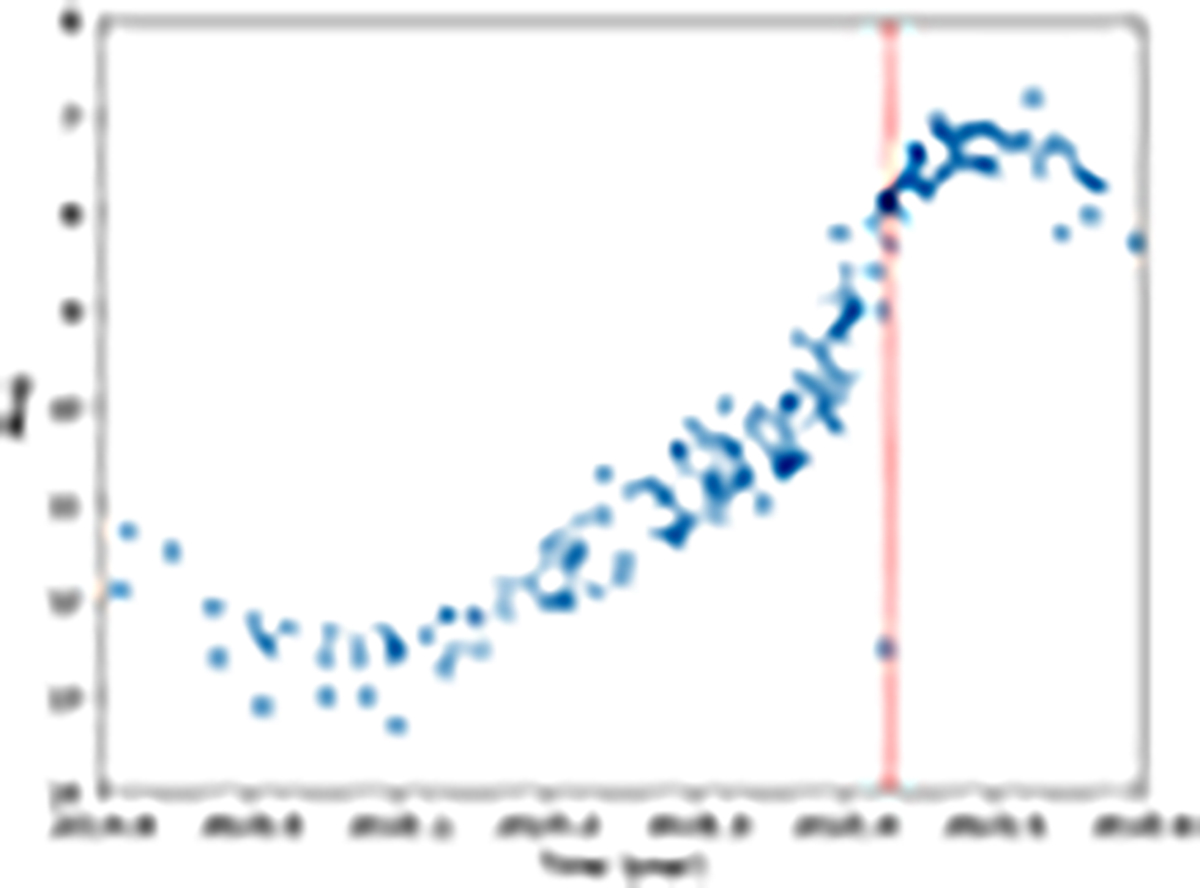
Optical light curve of R LMi (blue data points) together with scanning time in eRASS1 (red dotted vertical lines). The optical light curve was derived from visual V band observations listed in the AAVSO database.
Current usage metrics show cumulative count of Article Views (full-text article views including HTML views, PDF and ePub downloads, according to the available data) and Abstracts Views on Vision4Press platform.
Data correspond to usage on the plateform after 2015. The current usage metrics is available 48-96 hours after online publication and is updated daily on week days.
Initial download of the metrics may take a while.