Open Access
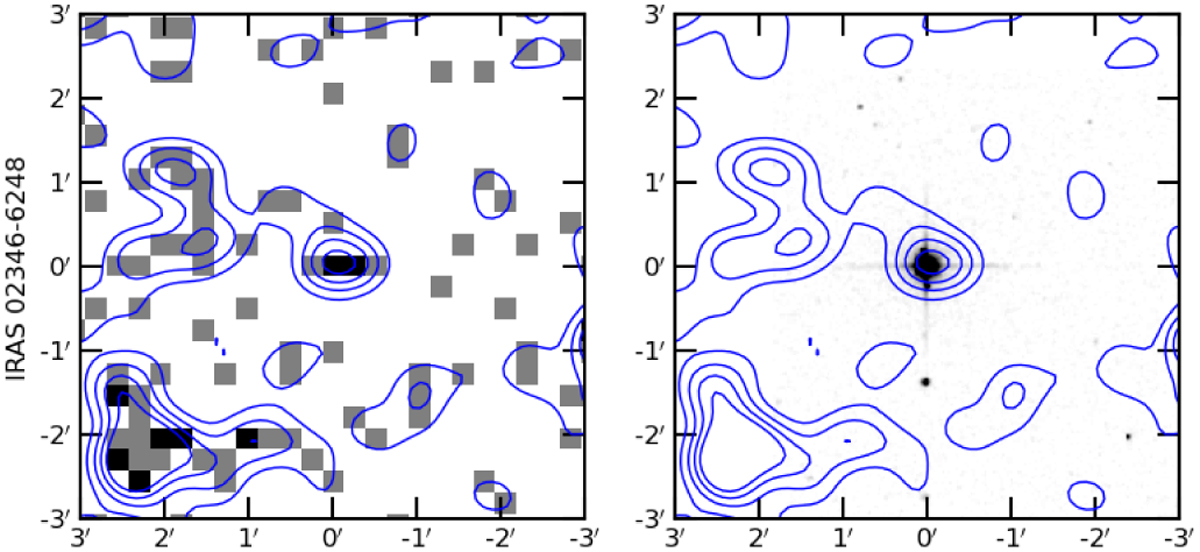
Fig. A.1
Download original image
Images of eROSITA eRASS1 0.2-2.3 keV (left) and 2MASS K (right) overlaid with X-ray contours of IRAS 02346-6248 (also known as RS Hor). The contours have been derived from a resampled and Gaussian-smoothed X-ray image with levels at 30%, 50%, 70%, and 90% of the count peak in the central 2′ × 2′ region.
Current usage metrics show cumulative count of Article Views (full-text article views including HTML views, PDF and ePub downloads, according to the available data) and Abstracts Views on Vision4Press platform.
Data correspond to usage on the plateform after 2015. The current usage metrics is available 48-96 hours after online publication and is updated daily on week days.
Initial download of the metrics may take a while.