Fig. 2
Download original image
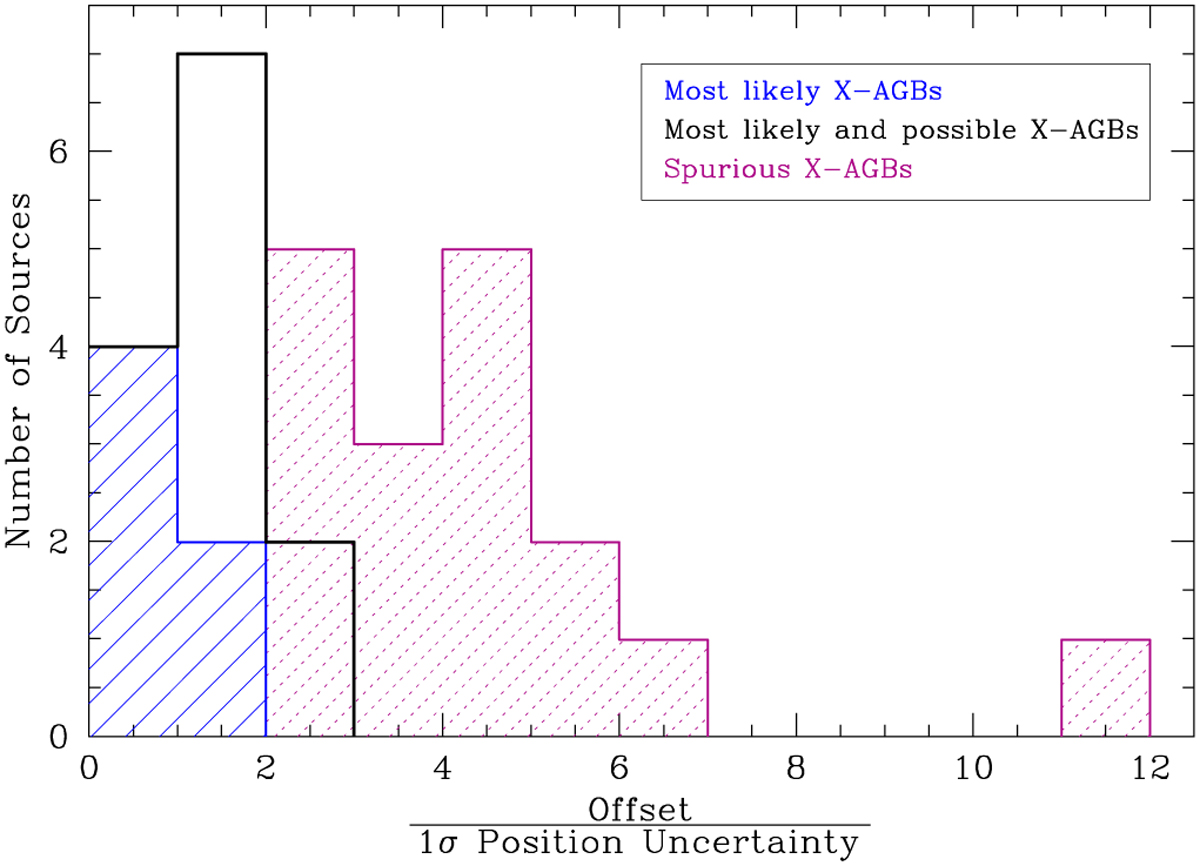
Histogram of the positional offset between an AGB star and its associated eRASS1 X-ray counterpart relative to the 1-σ positional uncertainty of the latter for most likely, possible, and spurious X-AGBs in Tables 1, 2, and D.1, respectively. The histogram of the possible X-AGBs (black histogram) was added together with that of the most likely X-AGBs (blue histogram and shade). The histogram and shade of the spurious X-AGBs are shown in purple. The spurious X-AGBs associated with diffuse X-ray sources or those superimposed on diffuse emission are not included.
Current usage metrics show cumulative count of Article Views (full-text article views including HTML views, PDF and ePub downloads, according to the available data) and Abstracts Views on Vision4Press platform.
Data correspond to usage on the plateform after 2015. The current usage metrics is available 48-96 hours after online publication and is updated daily on week days.
Initial download of the metrics may take a while.