| Issue |
A&A
Volume 699, July 2025
|
|
|---|---|---|
| Article Number | L10 | |
| Number of page(s) | 10 | |
| Section | Letters to the Editor | |
| DOI | https://doi.org/10.1051/0004-6361/202554472 | |
| Published online | 21 July 2025 | |
Letter to the Editor
Unveiling a protoplanet candidate embedded in the HD 135344B disk with VLT/ERIS
1
Università di Firenze, Dipartimento di Fisica e Astronomia, Via Giovanni Sansone 1, 50019 Sesto Fiorentino, FI, Italy
2
INAF-Osservatorio Astrofisico di Arcetri, Largo E. Fermi 5, 50125 Firenze, Italy
3
Università di Bologna, Dipartimento di Fisica e Astronomia (DIFA), Via Gobetti 93/2, 40129 Bologna, Italy
4
Dipartimento di Fisica, Università degli Studi di Milano, Milano, Italy
5
INAF-Osservatorio Astronomico di Padova, Vicolo dell’Osservatorio, 5, 35122 Padova, Italy
6
INAF – Istituto di Radioastronomia, Via Gobetti 101, I-40129 Bologna, Italy
7
Max-Planck-Institut für Astronomie, Königstuhl 17, 69117 Heidelberg, Germany
8
European Southern Observatory (ESO), Karl-Schwarzschild-Strasse 2, 85748 Garching bei Munchen, Germany
9
Instituto de Estudios Astrofísicos, Facultad de Ingeniería y Ciencias, Universidad Diego Portales, Av. Ejército 441, Santiago, Chile
10
Millennium Nucleus on Young Exoplanets and their Moons (YEMS), Santiago, Chile
⋆ Corresponding author: This email address is being protected from spambots. You need JavaScript enabled to view it.
Received:
11
March
2025
Accepted:
13
June
2025
Abstract
Context. High-angular-resolution observations in infrared and millimeter wavelengths of protoplanetary disks have revealed cavities, gaps, and spirals. One proposed mechanism to explain these structures is the dynamical perturbation caused by giant protoplanets.
Aims. The purpose of this study is to detect and characterize potential protoplanets in the HD 135344B system. The star is located at ∼136 pc, and hosts a protoplanetary disk characterized by a 40 au cavity, multiple spiral arms detected in the optical/near-infrared, and a large-scale azimuthal asymmetry at millimeter wavelengths.
Methods. We conducted deep high-contrast imaging observations using VLT/ERIS in the L′-band with the annular groove phase mask coronagraph (vortex coronagraph). Angular differential imaging with principal component analysis (ADI-PCA) was applied for the point spread function (PSF) subtraction to highlight the presence of point sources in the system.
Results. We identified the previously detected S1, S2, S2a spiral arms and the “blob” features southward of the star. Besides this, we also identified a new point source at the base of the spiral arm (S2) embedded in the inner part of the disk at a separation of ∼ 0.″21, corresponding to a projected separation of ∼28 au, and a position angle of ∼87° (west of north). The point source has a contrast of ∼3 × 10⁻³. Our multiwavelength analysis implies a planetary mass of ≳2 MJup and large dust extinction (AV ≳ 10 mag). Moreover, the L′-band flux of the candidate protoplanet and the upper limits at shorter wavelengths hint at the presence of a circumplanetary disk. Additionally, we report the detection of a previously unrecognized spiral arm located northwest of the star at a separation of ∼ 0.″77. No planets are detected in the outer disk with an upper limit of ∼600 K.
Conclusions. These results suggest a physical link between the newly identified planet candidate and the observed disk substructures, supporting the scenario of a planet-driven origin for the cavity and spirals in the HD 135344B disk.
Key words: protoplanetary disks / planet-disk interactions / stars: pre-main sequence
© The Authors 2025
 Open Access article, published by EDP Sciences, under the terms of the Creative Commons Attribution License (https://creativecommons.org/licenses/by/4.0), which permits unrestricted use, distribution, and reproduction in any medium, provided the original work is properly cited.
This article is published in open access under the Subscribe to Open model. This email address is being protected from spambots. You need JavaScript enabled to view it. to support open access publication.
1. Introduction
Understanding the morphology of protoplanetary disks is key to unveiling the mechanisms of planet formation. Transitional disks, characterized by large cavities or gaps, are often considered an intermediate evolutionary stage in which giant planet formation is actively shaping the disk structure (e.g., Lin & Papaloizou 1979; Paardekooper & Mellema 2006; Zhu et al. 2012). HD 135344B (SAO206462) is a  Myr old (Garufi et al. 2018) F8V star (Dunkin et al. 1997) located at 135.0 ± 0.4 pc from the Sun (Gaia Collaboration 2023), a well-known example of such a disk, exhibiting prominent spiral arms and a central cavity (e.g., Muto et al. 2012; Garufi et al. 2013; Stolker et al. 2016; Maire et al. 2017). The millimeter cavity of HD 135344B was first resolved with the SMA by Brown et al. (2009) and later confirmed with ALMA by Pérez et al. (2014), and by van der Marel et al. (2016a). The gas cavity, which is consistent with the presence of an embedded protoplanet, has been analyzed in detail in van der Marel et al. (2016a); van der Marel et al. (2021). Spiral arms and azimuthal asymmetries are frequently observed in transitional disks (van der Marel et al. 2021) and are commonly interpreted as signatures of planet-disk interactions (e.g., Kley & Nelson 2012; Dong et al. 2011, 2015), although alternative scenarios exist. Numerical simulations have shown that massive planets can generate these structures by inducing Rossby wave instabilities at the edges of gaps carved in the disk (e.g., Lovelace et al. 1999). This mechanism leads to the formation of azimuthal dust traps, which facilitate the accumulation of material and potentially accelerate planetesimal growth (Barge & Sommeria 1995). Observations of HD 135344B support this scenario, as a prominent asymmetry is seen atmillimeter wavelengths, colocated with the tip of one of the spiral arms, suggesting a potential connection between the asymmetry and the formation of the spirals (e.g., van der Marel et al. 2016b; Cazzoletti et al. 2018). Alternatively, these asymmetries may arise from dynamical interaction between the disk and a massive companion within the cavity (e.g., Ragusa et al. 2017). While spiral arms observed in scattered light are attributed to density waves excited by planets (e.g., Bae & Zhu 2018), alternative explanations include gravitational instability (GI) (e.g., Boss 1997; Lodato & Rice 2004), which does not require a pre-existing planet. In the case of HD 135344B, the relatively low disk mass suggests that GI is unlikely to dominate (e.g., Kama et al. 2020). According to Xie et al. (2024) both spiral arms show a rotational motion of (–0.85 ± 0.05)°/yr and they attribute this to the presence of an (unseen) companion in the gap between the ALMA-observed ring and the asymmetry south of the star, at approximately 66 ± 3 au. In addition, the presence of dark lanes observed in polarimetric imaging could indicate shadowing effects, although the underlying cause, such as inner disk misalignment or warping, remains speculative (Stolker et al. 2016). Previous high-contrast imaging (HCI) observations in the near-infrared (NIR) have searched for planetary companions in the system. However, observations with VLT/SPHERE in the NIR (Maire et al. 2017) and Keck/NIRC2 in the L′ band (Wallack et al. 2024) have resulted in non-detections so far. Considering the observational evidence presented above, as well as statistical arguments (Ragusa et al. 2025), it is likely that there is an unobserved companion inside the cavity.
In this study, we present new observations of HD 135344B obtained with ERIS/NIX in the L′ band, revealing a candidate within the disk cavity. We analyze its properties and investigate its role in shaping the surrounding disk structures.
2. Observations and data reduction
HD 135344B was observed using the Enhanced Resolution Imager and Spectrograph (ERIS) (Davies et al. 2023) of the Very Large Telescope (VLT) during the night of April 18–19 2024 (ID: 113.26B2.001), using the L′ filter (λc = 3.96 μm, FWHM = 0.60 μm) and the annular groove phase mask (vortex) coronagraph (Orban de Xivry et al. 2024). The performance of ERIS for natural guide star targets with R magnitudes between 8 and 10 achieves Strehl ratios above 0.8 in the Ks band (Riccardi et al. 2022). We took all science frames and sky backgrounds using the sensor sub-portion window 3. The seeing (from the Differential Image Motion Monitor) remained consistently below  , with an average of
  throughout the observations. The mean coherence time was 9.5 ms and the mean wind speed was 2.12 m/s. The total field of view rotation during the data acquisition was 58°. We measured the thermal background with a high cadence by performing an ABAB sequence. The observations were structured as 26 exposures of 900 frames for the target and 26 exposures of 150 frames, both with an integration time of 0.2s. To conclude, 100 frames of 0.02s were taken with the star offset from the coronagraph to obtain a reference point spread function (PSF). At the beginning and end of the observation block, an off-axis image of the stellar PSF was acquired as a calibration for photometry and contrast estimates. We acquired dark frames on the same night, matching the window and exposure times of the science frames, and flats during twilight on April 6, 2024, using the L′ filter in full-frame mode. The corresponding dark frames for the flats were taken on the same night.
We performed a standard data reduction procedure that involves dark subtraction, flat fielding, bad pixel correction, and background subtraction. Further details are given in Maio et al. (2025). A complete description of the technique used for sky-object alignment is explained in Appendix A. We discarded a variable number of initial frames in each exposure because the star was not correctly centered behind the coronagraph and because the AO loop was opened, due, for example, to poor seeing conditions.
To identify and remove unsuitable frames, we first computed the median of the entire cube, as the majority of frames contain the star correctly positioned behind the coronagraph. This median image was subtracted from each individual frame to highlight deviations. We then estimated the total flux in each frame, using it as a metric: frames in which the star is correctly behind the coronagraph show a low flux, while frames with the star out of position exhibit a higher flux. Next, we calculated the median flux of the last 400 frames and determined the median absolute deviation (MAD). Frames with flux values within 5 MADs from the median were selected and saved into a new, cleaned cube, following the method outlined in Maio et al. (2025). Finally, we aligned all frames by fitting the visible ring of the PSF around the coronagraph mask. Additionally, an independent alternative method was employed to confirm the results, consisting of a Gaussian fit of the thermal emission from the coronagraph mask visible in the sky frames. This alternative method correlates the mask’s center position with three spots used for sky-object alignment, as is described in Appendix A. Once the relative position is determined, it can be identified in the sky frames and used as a rotation point for ADI. Both methods yielded consistent results within one pixel precision required for the analysis. To subtract the residual speckles of the stellar PSF, we applied angular differential imaging (e.g., Marois et al. 2006) with principal component analysis (ADI-PCA) with the routine available in the Vortex Image Processing package (VIP)1 (Gomez Gonzalez et al. 2017; Christiaens et al. 2023). An additional analysis was performed to deproject the disk into polar coordinates, allowing for a more detailed study of the spiral structures within the disk.
To estimate the optimal number of principal components (PCs) for subtraction, PSF-subtracted images were generated by subtracting from 1 to 10 PCs. For the analysis, we worked with four subtracted PCs (although five PCs gave comparable results). Once the final image was obtained, a correction of 5° was applied to the true position of the north, as is described in the ERISManual2.
3. Analysis
The analysis of the ADI-PCA result revealed the prominent southwestern spiral (S1) and the bifurcated eastern spiral (S2 and S2a), both of which are well known in the literature. The result is shown in Figure 1. Additionally, we observed a previously unrecognized spiral arm; its description is presented in detail in Appendix B. We detected a candidate in the inner part of the disk at a separation of  and a position angle (PA) of ∼87° W of N, with an estimated contrast of ∼3 × 10⁻³ (Figure 2). The estimated linear distance assuming a face-on orbit between the central star and the candidate is (28.4 ± 5.4) au. The analysis was performed using the point source recovery routine in VIP, which showed that the subtraction of a fake planet completely removed the source, indicating its point-like nature and ruling out any extended structure (Figure 2). To confirm that the candidate HD135344B b is not an extended disk feature, we also analyzed a previously identified source: the “blob” at a PA of ∼200° and a distance of
  , which is described as approximately point-like (Maire et al. 2017). The PSF subtraction, and thus the removal of a point source, did not completely remove the source, highlighting the extended nature of the blob, as can be seen in Figure 2.
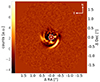 |
Fig. 1. Result of the ADI-PCA of HD 135344B with ERIS in the L′ band, post-processing with the subtraction of four principal components. The central dashed circle with a radius of |

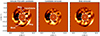 |
Fig. 2. Result of the point-source recovery function of VIP. Left: Output of the annular PCA analysis of the original dataset. Center: As in the left panel but with the point-source signal subtracted. The process completely eliminates point sources and negative wings, without any serious effects. Right: As in the left panel but with the blob signal subtracted. The process does not remove the signal, leaving residues and generating positive artifacts. |
To quantify the properties of the detected candidate, we estimated its brightness and physical characteristics. From the measured contrast of HD 135344B b the effective temperature of a photosphere with radius 2RJ is approximately 2500 K, assuming no local extinction. These characteristics point to either a high-mass planet (> 7MJ) or a sub-brown dwarf. However, the brown dwarf scenario is at odds with the existence of an inner dust ring described by (e.g. Fedele et al. 2008; Stolker et al. 2016). Such a massive companion would have cleared the dust cavity completely (Zhu et al. 2011). An alternative explanation for the high observed flux is the presence of a circumplanetary disk (CPD) or envelope, which, with sufficient accretion, can exceed the planet’s intrinsic luminosity (Taylor & Adams 2025). This is consistent with the results of van der Marel et al. (2016a), which predict a 2MJ planet at 30 au from the star to account for the gas and dust cavity in this system. A detailed discussion of the expected CPD emission in relation to the SPHERE upper limits in the J and K bands is given in Appendix C. The inferred location of ∼28 au of HD 135344B b aligns well with the expected position of a planetary perturber from planet-disk interaction models, based on the spiral arms seen in NIR observations (Stolker et al. 2016). Future high-resolution observations in the mid-infrared could reveal additional observational signatures of the CPD.
The analysis of the ADI-PCA image did not reveal any sources or structures beyond  from the central star. Polar deprojection (Figure 3) of the disk was performed using the inclination of
  and PA of
  (Casassus et al. 2021). Since the disk is almost face-on, we did not take into account the geometric distortion resulting from disk flaring. In Figure 3, the two spiral arms and the candidate companion are visible. The shadow, marked by the arrow, is also evident, along with a fully shadowed region highlighted by the horizontal solid line. This visualization of the shadows further confirms the extended nature of the blob south of the star and highlights that it is part of the S2 spiral interrupted by the shadow.
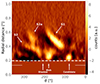 |
Fig. 3. Polar de-projection of the ADI-PCA result. The position of the disk structures and point source candidate are highlighted with arrows. The horizontal solid line at 0 |

The contrast curve is a key tool for assessing the quality of observations, providing a quantitative measure of the instrument’s sensitivity to faint sources at different angular separations. We used the Python package AppleFy3 (Bonse et al. 2023) to generate the 5σ curve, by combining contrast curves from 2 to 10 subtracted PCs (see Figure 4), and we employed the calculated values to estimate detection limits in terms of black-body temperatures (e.g., Cugno et al. 2023; Maio et al. 2025). The contrast curve also sets an upper limit on the relative brightness of potential external companions to the disk. In the second step, we translated the contrast into a temperature estimate, which provides a more intuitive physical interpretation. While both quantities are model-dependent, the temperature estimate relies on fewer assumptions. We have chosen not to use mass estimates due to their strong dependence on model assumptions, including cooling curves, coeval star-planet formation, planetary atmosphere composition, local disk extinction, and potential flux excesses from recombination lines related to accretion or CPDs. The temperature limit was achieved using a double blackbody model (stellar photosphere and planet photosphere), which is described by Cugno et al. (2023) and Maio et al. (2025). By analyzing the contrast curve in Figure 4, it is possible to establish an upper limit for the contrast of potential external companions beyond  at 1.2 × 10⁻⁵, which translates to a limit of ∼570 K for a radius of 2 RJ. We also used BEX models (Linder et al. 2019) as in the work of Cugno et al. (2024) and got an upper mass limit of 2.5 − 5MJ. This estimate is model-dependent and should be interpreted with caution.
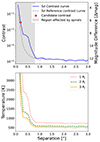 |
Fig. 4. Top panel: Contrast achieved for HD 135344B (blue line) and for a reference isolated single star (dashed gray) with similar field rotation (i Vel, from ERIS manual). The gray region highlights the region contaminated by spirals. Bottom panel: Detection curves in terms of temperature computed for different photospheric radii. |
4. Discussion
The disk resolved at millimeter wavelengths with ALMA by Cazzoletti et al. (2018) revealed the presence of a ring at  radius, corresponding to approximately 40 au from the star, along with an asymmetry further out toward the south. This feature appears to coincide with the tip of the spiral arm S1, as observed in scattered light (van der Marel et al. 2016a). The inner cavity detected by ALMA, in gas and millimeter-dust, provides strong evidence of the presence of a planetary perturber. While millimeter-dust cavities can result from a variety of mechanisms, the presence of a gas cavity is a more robust indicator of a massive planet. Notably, its dimension is consistent with the position of HD 135344B b detected in this study (Figure 5). This supports the hypothesis that the planet is actively shaping the disk structure, which has been predicted by models of planet-disk interaction (e.g., Toci et al. 2020).
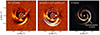 |
Fig. 5. Left panel: Zoom of Figure 1 with the candidate highlighted. Center panel: Comparison of the ERIS image (left panel) with ALMA Band 4 observations by Cazzoletti et al. (2018). Right panel: Latest analysis of the Maire et al. (2017) data by Flasseur et al. (2024), in which the candidate’s position was indicated if it were on a circular orbit seen face-on. |
The interaction between the protoplanet and the disk can be further analyzed in the context of the observed spirals. The connection between the planet and the spiral structure is suggested by hydrodynamical simulations (e.g., Dong et al. 2015; Veronesi et al. 2019), which predict that planets can launch large-scale spiral arms. The proximity of HD 135344B b to the expected location of a planetary perturber based on the morphology of the spirals (Stolker et al. 2016) supports the scenario in which the detected planet is the primary driver of these features. Additionally, the analysis of the inner part of the S2 spiral arm carried out by Flasseur et al. (2024) reveals that the inner part of S2 is truncated near the expected position of the ERIS candidate, further supporting the hypothesis of a planet-disk interaction.
The possibility of additional external companions has been suggested in previous studies. Cugno et al. (2024) reported the detection of a potential sub-Jupiter candidate (CC1) with JWST at a separation of approximately  and a PA of 303.5°. However, this companion is unlikely to be responsible for the formation of the observed spirals (Cugno et al. 2024). Similarly, Xie et al. (2024) predict the presence of another external companion, which has not been detected by Cugno et al. (2024). The consistency of the inferred detection with millimeter dust cavity was further explored using DBNets2.0 (Ruzza et al. 2025). This tool leverages machine learning and simulation-based inference techniques to efficiently explore a large parameter space and identify the planet-disk configuration that could best reproduce the observed dust substructures. For a planet at 28 au, this analysis determines a mass of
  . The detailed results are reported in Appendix D.
Wallack et al. (2024) presented L′ HCI observations of HD 135344B, but they did not detect any point sources. We propose that this non-detection is likely due to the limited field rotation during the NIRC2 observations, which spanned only 23°. When we restricted our dataset to a comparable rotation range, we were similarly unable to recover HD 135344B b, suggesting that self-subtraction effects may have removed any trace of the potential companion within  . A more detailed analysis is presented in Appendix E.
Overall, our observations, combined with previous studies, suggest that the observed disk features, particularly the inner cavity and spiral arms, are best explained by the presence of an internal planetary perturber. The lack of massive external perturbers, as is indicated by both ground-based and space-based observations, further supports this interpretation.
5. Conclusion
In this study, we report the detection of a candidate embedded protoplanet in the HD 135344B disk, with an estimated contrast of ∼3 × 10⁻³ and a projected separation of ∼28 au from the host star at the root of one of the disk’s spiral arms (S2). HD 135344B b is in the region where previous studies have suggested the presence of a planetary perturber responsible for the excitation of such spirals (e.g., Dong et al. 2015; Zhu et al. 2015). The multiwavelength analysis and the comparison to interpolated models with machine learning suggest a planetary mass of nearly 2MJ and high local dust extinction (AV ≳ 20 mag). The high L′-band flux could be indicative of a CPD if the companion is indeed planetary in nature. Alternatively, if the object is more massive, it could be a brown dwarf rather than a planet. The location of HD 135344B b is consistent with the ALMA-detected gas cavity, suggesting that the candidate protoplanet plays a role in clearing material from the inner part of the disk (van der Marel et al. 2016b).
Acknowledgments
We gratefully acknowledge support from the “Programma di Ricerca Fondamentale INAF 2022 and 2023” of the Italian National Institute of Astrophysics (INAF GO/GTO grant 2022 “ERIS & SHARK GTO data exploitation” and INAF Large Grant 2023 “NextSTEPS”). We also acknowledge the valuable contributions of Valentin Christiaens, Felix Dannert, Markus Bonse, Orban De Xivry Gilles, Hayoz Jean, and Absil Olivier. V.R. and L.T. acknowledges the support of the European Union’s Horizon 2020 research and innovation program and the European Research Council via the ERC Synergy Grant “ECOGAL” (project ID 855130). A.Z. acknowledges support from ANID – Millennium Science Initiative Program – Center Code NCN2024_001. SF is funded by the European Union (ERC, UNVEIL, 101076613), and acknowledges financial contribution from PRIN-MUR 2022YP5ACE. The project was carried out thanks to the contribution of Fondazione Cassa di Risparmio di Firenze, as part of the “Ricercatori a Firenze 2023” grant. We are grateful to the anonymous referee for his/her valuable report and suggestions.
References
- Bae, J., & Zhu, Z. 2018, ApJ, 859, 118 [Google Scholar]
- Barge, P., & Sommeria, J. 1995, A&A, 295, L1 [NASA ADS] [Google Scholar]
- Bonse, M. J., Garvin, E. O., Gebhard, T. D., et al. 2023, AJ, 166, 71 [NASA ADS] [CrossRef] [Google Scholar]
- Boss, A. P. 1997, Science, 276, 1836 [Google Scholar]
- Brown, J. M., Blake, G. A., Qi, C., et al. 2009, ApJ, 704, 496 [Google Scholar]
- Casassus, S., Christiaens, V., Cárcamo, M., et al. 2021, MNRAS, 507, 3789 [CrossRef] [Google Scholar]
- Cazzoletti, P., van Dishoeck, E. F., Pinilla, P., et al. 2018, A&A, 619, A161 [NASA ADS] [CrossRef] [EDP Sciences] [Google Scholar]
- Christiaens, V., Gonzalez, C., Farkas, R., et al. 2023, J. Open Source Softw., 8, 4774 [NASA ADS] [CrossRef] [Google Scholar]
- Cugno, G., Pearce, T. D., Launhardt, R., et al. 2023, A&A, 669, A145 [NASA ADS] [CrossRef] [EDP Sciences] [Google Scholar]
- Cugno, G., Leisenring, J., Wagner, K. R., et al. 2024, AJ, 167, 182 [NASA ADS] [CrossRef] [Google Scholar]
- Davies, R., Absil, O., Agapito, G., et al. 2023, A&A, 674, A207 [NASA ADS] [CrossRef] [EDP Sciences] [Google Scholar]
- Dong, R., Rafikov, R. R., & Stone, J. M. 2011, ApJ, 741, 57 [Google Scholar]
- Dong, R., Zhu, Z., Rafikov, R. R., & Stone, J. M. 2015, ApJ, 809, L5 [Google Scholar]
- Dunkin, S. K., Barlow, M. J., & Ryan, S. G. 1997, MNRAS, 290, 165 [Google Scholar]
- Fedele, D., van den Ancker, M. E., Acke, B., et al. 2008, A&A, 491, 809 [NASA ADS] [CrossRef] [EDP Sciences] [Google Scholar]
- Flasseur, O., Denis, L., Thiébaut, É., & Langlois, M. 2024, MNRAS, 535, 689 [Google Scholar]
- Gaia Collaboration (Vallenari, A., et al.) 2023, A&A, 674, A1 [NASA ADS] [CrossRef] [EDP Sciences] [Google Scholar]
- Garufi, A., Quanz, S. P., Avenhaus, H., et al. 2013, A&A, 560, A105 [CrossRef] [EDP Sciences] [Google Scholar]
- Garufi, A., Benisty, M., Pinilla, P., et al. 2018, A&A, 620, A94 [NASA ADS] [CrossRef] [EDP Sciences] [Google Scholar]
- Gomez Gonzalez, C. A., Wertz, O., Absil, O., et al. 2017, AJ, 154, 7 [Google Scholar]
- Gordon, K. 2024, J. Open Source Softw., 9, 7023 [NASA ADS] [CrossRef] [Google Scholar]
- Kama, M., Trapman, L., Fedele, D., et al. 2020, A&A, 634, A88 [NASA ADS] [CrossRef] [EDP Sciences] [Google Scholar]
- Kley, W., & Nelson, R. P. 2012, ARA&A, 50, 211 [Google Scholar]
- Lin, D. N. C., & Papaloizou, J. 1979, MNRAS, 188, 191 [Google Scholar]
- Linder, E. F., Mordasini, C., Mollière, P., et al. 2019, A&A, 623, A85 [NASA ADS] [CrossRef] [EDP Sciences] [Google Scholar]
- Lodato, G., & Rice, W. K. M. 2004, MNRAS, 351, 630 [Google Scholar]
- Lovelace, R. V. E., Li, H., Colgate, S. A., & Nelson, A. F. 1999, ApJ, 513, 805 [NASA ADS] [CrossRef] [Google Scholar]
- Maio, F., Roccatagliata, V., Fedele, D., et al. 2025, A&A, 698, A52 [NASA ADS] [CrossRef] [EDP Sciences] [Google Scholar]
- Maire, A. L., Stolker, T., Messina, S., et al. 2017, A&A, 601, A134 [NASA ADS] [CrossRef] [EDP Sciences] [Google Scholar]
- Marois, C., Lafrenière, D., Doyon, R., Macintosh, B., & Nadeau, D. 2006, ApJ, 641, 556 [Google Scholar]
- Müller, A., van den Ancker, M. E., Launhardt, R., et al. 2011, A&A, 530, A85 [NASA ADS] [CrossRef] [EDP Sciences] [Google Scholar]
- Muto, T., Grady, C. A., Hashimoto, J., et al. 2012, ApJ, 748, L22 [Google Scholar]
- Orban de Xivry, G., Absil, O., De Rosa, R. J., et al. 2024, in Adaptive Optics Systems IX, eds. K. J. Jackson, D. Schmidt, & E. Vernet, Society of Photo-Optical Instrumentation Engineers (SPIE) Conference Series, 13097, 1309715 [Google Scholar]
- Paardekooper, S. J., & Mellema, G. 2006, A&A, 459, L17 [CrossRef] [EDP Sciences] [Google Scholar]
- Pérez, L. M., Isella, A., Carpenter, J. M., & Chandler, C. J. 2014, ApJ, 783, L13 [Google Scholar]
- Ragusa, E., Dipierro, G., Lodato, G., Laibe, G., & Price, D. J. 2017, MNRAS, 464, 1449 [Google Scholar]
- Ragusa, E., Lodato, G., Cuello, N., et al. 2025, A&A, 698, A102 [NASA ADS] [CrossRef] [EDP Sciences] [Google Scholar]
- Riccardi, A., Puglisi, A., Grani, P., et al. 2022, in Adaptive Optics Systems VIII, eds. L. Schreiber, D. Schmidt, & E. Vernet, Society of Photo-Optical Instrumentation Engineers (SPIE) Conference Series, 12185, 1218508 [Google Scholar]
- Ruzza, A., Lodato, G., & Rosotti, G. P. 2024, A&A, 685, A65 [NASA ADS] [CrossRef] [EDP Sciences] [Google Scholar]
- Ruzza, A., Lodato, G., Rosotti, G. P., & Armitage, P. J. 2025, A&A, submitted [arXiv:2506.11200] [Google Scholar]
- Stolker, T., Dominik, C., Avenhaus, H., et al. 2016, A&A, 595, A113 [NASA ADS] [CrossRef] [EDP Sciences] [Google Scholar]
- Taylor, A. G., & Adams, F. C. 2025, Icarus, 425, 116327 [Google Scholar]
- Toci, C., Lodato, G., Christiaens, V., et al. 2020, MNRAS, 499, 2015 [NASA ADS] [CrossRef] [Google Scholar]
- van der Marel, N., van Dishoeck, E. F., Bruderer, S., et al. 2016a, A&A, 585, A58 [NASA ADS] [CrossRef] [EDP Sciences] [Google Scholar]
- van der Marel, N., Cazzoletti, P., Pinilla, P., & Garufi, A. 2016b, ApJ, 832, 178 [Google Scholar]
- van der Marel, N., Birnstiel, T., Garufi, A., et al. 2021, AJ, 161, 33 [Google Scholar]
- Veronesi, B., Lodato, G., Dipierro, G., et al. 2019, MNRAS, 489, 3758 [Google Scholar]
- Wallack, N. L., Ruffio, J.-B., Ruane, G., et al. 2024, AJ, 168, 78 [Google Scholar]
- Xie, C., Xie, C., Ren, B. B., et al. 2024, Universe, 10, 465 [Google Scholar]
- Zhu, Z., Nelson, R. P., Hartmann, L., Espaillat, C., & Calvet, N. 2011, ApJ, 729, 47 [NASA ADS] [CrossRef] [Google Scholar]
- Zhu, Z., Nelson, R. P., Dong, R., Espaillat, C., & Hartmann, L. 2012, ApJ, 755, 6 [Google Scholar]
- Zhu, Z., Dong, R., Stone, J. M., & Rafikov, R. R. 2015, ApJ, 813, 88 [Google Scholar]
Appendix A: Sky-object alignment
A preliminary analysis of the sky frames revealed several scattered spots across the entire field of view in addition to the thermal glow from the vortex mask, as visible in Figure A.1. These spots are caused by dust grains on the coronagraph. By tracking the position of these dust grains and the mask glow, we observed a steady drift in their positions from one frame to the next in all exposures. Therefore, it was necessary to align all frames before performing the sky-object subtraction. For this purpose, we selected three isolated and bright spots at different locations in the field. A Gaussian fit was applied to each spot to estimate their positions with sub-pixel accuracy in each frame. The mean positional shift of the three spots was then computed, and we translated the images accordingly to align them.
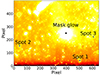 |
Fig. A.1. Example of the sky frame, the white dots are dust spots on the mask. The three of them highlighted are the spots used for the image alignment. |
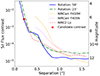 |
Fig. A.2. Comparison between the total contrast curve of our observations (in blue) and the one with the reduced rotation angle (in green). The red dot is the measured contrast of the candidate. The red dashed curve represents the contrast curve from Wallack et al. (2024), which does not show the bump of arm S1 around |

Appendix B: Results for the S3 structure
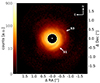 |
Fig. B.1. Result of the image stacking. The spiral’s position is highlighted. The central dashed circle has a radius of |

Figure B.1 presents the final stacked image after the alignment of all frames. In addition to the well-known S1 spiral to the southwest, our analysis reveals a newly identified structure northwest of the star, labeled as S3. This feature appears to extend from the previously detected S2 spiral, as reported by Flasseur et al. (2024).
The detection of S3 is qualitatively consistent with theoretical models predicting the formation of multi-arm spiral structures induced by embedded protoplanets (e.g., Veronesi et al. 2019). However, the position of S3 does not match the fitted spiral structures proposed by Stolker et al. (2016), which were used to infer the presence of external planets. This discrepancy suggests that S3 may have a different origin or that the external planetary influence on the spiral morphology is more complex than previously assumed.
Further observations and modeling are required to determine whether S3 is dynamically linked to the other spiral arms or if it represents a distinct morphological feature of the disk. Future HCI and gas kinematics analysis (like exoALMA) will be crucial to understanding the nature of this structure and its potential connection to planetary formation processes.
Appendix C: Impact of a circumplanetary disk on contrast estimates
To provide a physical interpretation of the observed contrast, we used the upper limits on detection at the candidate’s location in the H, K1, and K2 bands, derived from the contrast curves of Maire et al. (2017).
We compared these data with a contrast model assuming the star as a black body with a temperature of 6810 ± 80 K and radius of 1.40 ± 0.25 R⊙ (Müller et al. 2011). The planet was also modeled as an ideal black body with variable temperature and radius, specified for four cases in Figure C.1. The flux emitted by the star and the planet follows the standard Planck law for black body radiation. The specific flux per unit frequency isgiven by
 (C.1)
(C.1)
 (C.2)
(C.2)
where Bν(T) is the Planck function, Tstar and Tplanet are the effective temperatures of the star and the planet, Rstar and Rplanet are their respective radii, and d is the distance to the system. The contrast at a given frequency is then computed as
 (C.3)
(C.3)
where Cν represents the flux ratio between the planet and the star. This approach is consistent with previous works, such as Cugno et al. (2023), Maio et al. (2025). To better fit the observed contrast and the SPHERE upper limits, we included a CPD, following the description in Taylor & Adams (2025). The disk was modeled as a geometrically thin structure, where the radial temperature profile follows a power law:
 (C.4)
(C.4)
where T0 is the temperature at the reference radius R0, and q is the exponent governing the radial dependence. The value of T0 was taken from Taylor & Adams (2025), with specific values for different accretion rates. In the case shown in Figure C.1, T0 = 1020 K corresponds to an accretion rate of 3 MJ/Myr, while T0 = 700 K corresponds to an accretion rate of 1 MJ/Myr.
The total flux emitted by the disk was computed by integrating the Planck function over the disk surface:
 (C.5)
(C.5)
where Rin = 5RJ and Rout = 50RJ define the inner and outer radii of the disk. The CPD was assumed face-on. The total flux of the system is then given by the sum of the planet and disk fluxes:
 (C.6)
(C.6)
before computing the final contrast with respect to the stellar flux.
To account for the local extinction due to the circumplanetary material, we applied an extinction correction using the Dust Extinction package (Gordon 2024). The extinction was modeled with a standard interstellar law, assuming a total-to-selective extinction ratio of RV = 3.1 and extinction values of AV = 10, 20, 30 mag.
The results shown in Figure C.1 indicate that the best model to describe the observations corresponds to a planet with a radius of Rp = 2.2RJ, an effective temperature of Tp = 1600 K, and an accreting CPD with a reference temperature of T0 = 1020 K.
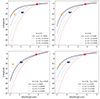 |
Fig. C.1. Spectral energy distributions expressed as differential magnitudes (Δ Magnitude) as a function of wavelength (in μm) for different planetary radii and temperatures. The black solid line represents the case with no extinction (AV = 0), while dashed blue, dotted green and dash-dotted red lines correspond to increasing extinction values (AV = 10, 20, 30) with progressively higher planetary temperatures (TP). The orange, green and blue leftward triangles indicate the upper limit by (Maire et al. 2017) in H, K1 and K2 bands. The red point indicates the contrast observed in this study. Each panel corresponds to a specific planetary radius: Top left:RP = 2.2RJ, Top right:RP = 3.5RJ, Bottom left:RP = 2.2RJ with a CPD contribution (TCPD), and Bottom right:RP = 3.5RJ with a CPD contribution. |
Appendix D: Substructure analysis with DBNets2.0
We present in Fig. D.1 the outcome of DBNets2.0 (Ruzza et al. 2025, new version of Ruzza et al. 2024) analysis performed on an ALMA band 6 dust continuum observation of the HD135344B disc (Casassus et al. 2021, ALMA data: ADS/JAO.ALMA#2018.1.01066.S). Assuming the presence of a planet at a given location, the tool infers a posterior distribution for the disc α-viscosity (α), aspect ratio at the planet location (h0), dust Stokes number (St) and planet mass (Mp). DBNets2.0 performs the analysis through machine learning methods trained on hydrodynamical simulations of viscously accreting discs with one embedded planet, constant α-viscosity and constant dust Stokes number over the entire disc. These are then post-processed into synthetic observations. The results represent the best fit of the simulated model to the observed substructures. We used the geometrical properties to deproject the disc and set the planet location at 28 au consistently with the candidate protoplanet. The corner plot in Fig. D.1 shows the inferred posterior distribution for the target properties. The axis limits are chosen to match the parameter space where DBNets2.0 was trained. Best estimates are reported for each property over the respective histogram and correspond to the medians of the distributions. Uncertainties are defined by the 16th and 84th percentiles.
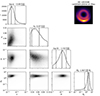 |
Fig. D.1. Results of the analysis of HD135344B dust substructures performed with DBNets2.0 (Ruzza et al. 2025). The plot is constructed sampling 5 ⋅ 105 points from the inferred posterior distribution for the four target disc and planet properties. Axis limits correspond to the region of the parameter space where DBNets2.0 was trained. The solid vertical lines in the histograms mark the medians of the respective distributions while the dashed lines mark the 16th and 84th percentiles when these are within the plotted intervals. The deprojected ALMA Band 6 dust continuum observation (ADS/JAO.ALMA#2018.1.01066.S, Casassus et al. 2021) used for this analysis is shown in the upper right corner. |
Appendix E: ERIS and NIRC2 data
For a homogeneous comparison between our observations and those obtained with NIRC2 by Wallack et al. (2024), we independently analyzed both our full dataset, with a total field rotation of 58°, and a subset limited to 23° of rotation. This approach was necessary since the NIRC2 observations exhibit only 23° of total field rotation. No candidate was identified in the Wallack et al. (2024) dataset, which can be explained by self-subtraction effects at small radial separations when field rotation is insufficient. This effect is evident in the comparison shown in Figure E.1.
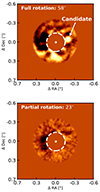 |
Fig. E.1. Upper panel: Full dataset annular PCA with a 58° rotation Lower panel: Dataset restricted to a 23° field rotation. In the second case, the self-subtraction has almost completely removed the candidate. The central dashed circle as in Figure 1. |
The contrast curves comparison in Figure A.2 reveal an interesting result. The curve derived from the first 23° of rotation (in green) reaches a lower contrast plateau at large separations compared to the full dataset (in blue). Nevertheless, the difference in recovered flux is visible in Figure E.1.
All Figures
|
Fig. 1. Result of the ADI-PCA of HD 135344B with ERIS in the L′ band, post-processing with the subtraction of four principal components. The central dashed circle with a radius of |
| In the text | |
|
Fig. 2. Result of the point-source recovery function of VIP. Left: Output of the annular PCA analysis of the original dataset. Center: As in the left panel but with the point-source signal subtracted. The process completely eliminates point sources and negative wings, without any serious effects. Right: As in the left panel but with the blob signal subtracted. The process does not remove the signal, leaving residues and generating positive artifacts. |
| In the text | |
|
Fig. 3. Polar de-projection of the ADI-PCA result. The position of the disk structures and point source candidate are highlighted with arrows. The horizontal solid line at 0 |
| In the text | |
|
Fig. 4. Top panel: Contrast achieved for HD 135344B (blue line) and for a reference isolated single star (dashed gray) with similar field rotation (i Vel, from ERIS manual). The gray region highlights the region contaminated by spirals. Bottom panel: Detection curves in terms of temperature computed for different photospheric radii. |
| In the text | |
|
Fig. 5. Left panel: Zoom of Figure 1 with the candidate highlighted. Center panel: Comparison of the ERIS image (left panel) with ALMA Band 4 observations by Cazzoletti et al. (2018). Right panel: Latest analysis of the Maire et al. (2017) data by Flasseur et al. (2024), in which the candidate’s position was indicated if it were on a circular orbit seen face-on. |
| In the text | |
|
Fig. A.1. Example of the sky frame, the white dots are dust spots on the mask. The three of them highlighted are the spots used for the image alignment. |
| In the text | |
|
Fig. A.2. Comparison between the total contrast curve of our observations (in blue) and the one with the reduced rotation angle (in green). The red dot is the measured contrast of the candidate. The red dashed curve represents the contrast curve from Wallack et al. (2024), which does not show the bump of arm S1 around |
| In the text | |
|
Fig. B.1. Result of the image stacking. The spiral’s position is highlighted. The central dashed circle has a radius of |
| In the text | |
|
Fig. C.1. Spectral energy distributions expressed as differential magnitudes (Δ Magnitude) as a function of wavelength (in μm) for different planetary radii and temperatures. The black solid line represents the case with no extinction (AV = 0), while dashed blue, dotted green and dash-dotted red lines correspond to increasing extinction values (AV = 10, 20, 30) with progressively higher planetary temperatures (TP). The orange, green and blue leftward triangles indicate the upper limit by (Maire et al. 2017) in H, K1 and K2 bands. The red point indicates the contrast observed in this study. Each panel corresponds to a specific planetary radius: Top left:RP = 2.2RJ, Top right:RP = 3.5RJ, Bottom left:RP = 2.2RJ with a CPD contribution (TCPD), and Bottom right:RP = 3.5RJ with a CPD contribution. |
| In the text | |
|
Fig. D.1. Results of the analysis of HD135344B dust substructures performed with DBNets2.0 (Ruzza et al. 2025). The plot is constructed sampling 5 ⋅ 105 points from the inferred posterior distribution for the four target disc and planet properties. Axis limits correspond to the region of the parameter space where DBNets2.0 was trained. The solid vertical lines in the histograms mark the medians of the respective distributions while the dashed lines mark the 16th and 84th percentiles when these are within the plotted intervals. The deprojected ALMA Band 6 dust continuum observation (ADS/JAO.ALMA#2018.1.01066.S, Casassus et al. 2021) used for this analysis is shown in the upper right corner. |
| In the text | |
|
Fig. E.1. Upper panel: Full dataset annular PCA with a 58° rotation Lower panel: Dataset restricted to a 23° field rotation. In the second case, the self-subtraction has almost completely removed the candidate. The central dashed circle as in Figure 1. |
| In the text | |
Current usage metrics show cumulative count of Article Views (full-text article views including HTML views, PDF and ePub downloads, according to the available data) and Abstracts Views on Vision4Press platform.
Data correspond to usage on the plateform after 2015. The current usage metrics is available 48-96 hours after online publication and is updated daily on week days.
Initial download of the metrics may take a while.