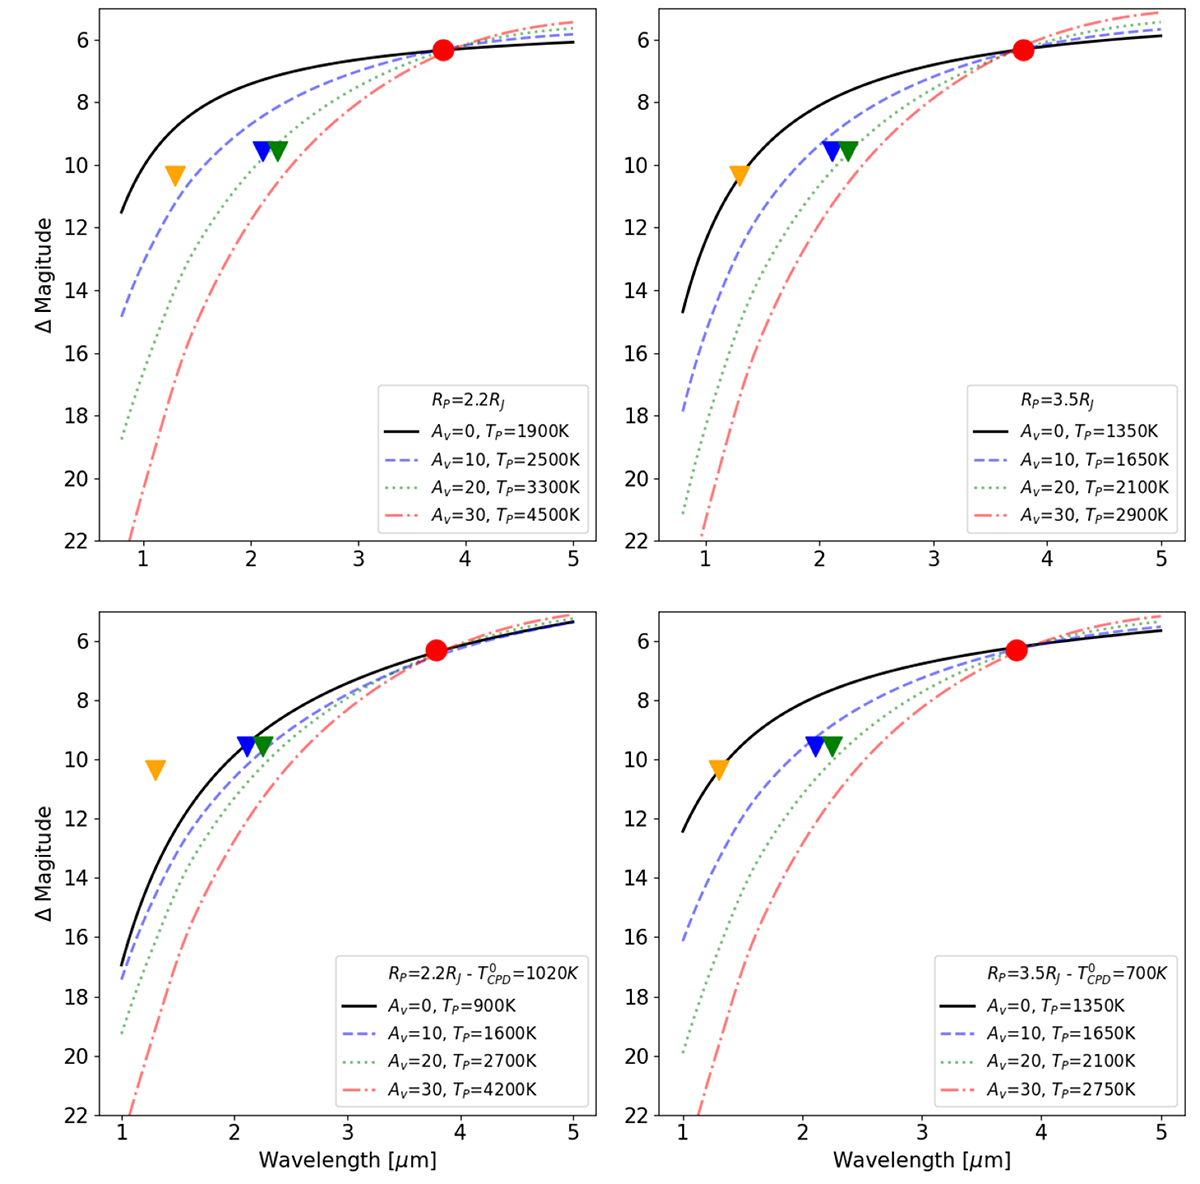
Fig. C.1.
Download original image
Spectral energy distributions expressed as differential magnitudes (Δ Magnitude) as a function of wavelength (in μm) for different planetary radii and temperatures. The black solid line represents the case with no extinction (AV = 0), while dashed blue, dotted green and dash-dotted red lines correspond to increasing extinction values (AV = 10, 20, 30) with progressively higher planetary temperatures (TP). The orange, green and blue leftward triangles indicate the upper limit by (Maire et al. 2017) in H, K1 and K2 bands. The red point indicates the contrast observed in this study. Each panel corresponds to a specific planetary radius: Top left:RP = 2.2RJ, Top right:RP = 3.5RJ, Bottom left:RP = 2.2RJ with a CPD contribution (TCPD), and Bottom right:RP = 3.5RJ with a CPD contribution.
Current usage metrics show cumulative count of Article Views (full-text article views including HTML views, PDF and ePub downloads, according to the available data) and Abstracts Views on Vision4Press platform.
Data correspond to usage on the plateform after 2015. The current usage metrics is available 48-96 hours after online publication and is updated daily on week days.
Initial download of the metrics may take a while.