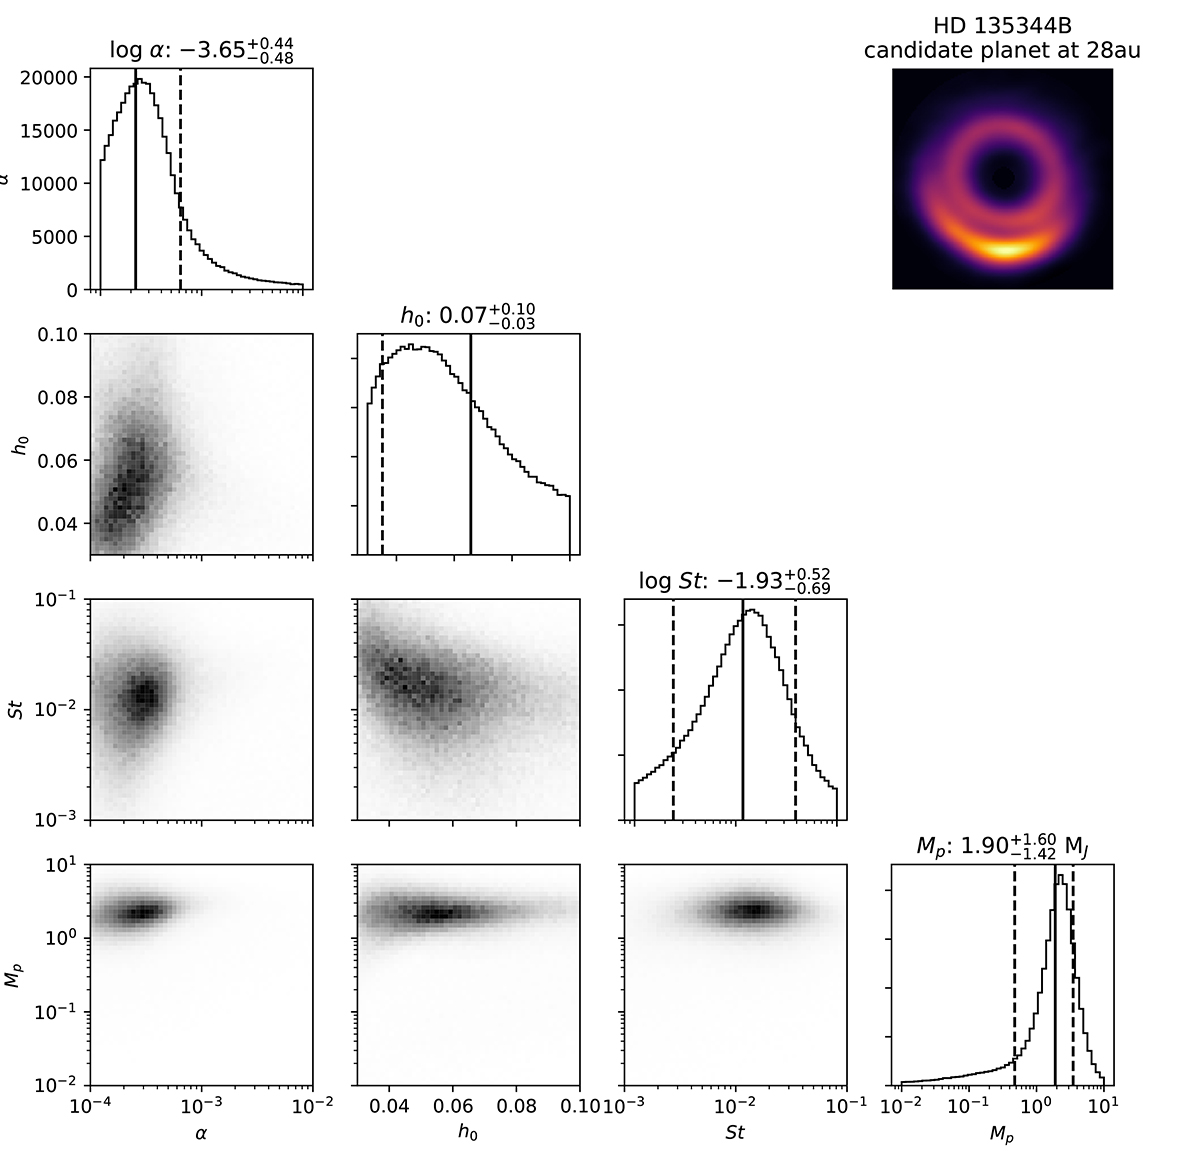
Fig. D.1.
Download original image
Results of the analysis of HD135344B dust substructures performed with DBNets2.0 (Ruzza et al. 2025). The plot is constructed sampling 5 ⋅ 105 points from the inferred posterior distribution for the four target disc and planet properties. Axis limits correspond to the region of the parameter space where DBNets2.0 was trained. The solid vertical lines in the histograms mark the medians of the respective distributions while the dashed lines mark the 16th and 84th percentiles when these are within the plotted intervals. The deprojected ALMA Band 6 dust continuum observation (ADS/JAO.ALMA#2018.1.01066.S, Casassus et al. 2021) used for this analysis is shown in the upper right corner.
Current usage metrics show cumulative count of Article Views (full-text article views including HTML views, PDF and ePub downloads, according to the available data) and Abstracts Views on Vision4Press platform.
Data correspond to usage on the plateform after 2015. The current usage metrics is available 48-96 hours after online publication and is updated daily on week days.
Initial download of the metrics may take a while.