Open Access
Fig. 3.
Download original image
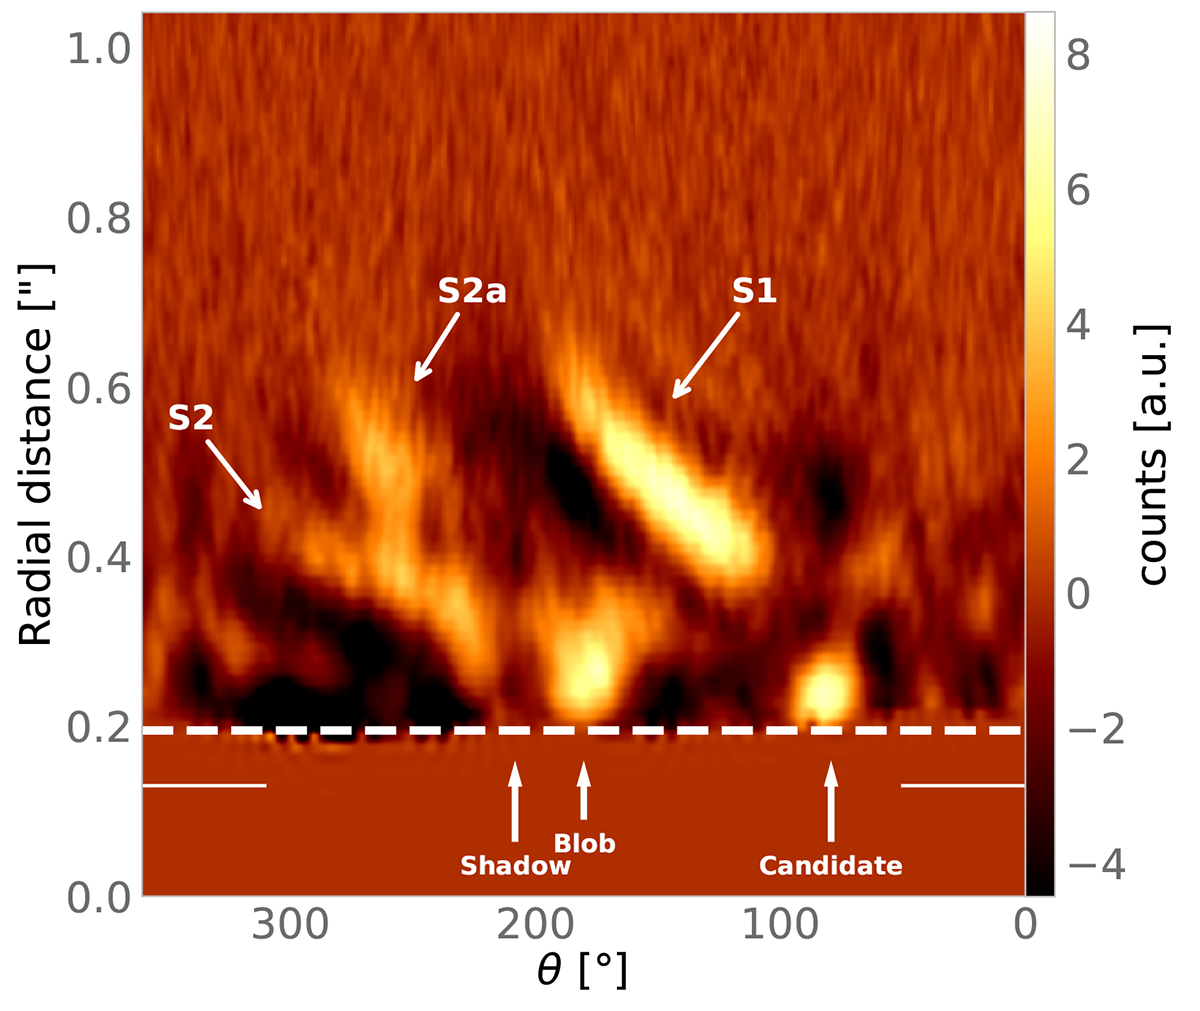
Polar de-projection of the ADI-PCA result. The position of the disk structures and point source candidate are highlighted with arrows. The horizontal solid line at 0 ![]() 15 indicates the shadowed area. The main spirals (S1, S2, and S2a) are highlighted in the figure. Spiral S3 is not visible in the ADI-PCA image.
15 indicates the shadowed area. The main spirals (S1, S2, and S2a) are highlighted in the figure. Spiral S3 is not visible in the ADI-PCA image.
Current usage metrics show cumulative count of Article Views (full-text article views including HTML views, PDF and ePub downloads, according to the available data) and Abstracts Views on Vision4Press platform.
Data correspond to usage on the plateform after 2015. The current usage metrics is available 48-96 hours after online publication and is updated daily on week days.
Initial download of the metrics may take a while.