Fig. 4.
Download original image
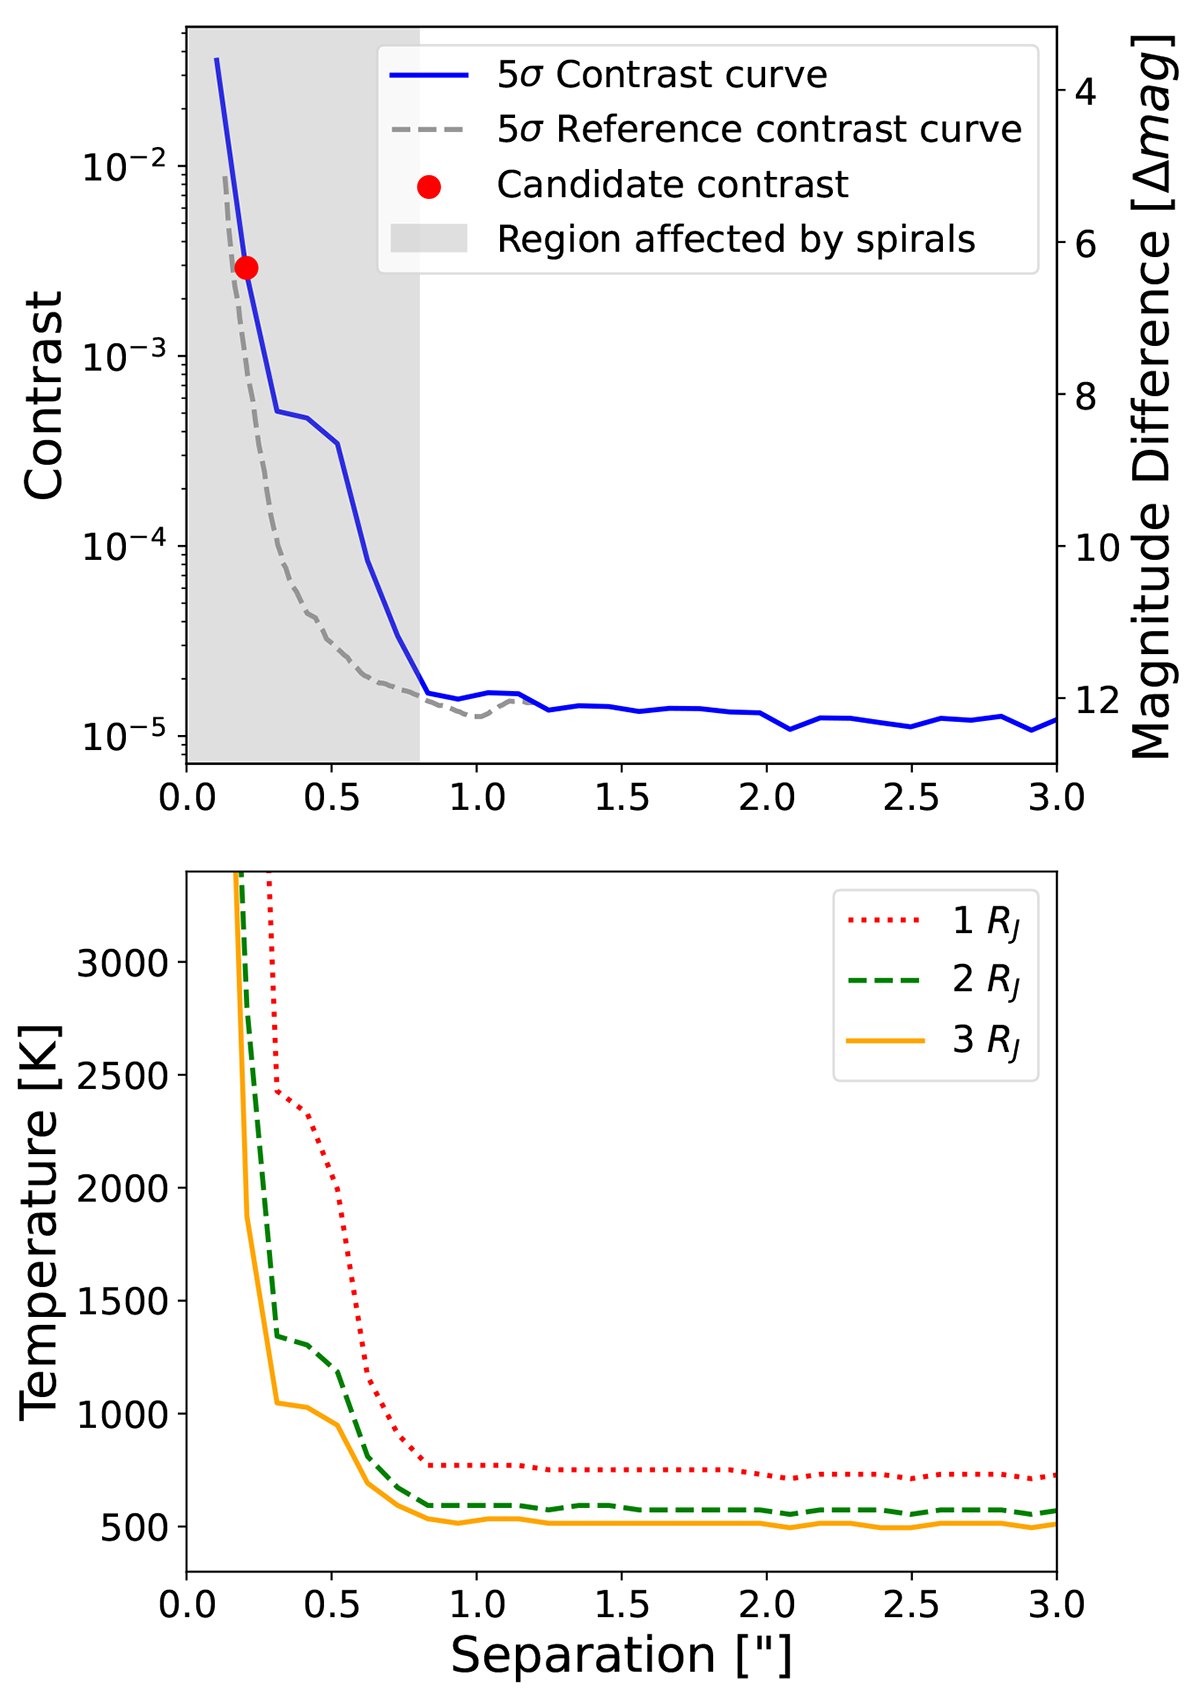
Top panel: Contrast achieved for HD 135344B (blue line) and for a reference isolated single star (dashed gray) with similar field rotation (i Vel, from ERIS manual). The gray region highlights the region contaminated by spirals. Bottom panel: Detection curves in terms of temperature computed for different photospheric radii.
Current usage metrics show cumulative count of Article Views (full-text article views including HTML views, PDF and ePub downloads, according to the available data) and Abstracts Views on Vision4Press platform.
Data correspond to usage on the plateform after 2015. The current usage metrics is available 48-96 hours after online publication and is updated daily on week days.
Initial download of the metrics may take a while.