


| Issue |
A&A
Volume 711, July 2026
|
|
|---|---|---|
| Article Number | A292 | |
| Number of page(s) | 13 | |
| Section | Interstellar and circumstellar matter | |
| DOI | https://doi.org/10.1051/0004-6361/202558458 | |
| Published online | 23 July 2026 | |
Multi-epoch scattered-light analysis of HD 135344B: New evidence for a spiral-driving protoplanet
1
STAR Institute, Université de Liège,
Allée du Six Août 19c,
4000
Liège,
Belgium
2
Institute of Astronomy, KU Leuven,
Celestijnenlaan 200D,
Leuven,
Belgium
3
European Southern Observatory,
Karl-Schwarzschild-Straße 2,
85748,
Garching bei München,
Germany
4
Max Planck Institute for Intelligent Systems,
Max-Planck-Ring 4,
72076
Tübingen,
Germany
5
Steward Observatory, University of Arizona,
933 N. Cherry Avenue,
Tucson,
AZ
85721,
USA
6
Max-Planck Institute for Astronomy (MPIA),
Königstuhl 17,
69117
Heidelberg,
Germany
7
Departamento de Astronomía, Universidad de Chile,
Casilla 36-D,
Santiago,
Chile
8
Data Observatory Foundation,
Eliodoro Yáñez 2990,
Providencia,
Santiago,
Chile
9
Instituto de Estudios Astrofísicos, Facultad de Ingeniería y Ciencias, Universidad Diego Portales,
Av. Ejército Libertador 441,
Santiago,
Chile
10
Millennium Nucleus on Young Exoplanets and their Moons (YEMS),
Chile
11
Department of Astrophysics, University of Zurich,
Winterthur-erstrasse 190,
8057
Zürich,
Switzerland
12
European Southern Observatory,
Alonso de Córdova 3107, Casilla 19,
Santiago,
Chile
13
LIRA, Observatoire de Paris, Université PSL, Sorbonne Université, Université Paris Cité, CY Cergy Paris Université, CNRS,
92190
Meudon,
France
14
Department of Astronomy, California Institute of Technology,
Pasadena,
California,
USA
15
Jet Propulsion Laboratory, California Institute of Technology,
Pasadena,
California,
USA
16
Departamento de Física, Universidad Técnica Federico Santa María,
Avenida España 1680,
Valparaíso,
Chile
17
Departamento de Física, Universidad de Santiago de Chile,
Av. Víctor Jara 3493,
Santiago,
Chile
18
Center for Interdisciplinary Research in Astrophysics Space Exploration (CIRAS), Universidad de Santiago,
Chile
19
Univ. Grenoble Alpes, CNRS, IPAG,
38000
Grenoble,
France
20
Leiden Observatory, Leiden University,
PO Box 9513,
2300 RA
Leiden,
The Netherlands
★★★ Corresponding author: This email address is being protected from spambots. You need JavaScript enabled to view it.
Received:
8
December
2025
Accepted:
1
June
2026
Abstract
Context. The HD 135344B (SAO 206462) disk exhibits strong signposts of planet formation both in scattered light and submillimeter continuum images. ALMA images in the submillimeter revealed a gap-crossing dust filament whose position coincides with a twist detected in the scattered-light spiral structure. Analysis of the spiral dynamics in polarized light also hints at a spiral-driving protoplanet in the submillimeter gap.
Aims. We aim to study the overall dynamics of the three spirals in the disk, as well as the motion of the twist over a 10-year baseline, at different IR wavelengths. We also seek to assess the authenticity of a candidate protoplanet recently claimed in the disk.
Methods. We used high-fidelity postprocessing algorithms such as iterative principal component analysis to minimize the biases induced by angular differential imaging on extended sources and conduct a thorough analysis of archival VLT/NACO, VLT/SPHERE, and VLT/ERIS datasets in order to obtain the spiral traces and measure their orbital motion in multiple wavelength bands in scattered light. We also reprocessed archival JWST/NIRCam datasets with these algorithms.
Results. We measured an average spiral orbital motion of 0°.81 ± 0°.05 yr−1, in agreement with the literature value of about 0°.85 yr−1 at all wavelengths. With simple modeling of the twist morphology, we confirm that it is indeed co-moving with the spiral in which it is embedded. While the position angle of the twist coincides with the dust filament, it is located at a smaller angular separation from the star, which we attribute to the fact that the spiral trace moves away from the central star with increasing wavelength. We find that a previously claimed protoplanet candidate in the disk can be adequately explained as a postprocessing artifact.
Conclusions. Our confirmation that the motion of the scattered light twist is consistent with the orbital velocity of a planet at 69 ± 4 au over a 10-year baseline suggests that the spirals, the gap, and the dust filament in the submillimeter continuum, as well as the twist in scattered light, could indeed all be attributed to the same hypothetical protoplanet deeply embedded within the spiral. A perplexing trend for a wavelength-dependence of the angular distance of the spiral traces to the central star still remains to be explained.
Key words: techniques: image processing / protoplanetary disks / planet-disk interactions / stars: individual: HD 135344B (SAO 206462)
F. R. S.-FNRS Research Fellow.
F. R. S.-FNRS Research Director.
© The Authors 2026
 Open Access article, published by EDP Sciences, under the terms of the Creative Commons Attribution License (https://creativecommons.org/licenses/by/4.0), which permits unrestricted use, distribution, and reproduction in any medium, provided the original work is properly cited.
This article is published in open access under the Subscribe to Open model. This email address is being protected from spambots. You need JavaScript enabled to view it. to support open access publication.
1 Introduction
Direct imaging of protoplanetary disks is made possible by state-of-the-art instruments capable of reaching high contrast and high angular resolution on large telescopes. The search for protoplanets embedded within these protoplanetary disks is still in its infancy, as such planets mostly seem to elude detection so far. Only a few of them have been robustly detected in both the IR and Hα, the well-known PDS 70b and c (Keppler et al. 2018; Haffert et al. 2019), and WISPIT 2b (Close et al. 2025; van Capelleveen et al. 2025), although there is no shortage of potential candidates (e.g., Hammond et al. 2023; Currie et al. 2025). One difficulty is that postprocessing algorithms tailored to the detection of point-like sources, making use of angular differential imaging (ADI, Marois et al. 2006), tend to struggle and bias the final result when applied to extended sources such as protoplanetary disks (e.g., Milli et al. 2012; Juillard et al. 2022). However, recent developments in postprocessing algorithms, such as iterative principal component analysis (IPCA, Stapper & Ginski 2022; Juillard et al. 2024), enable more unbiased imaging of the birth environments of planets. As a consequence of these recent improvements, revisiting archival datasets can prove valuable to study disk morphology and evolution over time, which is key to apprehending planet formation mechanisms.
HD 135344B (SAO 206462) is a  M⊙ (Müller et al. 2011) star located at 135.0 ± 0.4 pc (Gaia Collaboration 2023). This young star (
 Myr, Garufi et al. 2018) is a famous example of a protoplanetary disk exhibiting strong planet formation signposts, such as spiral arms and a central cavity resolved in scattered light (Muto et al. 2012; Garufi et al. 2013), as well as an annular gap in the submillimeter continuum (van der Marel et al. 2016; Cazzoletti et al. 2018). Although alternative explanations exist, a common interpretation for the existence of these structures is the interaction with massive companions (Dong et al. 2015; Price et al. 2018). In the case of HD 135344B, observations specifically point toward the planet-disk interaction scenario. Thanks to measurements of the proper motion of stars from Gaia DR3 (Gaia Collaboration 2023), recent stellar flybys (Cuello et al. 2019) were ruled out as the origin of the spirals (Shuai et al. 2022). Although gravitational instability (Lodato & Rice 2004) can also be the cause of spirals in pro-toplanetary disks, the relatively low mass of the HD 135344B disk favors the planet hypothesis (Dong et al. 2018). Yet the most tantalizing clue for a planet-driven origin resides in the dynamics of the spirals, first explored by Xie et al. (2021), which does not appear consistent with gravitational instability based on spiral rotation rate measurements. Moreover, a subsequent study by Xie et al. (2024) finds a 0°.85 ± 0°.05 yr−1 counterclockwise rotational motion. This suggests that the HD 135344B spiral dynamics could be attributed to a driving protoplanet on an orbit that coincides with a gap and a dust filament observed with ALMA in Casassus et al. (2021), which they link to a twist in one of the spiral arms in VLT/SPHERE scattered light images, already detected in Stolker et al. (2016) in polarized light, at the location of the dust filament. This hypothetical spiral-driving companion, if its position coincides with the dust filament found with ALMA, would be embedded within the disk, rendering any direct detection challenging. So far, there has been no direct detection of such a spiral-driving candidate, despite the fact that this effect was measured in multiple protoplanetary disks (Ren et al. 2020; Ren et al. 2024).
It should be noted that the study of the HD 135344B spiral dynamics is made slightly more complicated by the presence of an unresolved misaligned inner disk (Bohn et al. 2022) that causes shadowing on the outer disk. The shadowed area caused by the inner disk is variable over periods of time as short as a day and can affect the apparent morphology of the outer disk, as observed in Stolker et al. (2016) and Stolker et al. (2017). Additionally, it was shown that both static and moving shadows from a misaligned inner disk can hydrodynamically trigger large-scale spirals (Montesinos et al. 2016), possibly even resembling planetary signatures (Montesinos & Cuello 2018). However, the spiral pattern orbital period from the shadow-driven scenario is expected to be the same as the inner disk precession period, typically of the order of thousands of years, which the measured velocity of 0°.85 yr−1 in Xie et al. (2024) seems to disprove.
Several candidate protoplanets around HD 135344B were previously proposed in the literature. Using JWST/NIRCam, Cugno et al. (2024) presented a candidate detection outside the spirals, located at a separation of about 300 au, with an estimated mass of 0.8 Jupiter masses. Another candidate at a separation of 28 au, embedded within the protoplanetary disk, was announced in Maio et al. (2025) based on VLT/ERIS Lp-band observations of the system.
Here, we aim to investigate the protoplanetary disk of HD 135344B, its morphology and dynamics over time through the use of high-fidelity postprocessing algorithms that preserve the morphology of such extended sources, while leaving the study of the central cavity and the search for protoplanets embedded within it for future work (Latour et al., in prep.). Similarly to what Xie et al. (2024) did in polarized light, we measure the spiral rotation rate in scattered total intensity light in different wavelength bands, with a longer time baseline, and also analyze the dynamics of the twist. We describe the observations and data preprocessing in Sect. 2. Then, we present all of our results in Sect. 3, and discuss our different interpretations in Sect. 4.
2 Observations and image processing
2.1 Observations
For this study, we used archival observations of HD 135344B, captured with VLT/NACO, VLT/SPHERE, JWST/NIRCam, and VLT/ERIS (see Table 1 for all relevant information). Most of these datasets are still unpublished, but some have already been analyzed in the literature. This is the case of the 2015 SPHERE coronagraphic dataset presented in Maire et al. (2017), the 2023 JWST noncoronagraphic observation analyzed in Cugno et al. (2024), and, finally, the 2024 ERIS coronagraphic dataset analyzed in Maio et al. (2025). All the SPHERE observations captured in 2023 and 2024 are noncoronagraphic, nonsaturated observations captured in the star-hopping mode (Wahhaj et al. 2021). This observing mode provides highly correlated reference images of a nearby star that make it possible to use a postprocessing algorithm based on reference differential imaging (RDI, Xie et al. 2022), allowing for a less biased retrieval of the disk morphology. Contrary to all other datasets, the JWST data were not used for spiral motion measurements due to imperfect wavelength match with other observations, which would bias any estimate of spiral motion. Instead, the JWST/NIRCam data are used to both search for accreting embedded protoplanets through the Pa-α (1.87 μm) and Br-α (4.05 μm) lines, and illustrate the performances of IPCA in recovering the disk structure at these wavelengths. In Fig. A.1, we also recover the signal found by Cugno et al. (2024) in the F410M filter.
2.2 Preprocessing
The multiple NACO datasets, all captured in the Lp band, were calibrated and preprocessed thanks to a pipeline based on Pyn-Point (Stolker et al. 2019), explained in more detail in a future publication (Bonse et al., in prep.). The main steps include classical dark subtraction, flat-fielding, background subtraction, and precise alignment of the science frames.
Regarding the SPHERE observations, calibration and preprocessing were performed using the SpeCal pipeline (Galicher et al. 2018) and the data products retrieved from the SPHERE data center (Delorme et al. 2017) for the 2015, 2018 and 2023 datasets, while the vcal-sphere pipeline (Christiaens et al. 2023b) was used for all other datasets. Both pipelines allow for the full standard reduction procedure for IFS and IRDIS data, with vcal-sphere further leveraging routines from the Vortex Image Processing (VIP) package (Gomez Gonzalez et al. 2017; Christiaens et al. 2023a) for PCA-based sky subtraction, bad pixel correction, image alignment based on fast Fourier transforms, and automatic bad frame removal.
We obtained the calibrated JWST-NIRCam dataset from Cugno et al. (2024). We did not apply any additional preprocessing to this dataset, except for a fine subpixel recentering done by maximizing the cross-correlation between the frames on areas of the images that excluded the saturated center of the point spread function (PSF). Finally, the ERIS observation was preprocessed with a custom pipeline that was adapted from a pipeline initially developed for NACO datasets, detailed in Christiaens et al. (2021), also allowing dark subtraction, flat-fielding, background subtraction, bad pixel correction, and fine image alignment.
Additionally, we rejected bad frames in every dataset by measuring the correlation of all the frames in the datacube with the median of the cube itself and rejecting a certain percentage of the worst frames. As the PSF was saturated in some datasets, the correlation was calculated on an annulus centered on the PSF core and built in such a way that the saturated core is excluded from the area considered for the calculation. The percentage of rejected frames was determined on a case-by-case basis depending on the overall quality and stability of the dataset, ranging from 0 to a maximum of 5% of the total images in the datacube.
Scattered-light observations used in this work.
2.3 Postprocessing
For all observing nights, the goal was to retrieve the highest-quality image of the disk, i.e., the image that captures the most light from the protoplanetary disk and preserves its morphology the best. To this end, the IPCA (Juillard et al. 2024) algorithm, implemented in VIP, is systematically applied to process all datasets, as it was shown to better preserve protoplanetary disk structures. Juillard et al. (2024) compared the use of IPCA with ADI, RDI, or angular-reference differential imaging (ARDI) and found that the latter generally performs better to retrieve fainter disk signals. However, in this paper, a fourth strategy, not mentioned in Juillard et al. (2024), called reference-angular differential imaging (RADI), is sometimes adopted. It consists of making use of iterative RDI first to retrieve the disk signal as well as possible, and then iterative ADI to better subtract the speckles. This mode is mainly useful for datasets that do not have much field rotation. The best parameters for the IPCA reduction were determined iteratively with a convergence criterion: the flux of the disk retrieved by the algorithm must stabilize and converge after a given number of iterations. For the ERIS dataset, we compare images obtained with PCA and IPCA in order to understand and highlight some artifacts and biases left by algorithms not suited for extended sources. For the 2015 SPHERE observation, PCA-RDI with data imputation (Ren 2023) was also used to produce some high-fidelity images of the protoplanetary disk, as it is faster and performs as well as IPCA in this case. Data imputation was not usable for any other dataset, as it requires highly correlated and stable speckles that do not overlap with the disk.
When studying the spiral dynamics, we deprojected the disk assuming a 16°.7±0°.6 inclination from face-on (Bohn et al. 2022). The uncertainty on the inclination was propagated to the deprojected images, but the impact on the spiral traces was found to be negligible. Assumptions on the disk flaring also had to be made for the deprojection. Using polarimetric images, Avenhaus et al. (2018) measured the flaring of multiple disks and found the average value of α = 1.219 ± 0.026 for the flaring index. This range led to a negligible impact on the final deprojected images, even when testing a larger spread of α values than they suggest. As a consequence, both the uncertainties from the inclination and the disk flaring were neglected. Finally, we also scaled the images with an r2 map, with r being the distance to the central star, as the amount of scattered light decreases with the incident light as r−2. The r2-scaling, alongside the disk deprojection, is done to avoid geometric biases when tracing the spirals, for which we followed Ren et al. (2020).
3 Results
3.1 Disk morphology
The protoplanetary disk of HD 135344B presents a central cavity depleted of gas and dust and two large spiral arms. Figure 1 shows a gallery of the most representative postprocessed images of HD 135344B in multiple wavelength bands ranging from 1 to 4 microns, using the IPCA algorithm (see Fig. B.1 for the full gallery of all the disk images obtained for all the datasets used in our study). The center of the images is masked to enhance visibility by blocking bright signals and noise in the central cavity, the analysis of which will be presented in Latour et al. (in prep.). Figure 1 suggests that even when using a pure RDI strategy, it is still better to have more field rotation as illustrated by the lower-quality images for the dataset captured on 202307-24, which only presents 12° of rotation. IPCA images of the JWST observations are also presented in Fig. 1 and show a great improvement in disk recovery over the simple PCA-processed images presented in Cugno et al. (2024). Although JWST/NIRCam also observed HD 135344B in the F410M filter, the saturation of the central PSF made it impossible to recover any signal from the protoplanetary disk in that filter; this is why no image is shown using this filter.
All the structures of the disk are better highlighted in the r2 -scaled images and are fully presented and labeled in Fig. 2, captured with SPHERE in 2015. The S1 spiral arm takes root north of the star and extends a full 180° around it to 0".6. It exhibits a substructure named the S1 blob at a position angle of around 225°. At this location, the spiral arm is visibly slightly wider and brighter than its surroundings, which is especially noticeable in the YJH filters. The S2 arm, which extends from the southwest to the northeast, appears somewhat smaller and does not have a blob like S1. A much smaller and fainter third spiral arm, referred to as S3, seems to derive from the southeast part of S2, but is not as easily detected at all wavelengths.
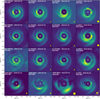 |
Fig. 1 Image gallery of the HD 135344B protoplanetary disk at different wavelengths for multiple datasets. The central star is masked and marked by a white star marker. All of the images were processed using IPCA, except for the images in the YJH bands. North is up, east is left. The yellow circles indicate the spatial resolution of each image. |
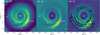 |
Fig. 2 View of the protoplanetary disk of HD 135344B at different wavelengths, postprocessing the 2015 coronagraphic SPHERE dataset with PCA-data imputation, which is the dataset that provides the best-quality images of the disk. The different spiral arms are labeled, along with a noticeably brighter region of S1 named the S1 blob. The images were r2-scaled and deprojected, and the center of the images is marked by the white star. The yellow circles indicate the beam size in the IRDIS data, with the black oval the ALMA beam size. The white circle marks the position of the twist. The traces extracted from the image in the K1 band are illustrated in blue. Overplotted with the K2 filter are the 4-sigma contours of the ALMA image from Casassus et al. (2021), deprojected assuming no flaring since submillimeter continuum observations trace the midplane, and rotated according to the 0.85° yr−1 value found in Xie et al. (2024), highlighting the overlap between the twist and the dust filament. |
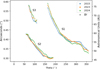 |
Fig. 3 Spiral traces in polar coordinates in the K1 filter in the deprojected images. Theta is the angle measured counterclockwise from north of the central star. In black, labeled ∆r, the typical trace uncertainty, not shown on each data point to improve readability. |
3.2 Spiral orbital motion
We followed the procedure described in Ren et al. (2020) to study the dynamics of the spirals. Using the deprojected r2-scaled images, a Gaussian was fitted to the radial profile of the flux at 1° intervals in order to obtain the radial maxima for each angle θ. The Gaussian fit was performed on a section of the flux profile centered on the local maximum, of width determined by the distance to the closest local minimum in the flux profile. The resulting (r,θ) pairs for the K1 filter are shown in the middle panel of Figs. 2 and 3. To avoid redundancy, the traces are only shown in the K1 band, but the exact same procedure was repeated for all filters available in our data: YJH, K1, K2, and Lp.
The summary of the results for the spirals’ velocity is presented in the first three columns of Table 2. Assuming a rigid-body rotation for the spirals, we measured their motion by shifting the traces in polar coordinates relative to one another and finding the angular shift that maximized the cross-correlation between both traces. The angular shift corresponds to the average amount of rotation that each spiral has undergone around the central star in the given time interval between the observations. The 1σ uncertainties in the measurements were obtained through a classical bootstrapping method with replacement that consisted of creating artificial spiral traces by resampling the trace data points and obtaining the angular shifts for all these different traces spawned by the original. The standard deviation of the values obtained from 1000 bootstrap iterations was then defined as our uncertainties in our initial measurement. The bootstrapping was done independently on each wavelength band and epoch. For the K1, K2, and YJH bands, the velocity measurements were always measured relative to the 2015 dataset. This means the angular shift between the 2023 and 2024 datasets, for example, does not contribute to the final average presented in the table, in order to keep all measurements fully independent of each other. For the Lp band, the measurements were always done relative to the 2013 dataset. The final values for each band, and their associated uncertainties, are obtained through an inverse variance weighted mean. The last line of Table 2 is the weighted average of all bands, with the uncertainty of the inverse-variance weighted mean. The velocity of S3 could not be reasonably determined in the YJH band, as this spiral arm has an estimated average S/N below two in this band, which is not enough to obtain a proper spiral trace we can trust, in contrast to the K1 and K2 bands where this average S/N is above five.
For S1, only the parts of the traces at position angles smaller than 230° were used for the computation of the angular velocity, as this is where the rigid-body assumption seems to hold, as Fig. 3 shows that the traces intersect with each other at larger position angle values (smaller separations). We conducted a chi-square test on rigid-body versus Keplerian rotation assumptions for this section of S1 and found reduced chi-square values of 1.96 ± 0.82 and 4.57 ± 1.57, respectively. The test thus significantly favors the rigid-body hypothesis. We note that, coincidentally, the twist is included in that section of S1, at the separation of the gap found with ALMA. Additionally, looking closely at Fig. 2, we notice a faint prolongation of S2, north of the central star, which seems to extend and merge with S1 in all wavelength bands. The traces we obtained for the position angles between 360° and 270° could be influenced by this effect and are therefore not trusted for this exercise.
The uncertainty on the individual trace data points, taking into account the statistical uncertainties of the Gaussian fit, the uncertainty on the inclination of the disk, and the flaring index lead to a negligible typical uncertainty of 0.02 pixels (0.25 mas in K band); hence why no uncertainties are visible in Fig. 3, as they are too small. However, the centering uncertainty on our datasets must also be taken into account, as a small centering offset can lead to systematic displacements of the trace that could be interpreted as motion. The centering procedure for the noncoronagraphic SPHERE datasets was to fit a 2D Gaussian model to the center of the PSF and apply subpixel shifts to the frames accordingly. This leads to a typical centering uncertainty of 0.005 pixels (0.06 mas in K band). Centering the coronagraphic 2015 SPHERE dataset based on speckle cross-correlation leads to a 0.02 pixel uncertainty (0.25 mas in K band). This uncertainty is trickier to estimate for NACO coronagraphic datasets as the centering of the star behind the coronagraph is not as straightforward. Godoy et al. (2022) cites a 0.2-pixel uncertainty (5.4 mas in Lp band). For the ERIS vortex coronagraph, we estimate approximately a 0.1-pixel (1.3 mas in Lp band) pointing uncertainty from Orban de Xivry et al. (2024). Assuming a 0.2-pixel systematic shift in the same direction for all the datacube frames, which is the worst case scenario as one could assume those shifts should be roughly equally distributed in all directions, this shift is sufficient to lead to an estimated average measured displacement of the spirals of about 2° in NACO data. Considering that the angular shifts measured are of the order of 5-10° depending on the datasets, this is significant; however, it remains a high upper bound on the uncertainty due to recentering as the assumption of a systematic shift remaining constant all throughout the observation is unlikely, and we assume it is not the case with our observations. Nevertheless, the Lp results uncertainties should be taken with care. In contrast, with the same assumptions, this average displacement is only of about 0.01° for SPHERE noncoronagraphic data, and 0.06° for the sole SPHERE coronagraphic dataset, and 0.3° for the ERIS data. Additionally, the results in the Lp band also take advantage of two different instruments, NACO and ERIS. Inter-instrument systematics may introduce additional error sources. Yet, using only the NACO datasets, or including ERIS in the measurements, does not change significantly the final values presented, except for the uncertainty that is lowered when adding the ERIS data thanks to the longer time baseline.
We also estimated the effect of the seeing and, more precisely, the PSF size on the recovered spirals traces, and found it to be negligible. Between datasets, the full width at half maximum (FWHM) varies by no more than 5 mas, the most in Lp band, and convolving our images with PSFs of differing FWHM within that range does not significantly change the recovered traces, with an uncertainty of 0.8 mas on the trace radial location. The uncertainty on the true north (TN) correction must also be taken into account but was deemed negligible except for the NACO instrument. The values are shown in Table C.1. Uncertainties on the trace position associated with the postprocessing algorithms are difficult to quantify, but our tests suggest that the final images are robust to a wide range of postprocessing parameters. The measured dispersion on the trace radial locations is typically inferior to 0.13 pixels (1.6 mas in K band) for different IPCA parameters, such as the number of iterations that we varied between 20 and 200, the number of principal components subtracted ranging from 1 to 20, and the reduction strategy changed between ADI, RDI, ARDI, or RADI. The traces extracted from the two datasets captured one day apart in 2024 differ only by about 0.1 pixels (1.2 mas in K band), which is consistent with the typical uncertainty found for different IPCA parameters. This stability of the recovered disk with IPCA is in agreement with Juillard et al. (2024), who detailed the performance of the IPCA algorithm. Despite its excellent performance for most datasets, there are still some limitations to the use of IPCA, especially for datasets with a low parallactic angle rotation or with only an ADI strategy available, where the disk is not fully recovered (see Fig. B.1). This is the case for the 2017 NACO observations that were not used in our measurements as the disk could not be recovered at all. The 2018 SPHERE dataset, processed with ADI only, is also clearly subject to selfsubtraction of the disk; however, the measured dispersion on the trace radial location is the same as for RDI observations, and it is therefore still used in our measurements. Except for NACO, the internal statistical uncertainties dominate over the uncertainties due to the IPCA reduction and other instrumental systematics, as expected from the instrumental stability of SPHERE over time (Maire et al. 2021).
Orbital velocity and twist separation measurements.
3.3 Dependence on the wavelength
Following a similar procedure, we set out to assess the impact of the wavelength on the trace of the spirals. However, deprojecting the disk requires assumptions for the disk flaring, which is dependent on the wavelength. As such, we opted not to deproject the images for this exercise, as any assumption on our part could bias the results. Also, the disk being almost face-on means that any deprojection effect should be minimal, and a reasonable trace can be obtained without deprojecting. The results are visible in Fig. 4, using the 2015 SPHERE data, which were chosen for illustration as they provide the best quality images of the disk within a great wavelength range. The other datasets show the exact same trends. For both spiral arms, we observe the spirals moving away from the central star with increasing wavelength, although this tendency is much stronger for S1 than S2. No proper measurements could be obtained for S3.
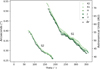 |
Fig. 4 Spirals traces in polar coordinates for the same observation (SPHERE 2015) at different wavelengths. Theta is the angle measured counterclockwise from north of the central star. Contrary to Fig. 3, images were not deprojected here. S3 is not included as it was not well detected in all wavelength bands. In black, labeled Δr, the typical trace uncertainty, not shown on each data point to improve readability. |
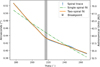 |
Fig. 5 Zoomed-in view of the spirals trace for the 2015 SPHERE observation. A single and two-spiral fit are compared. The vertical line shows the break point (the twist) found by the model between the two spirals for the two-spiral fit, along with its uncertainties in the shaded area. |
3.4 S1 twist
Here, we investigate the twist that was already observed in scattered light in the structure of S1 (Stolker et al. 2016; Casassus et al. 2021). To do so, we fit a simple logarithmic spiral of equation,
 (1)
(1)
to the trace of the spiral, with real numbers a and b. Then, we allow for a more complex double-spiral model, in which a break point is built in. Beyond this break point, the spiral is assumed to follow a logarithmic spiral with parameters that have changed with respect to the first section. This can be summarized as follows
 (2)
(2)
with θc the break point between both spiral models. Continuity was not strictly enforced at θc. The location of the break point was left entirely as a free parameter in the double-spiral model, bringing the total to five free parameters. A comparison of the single and two-spiral fits for the 2015 SPHERE dataset in the K1 filter is shown in Fig. 5. It is clear that the doublespiral model fits the data much better. The model finds the break point at a position angle of 216°.58 ± 1°.65. Based on this model, we can then track the motion of this structure over time and infer its orbital velocity by independently fitting the two-spiral model to all epochs and wavelengths. Figure D.1 shows the position of the twist as a function of time in all wavelength bands, displaying a clear trend for its motion, despite relatively large uncertainties. The results of this analysis are displayed in the second-to-last column of Table 2. The possibility of a discontinuity was entertained as a way to more closely resemble the model used in Casassus et al. (2021). However, enforcing continuity at the break point did not have a great impact on the resulting fit and angular location of the break point. Our observations do not seem to confirm the theoretical framework used in Casassus et al. (2021) to model the twist in the spiral, as the fit on our data results in a reduced chi square value of 59.9 ± 6.6 compared to 2.6 ± 0.2 for our two-spiral model.
When fitting a Gaussian to the radial profile of a spiral, the centroid of the Gaussian gives us the spiral trace, but we also retrieved the FWHM, which can then be interpreted as a metric for the width of the spiral. For S1, a clear correlation can be observed between the spiral arm width and the twist, as the latter is always enclosed, or at the boundary, of a wider section of the arm, as illustrated in Fig. 6. This wider section of the arm can be recognized as the S1 blob, as named in Fig. 2 and already identified in Maire et al. (2017). This blob also generally looks brighter than its surroundings. Additional measurements are included in Fig. E.1 and show the S1 blob in multiple epochs and wavelengths. While our data show that the twist position is coincident with the S1 blob, it does not allow us to definitely link the twist to the S1 blob as we are unable to measure reliably the motion of this morphological feature and confirm that it is comoving with the break point that we measure. A close-up view of the twist with the blob over multiple epochs is also available in Fig. E.2.
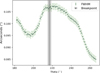 |
Fig. 6 FWHM of S1 in the K1 filter, and measured in the 2015 SPHERE observation. The break point indicating the detected twist is also shown and is located exactly where the spiral arm is wider. |
4 Discussion
4.1 Spiral-driving protoplanet
Multiple elements in our results, along with previous work on this protoplanetary disk, hint at the existence of a spiral-driving protoplanet that remains undetected so far. Our orbital velocity measurements presented in Table 2 are in general agreement with the value of 0°.8.5 ± 0°.05 yr−1 found by Xie et al. (2024) in polarized light. To find this value, they assumed that the arms are co-rotating, as their measurements seemed in agreement with that hypothesis. Here, we fitted the orbital velocity of each spiral arm separately, at multiple wavelengths in scattered light. Although our larger uncertainties mean that we cannot rule out that the spiral arms indeed co-rotate, there seems to be a trend for S2 to rotate slightly slower. Nevertheless, the orbital velocity we found for S1 is perfectly consistent with the measurement of Xie et al. (2024) for all wavelengths tested. If we assume that the spiral arms and the twist co-rotate, our measurements in Table 2 yield an average orbital velocity of 0°.81 ± 0°.05 yr−1, with the inverse-variance weighted mean uncertainty. This is in agreement with their prediction for a spiral-driving protoplanet at a radius of about 0″.49 ± 0″.02 (i.e., 66 ± 3 au), assuming a circular orbit with the same period as the spiral arms. Our value results in a semi-major axis estimate of 69 ± 4 au.
Additionally, Casassus et al. (2021) noticed, with ALMA, the presence of a dust filament that bridges an annular gap. They also noted that the position of the twist seen in scattered light in Stolker et al. (2016) roughly coincides with this dust filament. This dust filament and twist overlap in terms of orbital distance with the protoplanet suggested by the spiral velocity measurements of Xie et al. (2024). Here, we detect this twist again, at multiple wavelengths, and find an orbital motion that is consistent with it co-moving with the rest of the spiral arm in terms of angular velocity (see Table 2). This seems to indicate that the twist is indeed linked to the same phenomenon that causes the spiral arms, the annular gap, and the dust filament in the submillimeter continuum all at once; all of which may point to the existence of a protoplanet, even though other explanations, like multiple perturbers or more complex spiral dynamics could potentially also explain the same observations, and the positional coincidence of the twist with the dust filament is not definite proof that they are both physically linked. The twist can also be linked to a blob found in S1 as well, whose position follows the rest of the spiral arm. We also noticed that the twist appears closer to the central star than suggested by the spiral-driving orbit found by Xie et al. (2024). Indeed, they cite a separation of 0".49 ± 0".02, while we find the twist at about 0".419 ± 0".005 (see the last column of Table 2). While it may be that the orbit is not circular, we posit that this has more to do with the dependence of the spiral trace on the wavelength of observation, as different wavelengths probe different layers of the protoplanetary disk, as discussed in Sect. 4.2.
We attempted to directly detect a point-like source for this hypothetical protoplanet but were unsuccessful. The SPHERE data from 2015 offer the highest-quality images of the disk but do not present any sign of a point-source in the disk, as already noted by Maire et al. (2017). We initially hoped that the JWST-NIRCam observation could shed new light on this hypothetical protoplanet, but no point-source is detected with IPCA, as shown in Fig. 1, despite the filter F187N being centered on Paschen-α and F405N on Brackett-α that could be emitted by accreting giant planets (Aoyama et al. 2018). Nevertheless, it can be noticed that the F405N image presents a brighter region southeast of the central star, roughly at the position of the twist; however, we do not consider this robust enough to claim a detection. Astrometry measurements provide a radial separation of 0″.45 ± 0″.04 and a position angle of 213°.4 ± 5°.7, which is consistent with the twist position. We also obtained a rough estimate of the apparent excess flux on top of the flux from the spiral arm in the F405N filter:  mJy.
mJy.
4.2 Spectral signature
Figure 4 shows the dependence of the spiral traces on the wavelength. The traces appear to move away from the central star as the wavelength increases, as the angular separation of the twist in different bands seems to confirm in Table 2. A similar effect was already observed in Table 1 of Zhong et al. (2024) on the RX J1604.3-2130 disk, which is in an almost face-on orientation like HD 135344B. Using 3D hydrodynamical simulations, Zhu et al. (2015) studied the structure of spiral shocks induced by young planetary-mass companions and found that the shocks curl inward toward the central star as they get farther away from the disk midplane. Combining this with the fact that different observing wavelengths probe different depths of the protoplane-tary disk, this could explain the trend that emerges from Fig. 4. The full analysis of this effect is beyond the scope of the present study. However, a rudimentary argument can be used to highlight some discrepancies between this model and the data. Longer wavelengths probe deeper layers of the disk, which, based on the 3D structure found by Zhu et al. (2015), is indeed consistent with the traces appearing closer to the star at shorter wavelengths. Nevertheless, a simple geometric argument implies that this effect should be stronger at the near side of the disk rather than at the far side. This is the opposite of what we observe, as the effect is visibly less apparent for S2, located at the near side according to Stolker et al. (2016).
4.3 ERIS protoplanet candidate
Maio et al. (2025) proposed the detection of a candidate protoplanet located 87° west of north, at a separation of approximately 0″.2, and a contrast of ~3 × 10⁻³. We conducted an independent analysis of the same dataset and successfully retrieved the candidate using a PCA-ADI algorithm with a number of principal components similar to the ones they did. However, we also ran the iterative PCA algorithm in an attempt to reduce the geometric biases of ADI on the extended protoplanetary disk, which resulted in the candidate detection blending with the rest of the disk in the final image. The comparison of our PCA and IPCA reductions is shown in Fig. 7. This highlights how embedded within the disk this candidate would be and suggests that it may result from the disk being filtered into a point-like source by the ADI algorithm. Additionally, the measured spiral rotation rate suggests that a companion driving the spirals would not be located at this separation.
In addition to this reanalysis of the ERIS dataset, we checked all our NACO observations in the Lp band to assess whether this candidate was previously detected, which would reinforce the argument that this is a genuine point-like source. However, the candidate was not robustly detected in any previous datasets. While blobs and overdensities were found in the disk at different positions and epochs, none of these detections were consistent with an object on a Keplerian orbit, rather suggesting a high risk of filtering the spirals and the disk with PCA-ADI.
In order to test whether the geometric biases of PCA-ADI postprocessing can produce point-like sources, as observed by Maio et al. (2025) for the specific disk morphology of HD 135344B, we ran a test experiment applying PCA-ADI on a simulated datacube containing only a PSF and the protoplan-etary disk with no point-source within. We started by selecting the highest-quality image of the disk obtained with NACO in the Lp band (epochs 2018-06-01 and 2018-06-02). These disk images were injected into another NACO dataset obtained on a reference PSF, so we reconstructed an artificial dataset with the same parallactic angle vector as the Maio et al. (2025) dataset. The result is displayed in Fig. 8 and shows that the geometric biases induced by PCA-ADI can create point-like sources with negative side lobes, similar to the one reported by Maio et al. (2025), which casts additional doubts on this tentative detection.
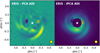 |
Fig. 7 ERIS images processed with PCA (left) and IPCA (right). The center of the images is masked and marked by the white star marker. The candidate found in Maio et al. (2025), detected as they did in the left image with PCA, is marked by the red cross on both images. |
5 Conclusions
We analyzed the HD 135344B protoplanetary disk in scattered light at different near-infrared wavelengths over close to a 10-year baseline. We measured the rotation rate of both spirals and found a value of 0°.81 ± 0°.05 yr−1, consistent with the most recent measurement in Xie et al. (2024) of 0°.85 ± 0°.05 yr−1. Although our uncertainties do not allow us to reject the hypothesis that the arms are co-rotating, we find a slight trend of S2 moving more slowly than S1. The hypothesis of a spiral-driving protoplanet, already proposed by Xie et al. (2024) is in agreement with our findings, as we confirmed the presence of a twist in S1 and showed that its motion is consistent with the average motion of the rest of the spiral, at the orbital velocity expected from Xie et al. (2024). This does not rule out other hypotheses, such as multiple planetary perturbers and complex disk interactions that may still be able to explain the data. The position of this twist coincides with the dust filament discussed in Casassus et al. (2021). However, we did not find any direct hint for a protoplanet at that location in our datasets. We also measured the wavelength dependence of the angular distance of the spiral traces from the central star, noting a perplexing difference in the strength of this effect between both spiral arms, which a pure geometrical argument alone cannot account for.
Lastly, we conducted an independent analysis of the ERIS data presented in Maio et al. (2025). Our analysis suggests that the candidate point-like source presented by Maio et al. (2025) is an artifact caused by the use of PCA-ADI processing on the extended protoplanetary disk. We also did not find any sign of this candidate source in any of our other datasets, whether in the Lp band or at other wavelengths, and the measured spiral rotation rate does not indicate the presence of a protoplanet at that separation.
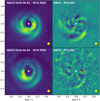 |
Fig. 8 NACO images produced with IPCA (left) from which the disk was extracted to inject in a NACO reference datacube. PCA-processed image of the fake datacube (right). The location of the candidate found by Maio et al. (2025) is marked by the red cross, while the black cross marks point-like artifacts generated by the ADI postprocessing, which also exhibit what could be interpreted as negative side lobes. The white star marks the center of the images while the yellow circle illustrate the size of the FWHM. |
Data availability
All disk images presented in Fig. B.1 are available at the CDS via https://cdsarc.cds.unistra.fr/viz-bin/cat/J/A+A/711/A292. Some of the data used in this paper were obtained thanks to the Mikulski Archive for Space Telescopes (MAST) at the Space Telescope Science Institute and can be accessed via DOI: 10.17909/65md-vq43.
Acknowledgements
V.C. and O.A. thank the Belgian Federal Science Policy Office (BELSPO) for the provision of financial support in the framework of the PRODEX Programme of the European Space Agency (ESA) under contract number 4000142531. I.H. received funding from the European Research Council (ERC) under the European Union’s Horizon 2020 research and innovation programme (PROTOPLANETS, grant agreement No. 101002188). L.A.C. acknowledges support from ANID, FONDECYT Regular grant No. 1241056 and the Millennium Nucleus on Young Exoplanets and their Moons (YEMS), ANID—Center Code NCN2024_001. Part of this work was carried out within the framework of the NCCR PlanetS supported by the Swiss National Science Foundation under grant 51NF40_205606. M.M. acknowledges financial support from FONDECYT Regular 1241818. S.P. acknowledges support from FONDE-CYT grant 1231663 and ANID – Millennium Science Initiative Program – Center Code NCN2024_001. A.Z. acknowledges support from ANID – Millennium Science Initiative Program – Center Code NCN2024_001 and Fondecyt Regular grant number 1250249.
References
- Aoyama, Y., Ikoma, M., & Tanigawa, T. 2018, ApJ, 866, 84 [NASA ADS] [CrossRef] [Google Scholar]
- Avenhaus, H., Quanz, S. P., Garufi, A., et al. 2018, ApJ, 863, 44 [NASA ADS] [CrossRef] [Google Scholar]
- Bohn, A. J., Benisty, M., Perraut, K., et al. 2022, A&A, 658, A183 [NASA ADS] [CrossRef] [EDP Sciences] [Google Scholar]
- Casassus, S., Christiaens, V., Cárcamo, M., et al. 2021, MNRAS, 507, 3789 [CrossRef] [Google Scholar]
- Cazzoletti, P., van Dishoeck, E. F., Pinilla, P., et al. 2018, A&A, 619, A161 [NASA ADS] [CrossRef] [EDP Sciences] [Google Scholar]
- Christiaens, V., Ubeira-Gabellini, M. G., Cánovas, H., et al. 2021, MNRAS, 502, 6117 [NASA ADS] [CrossRef] [Google Scholar]
- Christiaens, V., Gonzalez, C., Farkas, R., et al. 2023a, J. Open Source Softw., 8, 4774 [NASA ADS] [CrossRef] [Google Scholar]
- Christiaens, V., Hammond, I., Juillard, S., Kokoulina, E., & Balsalobre-Ruza, O. 2023b, Astrophysics Source Code Library [record ascl:2311.002] [Google Scholar]
- Close, L. M., van Capelleveen, R. F., Weible, G., et al. 2025, ApJ, 990, L9 [Google Scholar]
- Cuello, N., Dipierro, G., Mentiplay, D., et al. 2019, MNRAS, 483, 4114 [Google Scholar]
- Cugno, G., Leisenring, J., Wagner, K. R., et al. 2024, AJ, 167, 182 [NASA ADS] [CrossRef] [Google Scholar]
- Currie, T., Hashimoto, J., Aoyama, Y., et al. 2025, ApJ, 990, L42 [Google Scholar]
- Delorme, P., Meunier, N., Albert, D., et al. 2017, in SF2A-2017: Proceedings of the Annual meeting of the French Society of Astronomy and Astrophysics, eds. C. Reylé, P. Di Matteo, F. Herpin, E. Lagadec, A. Lançon, Z. Meliani, & F. Royer, 347 [Google Scholar]
- Dong, R., Zhu, Z., Rafikov, R. R., & Stone, J. M. 2015, ApJ, 809, L5 [Google Scholar]
- Dong, R., Najita, J. R., & Brittain, S. 2018, ApJ, 862, 103 [Google Scholar]
- ESO, 2024, ERIS User Manual, European Southern Observatory, version 116.0 [Google Scholar]
- Gaia Collaboration (Bailer-Jones, C. A. L., et al.) 2023, A&A, 674, A41 [NASA ADS] [CrossRef] [EDP Sciences] [Google Scholar]
- Galicher, R., Boccaletti, A., Mesa, D., et al. 2018, A&A, 615, A92 [NASA ADS] [CrossRef] [EDP Sciences] [Google Scholar]
- Garufi, A., Quanz, S. P., Avenhaus, H., et al. 2013, A&A, 560, A105 [CrossRef] [EDP Sciences] [Google Scholar]
- Garufi, A., Benisty, M., Pinilla, P., et al. 2018, A&A, 620, A94 [NASA ADS] [CrossRef] [EDP Sciences] [Google Scholar]
- Godoy, N., Olofsson, J., Bayo, A., et al. 2022, A&A, 663, A53 [NASA ADS] [CrossRef] [EDP Sciences] [Google Scholar]
- Gomez Gonzalez, C. A., Wertz, O., Absil, O., et al. 2017, AJ, 154, 7 [Google Scholar]
- Haffert, S. Y., Bohn, A. J., de Boer, J., et al. 2019, Nat. Astron., 3, 749 [Google Scholar]
- Hammond, I., Christiaens, V., Price, D. J., et al. 2023, MNRAS, 522, L51 [NASA ADS] [CrossRef] [Google Scholar]
- Juillard, S., Christiaens, V., & Absil, O. 2022, A&A, 668, A125 [NASA ADS] [CrossRef] [EDP Sciences] [Google Scholar]
- Juillard, S., Christiaens, V., Absil, O., Stasevic, S., & Milli, J. 2024, A&A, 688, A185 [NASA ADS] [CrossRef] [EDP Sciences] [Google Scholar]
- Keppler, M., Benisty, M., Müller, A., et al. 2018, A&A, 617, A44 [NASA ADS] [CrossRef] [EDP Sciences] [Google Scholar]
- Launhardt, R., Henning, T., Quirrenbach, A., et al. 2020, A&A, 635, A162 [NASA ADS] [CrossRef] [EDP Sciences] [Google Scholar]
- Lodato, G., & Rice, W. K. M. 2004, MNRAS, 351, 630 [Google Scholar]
- Maio, F., Fedele, D., Roccatagliata, V., et al. 2025, A&A, 699, L10 [NASA ADS] [CrossRef] [EDP Sciences] [Google Scholar]
- Maire, A.-L., Langlois, M., Dohlen, K., et al. 2016, SPIE, 9908, 990834 [Google Scholar]
- Maire, A.-L., Stolker, T., Messina, S., et al. 2017, A&A, 601, A134 [NASA ADS] [CrossRef] [EDP Sciences] [Google Scholar]
- Maire, A.-L., Langlois, M., Delorme, P., et al. 2021, J. Astron. Teles. Instrum. Syst., 7, 035004 [Google Scholar]
- Marois, C., Lafrenière, D., Doyon, R., Macintosh, B., & Nadeau, D. 2006, ApJ, 641, 556 [Google Scholar]
- Milli, J., Mouillet, D., Lagrange, A. M., et al. 2012, A&A, 545, A111 [NASA ADS] [CrossRef] [EDP Sciences] [Google Scholar]
- Montesinos, M., & Cuello, N. 2018, MNRAS, 475, L35 [NASA ADS] [CrossRef] [Google Scholar]
- Montesinos, M., Perez, S., Casassus, S., et al. 2016, ApJ, 823, L8 [Google Scholar]
- Muto, T., Grady, C. A., Hashimoto, J., et al. 2012, ApJ, 748, L22 [Google Scholar]
- Müller, A., van den Ancker, M. E., Launhardt, R., et al. 2011, A&A, 530, A85 [NASA ADS] [CrossRef] [EDP Sciences] [Google Scholar]
- Orban de Xivry, G., Absil, O., De Rosa, R. J., et al. 2024, SPIE Conf. Ser., 13097, 1309715 [Google Scholar]
- Price, D. J., Cuello, N., Pinte, C., et al. 2018, MNRAS, 477, 1270 [Google Scholar]
- Ren, B. B. 2023, A&A, 679, A18 [NASA ADS] [CrossRef] [EDP Sciences] [Google Scholar]
- Ren, B., Dong, R., van Holstein, R. G., et al. 2020, ApJ, 898, L38 [NASA ADS] [CrossRef] [Google Scholar]
- Ren, B. B., Xie, C., Benisty, M., et al. 2024, A&A, 681, L2 [NASA ADS] [CrossRef] [EDP Sciences] [Google Scholar]
- Shuai, L., Ren, B. B., Dong, R., et al. 2022, ApJS, 263, 31 [NASA ADS] [CrossRef] [Google Scholar]
- Stapper, L. M., & Ginski, C. 2022, A&A, 668, A50 [NASA ADS] [CrossRef] [EDP Sciences] [Google Scholar]
- Stolker, T., Dominik, C., Avenhaus, H., et al. 2016, A&A, 595, A113 [NASA ADS] [CrossRef] [EDP Sciences] [Google Scholar]
- Stolker, T., Sitko, M., Lazareff, B., et al. 2017, ApJ, 849, 143 [Google Scholar]
- Stolker, T., Bonse, M. J., Quanz, S. P., et al. 2019, A&A, 621, A59 [NASA ADS] [CrossRef] [EDP Sciences] [Google Scholar]
- van Capelleveen, R. F., Ginski, C., Kenworthy, M. A., et al. 2025, ApJ, 990, L8 [Google Scholar]
- van der Marel, N., Cazzoletti, P., Pinilla, P., & Garufi, A. 2016, ApJ, 832, 178 [Google Scholar]
- Wahhaj, Z., Milli, J., Romero, C., et al. 2021, A&A, 648, A26 [EDP Sciences] [Google Scholar]
- Xie, C., Ren, B., Dong, R., et al. 2021, ApJ, 906, L9 [NASA ADS] [CrossRef] [Google Scholar]
- Xie, C., Choquet, E., Vigan, A., et al. 2022, A&A, 666, A32 [NASA ADS] [CrossRef] [EDP Sciences] [Google Scholar]
- Xie, C., Xie, C., Ren, B. B., et al. 2024, Universe, 10, 465 [Google Scholar]
- Zhong, H., Ren, B. B., Ma, B., et al. 2024, A&A, 684, A168 [Google Scholar]
- Zhu, Z., Dong, R., Stone, J. M., & Rafikov, R. R. 2015, ApJ, 813, 88 [Google Scholar]
Appendix A JWST candidate
Cugno et al. (2024) presented a candidate protoplanet at a separation of 2″.2, detected with JWST in the 410M band only. Our reprocessing of the data, after a fine recentering of the images, recovers the candidate detection, with an SNR of 2.4 only. This candidate is unlikely to be the object driving the spirals as it does not match the orbital velocity measurements presented in Xie et al. (2024) and in this work, though that is not enough to rule out this hypothetical companion.
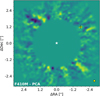 |
Fig. A.1 PCA image in the F410M filter captured with JWST-NIRCam. The candidate found by Cugno et al. (2024) is marked by the black cross. |
Appendix B Image gallery
All the datasets in our possession were systematically processed with algorithms that try to minimize as much as possible the biases related to ADI and preserve as well as possible the morphology of the disk. Figure B.1 shows the full gallery of images. Strategies to obtain the highest-fidelity images of the disk included using RDI when possible, combined with IPCA. Data imputation was also used, for the 2015 SPHERE dataset only.
We notice that the datasets with the smallest field rotation produce the worst images of the disk, especially if there is no reference star to enable an RDI strategy, in which case the disk is significantly self-subtracted and unrecoverable with our algorithms. This is the case for the two NACO observations captured in 2017. Even when we only use RDI and no ADI, we find that a sufficient field rotation is still beneficial, as illustrated by the difference in quality between the SPHERE 2024-03-06 (58° rotation) and SPHERE 2023-07-24 (12° rotation), despite similar seeing and observing time.
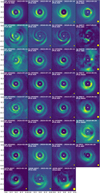 |
Fig. B.1 Gallery of the best disk images obtained for all datasets at all wavelengths bands available. The white star marks the center of the images and the yellow circles illustrate the resolution of each image. |
Appendix C True north correction
As the TN corrections are crucial for an accurate measurement of the spirals’ dynamics, Table C.1 contains the TN values we used for each instrument.
TN corrections applied.
Appendix D Twist position
We measured the position of the twist in every dataset and wavelength bands, except for the two NACO observations in 2017 that do not detect the disk well enough. Figure D.1 shows its position, with the associated uncertainties, for all epochs and wavelengths bands, illustrating its motion over time.
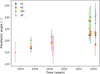 |
Fig. D.1 Position of the twist found in S1 as a function of time. |
Appendix E S1 blob motion
We measured the FWHM of the S1 arm in every dataset and found a correlation between the twist position and the wider section of the S1 arm. However, we were not able to show conclusively that this blob is moving along with the twist, as shown in Fig. E.1, though there seems to be some hint of motion in the same direction expected as the twist. This is visualized in Fig. E.2. The uncertainties on our measurements and the variations from one dataset to another, probably due to the recovery of the disk signal not being perfect with IPCA, or due to variable shadowing effects on the disk, prevent a rigorous measurement of the blob motion. Additional high-quality observations and observing time comparable to the 2015 dataset would be needed to obtain more robust measurements. We do not reliably detect this blob in Lp band, while it is best seen in YJH band, which we attribute to the angular resolution.
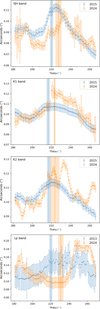 |
Fig. E.1 Measured FWHM of the S1 arm at all available wavelengths. The vertical lines along with the shaded areas on either side represent the twist position and its associated uncertainties. |
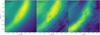 |
Fig. E.2 Close-up of the blob in YJH band in three different epochs. The location of the twist and its associated uncertainties are marked by the black cross, visualizing the apparent connection between the twist and the wider section of S1. |
All Tables
All Figures
|
Fig. 1 Image gallery of the HD 135344B protoplanetary disk at different wavelengths for multiple datasets. The central star is masked and marked by a white star marker. All of the images were processed using IPCA, except for the images in the YJH bands. North is up, east is left. The yellow circles indicate the spatial resolution of each image. |
| In the text | |
|
Fig. 2 View of the protoplanetary disk of HD 135344B at different wavelengths, postprocessing the 2015 coronagraphic SPHERE dataset with PCA-data imputation, which is the dataset that provides the best-quality images of the disk. The different spiral arms are labeled, along with a noticeably brighter region of S1 named the S1 blob. The images were r2-scaled and deprojected, and the center of the images is marked by the white star. The yellow circles indicate the beam size in the IRDIS data, with the black oval the ALMA beam size. The white circle marks the position of the twist. The traces extracted from the image in the K1 band are illustrated in blue. Overplotted with the K2 filter are the 4-sigma contours of the ALMA image from Casassus et al. (2021), deprojected assuming no flaring since submillimeter continuum observations trace the midplane, and rotated according to the 0.85° yr−1 value found in Xie et al. (2024), highlighting the overlap between the twist and the dust filament. |
| In the text | |
|
Fig. 3 Spiral traces in polar coordinates in the K1 filter in the deprojected images. Theta is the angle measured counterclockwise from north of the central star. In black, labeled ∆r, the typical trace uncertainty, not shown on each data point to improve readability. |
| In the text | |
|
Fig. 4 Spirals traces in polar coordinates for the same observation (SPHERE 2015) at different wavelengths. Theta is the angle measured counterclockwise from north of the central star. Contrary to Fig. 3, images were not deprojected here. S3 is not included as it was not well detected in all wavelength bands. In black, labeled Δr, the typical trace uncertainty, not shown on each data point to improve readability. |
| In the text | |
|
Fig. 5 Zoomed-in view of the spirals trace for the 2015 SPHERE observation. A single and two-spiral fit are compared. The vertical line shows the break point (the twist) found by the model between the two spirals for the two-spiral fit, along with its uncertainties in the shaded area. |
| In the text | |
|
Fig. 6 FWHM of S1 in the K1 filter, and measured in the 2015 SPHERE observation. The break point indicating the detected twist is also shown and is located exactly where the spiral arm is wider. |
| In the text | |
|
Fig. 7 ERIS images processed with PCA (left) and IPCA (right). The center of the images is masked and marked by the white star marker. The candidate found in Maio et al. (2025), detected as they did in the left image with PCA, is marked by the red cross on both images. |
| In the text | |
|
Fig. 8 NACO images produced with IPCA (left) from which the disk was extracted to inject in a NACO reference datacube. PCA-processed image of the fake datacube (right). The location of the candidate found by Maio et al. (2025) is marked by the red cross, while the black cross marks point-like artifacts generated by the ADI postprocessing, which also exhibit what could be interpreted as negative side lobes. The white star marks the center of the images while the yellow circle illustrate the size of the FWHM. |
| In the text | |
|
Fig. A.1 PCA image in the F410M filter captured with JWST-NIRCam. The candidate found by Cugno et al. (2024) is marked by the black cross. |
| In the text | |
|
Fig. B.1 Gallery of the best disk images obtained for all datasets at all wavelengths bands available. The white star marks the center of the images and the yellow circles illustrate the resolution of each image. |
| In the text | |
|
Fig. D.1 Position of the twist found in S1 as a function of time. |
| In the text | |
|
Fig. E.1 Measured FWHM of the S1 arm at all available wavelengths. The vertical lines along with the shaded areas on either side represent the twist position and its associated uncertainties. |
| In the text | |
|
Fig. E.2 Close-up of the blob in YJH band in three different epochs. The location of the twist and its associated uncertainties are marked by the black cross, visualizing the apparent connection between the twist and the wider section of S1. |
| In the text | |
Current usage metrics show cumulative count of Article Views (full-text article views including HTML views, PDF and ePub downloads, according to the available data) and Abstracts Views on Vision4Press platform.
Data correspond to usage on the plateform after 2015. The current usage metrics is available 48-96 hours after online publication and is updated daily on week days.
Initial download of the metrics may take a while.