| Issue |
A&A
Volume 699, July 2025
|
|
|---|---|---|
| Article Number | A130 | |
| Number of page(s) | 11 | |
| Section | Stellar structure and evolution | |
| DOI | https://doi.org/10.1051/0004-6361/202553748 | |
| Published online | 01 July 2025 | |
An investigation into the X-ray bursts in Cir X-1
1
College of Physics and Electronic Engineering, Qilu Normal University, 250200 Jinan, People’s Republic of China
2
Key Laboratory of Particle Astrophysics, Institute of High Energy Physics, Chinese Academy of Sciences, 100049 Beijing, People’s Republic of China
3
Dongguan Neutron Science Center, 1 Zhongziyuan Road, Dongguan 523808, People’s Republic of China
4
School of Astronomy and Space Science and Key Laboratory of Modern Astronomy and Astrophysics, Nanjing University, 210023 Nanjing, People’s Republic of China
5
University of Chinese Academy of Sciences, Chinese Academy of Sciences, 100049 Beijing, People’s Republic of China
⋆ Corresponding authors: yuzl@ihep.ac.cn, szhang@ihep.ac.cn
Received:
14
January
2025
Accepted:
25
May
2025
We report 155 X-ray bursts from Cir X-1 detected with NICER and 48 with Insight-HXMT, respectively. The K-medoids clustering algorithm was applied to X-ray bursts detected by NICER for classification. These X-ray bursts are classified into two categories, designated as Class A and B. The profile of Class A resembles that of a typical type I X-ray burst. Class B is weaker and its profile is approximately symmetric. In these X-ray bursts, the shortest recurrence time of ∼300 s observed to date in Cir X-1 is detected. Additionally, no burst is detected prior to MJD 58933 in NICER and Insight-HXMT. The underlying reason for this phenomenon remains unclear and requires further investigation.
Key words: binaries: general / stars: individual: Cir X-1 / X-rays: bursts
© The Authors 2025
 Open Access article, published by EDP Sciences, under the terms of the Creative Commons Attribution License (https://creativecommons.org/licenses/by/4.0), which permits unrestricted use, distribution, and reproduction in any medium, provided the original work is properly cited.
This article is published in open access under the Subscribe to Open model. Subscribe to A&A to support open access publication.
1. Introduction
After its discovery, Cir X-1 was identified as an accreting black hole in an X-ray binary (Toor 1977). However, the discovery of type I X-ray bursts in Cir X-1 (Tennant et al. 1986a,b) and the subsequent confirmation with good angular resolution (Linares et al. 2010) established that its compact star is a neutron star (NS) with a weak magnetic field. Type I X-ray bursts are commonly observed in low-mass X-ray binaries (LMXBs). Additionally, some characteristics typically observed in high-mass X-ray binaries (HMXBs) are also present in Cir X-1, which makes it an unusual X-ray binary (XRB). Jonker et al. (2007) analyzed I-band observation data and proposed that the companion is a B5–A0 spectral type supergiant with an orbital period of ∼16.5 days and an orbital eccentricity of ∼0.45, which is also supported by the studies of Johnston et al. (2016) and Schulz et al. (2020). Moreover, the discovery of the natal supernova remnant of Cir X-1 makes it the youngest known XRB (< 4600 yr, Heinz et al. 2013).
X-ray bursts are generally classified into two categories: type I and type II. A type I X-ray burst is a thermonuclear flash on the surface of an accreting NS (see Strohmayer & Bildsten 2006, and reference therein). The accreted material accumulates on the surface of the NS firstly. When the conditions of the thermonuclear burning are satisfied, an ignition of H/He will occur, which then results in a type I X-ray burst. The flux in type I bursts exhibits a rapid increase from < 1 s to ∼10 s, followed by a power-law decay (Lewin et al. 1993; in’t Zand et al. 2014).
Different from the type I X-ray burst, the type II X-ray burst is rare in XRBs and exhibits little spectral evolution (Lewin et al. 1993). Currently, only two XRBs, the Rapid Burster (Lewin et al. 1976) and GRO J1744-28 (Kouveliotou et al. 1996), have been confirmed to exhibit type II X-ray bursts. The type II X-ray bursts may also be present in SMC X-1 (Angelini et al. 1991; Li & van den Heuvel 1997; Rai et al. 2018), but the identification remains unclear. The type II X-ray burst is believed to be caused by the accretion instability, but the detailed mechanism remains unclear. Some studies have indicated that the magnetic field plays an important role in the formation of type II X-ray bursts (e.g., Bagnoli et al. 2015; van den Eijnden et al. 2017).
Tennant et al. (1986a,b) discovered 11 X-ray bursts in Cir X-1. Three of these could be confirmed as the type I X-ray bursts, but the possibility that the remaining eight are the type II X-ray bursts could not be ruled out. Linares et al. (2010) detected 15 X-ray bursts, nine of which were identified as type I X-ray bursts. In this work, we search X-ray bursts with NICER and Insight-HXMT, and discuss their identifications.
2. Observations and data reduction
NICER covers the 0.2–12 keV energy band and has a large effective area below 4 keV (Gendreau et al. 2016), which is helpful to investigate the spectral evolution of X-ray bursts. We selected all data of Cir X-1 until the end of 2023. The observation dates are marked with vertical blue lines in Figure 1. The data were processed using NICER Data Analysis Software (NICERDAS version 2024-02-09_V012) with the CALDB version xti20240206. To mitigate the background influence, we set overonly_expr to 1.0. Light curves were generated using nicerl3-lc with a bin size of 1.0 s.
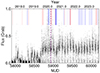 |
Fig. 1. Long-term light curves of Cir X-1 with MAXI from MJD 57900 to 60200. The vertical blue and red lines represent the observations with NICER and Insight-HXMT, respectively. The date of the vertical dashed purple line is MJD 58933. All found bursts in this work are posterior to this date. The low flux (∼0 Crab) observed in certain data points represents the dip in every orbit. |
Insight-HXMT (Zhang et al. 2020) carries three telescope: the Low Energy X-ray telescope (LE, 1–12 keV), the Medium Energy X-ray telescope (ME, 5–40 keV), and the High Energy X-ray telescope (HE, 20–250 keV). It has monitored Cir X-1 for ∼7 years. Similarly, we also selected all data from June 15, 2017 to December 31, 2023. The observation dates are marked with vertical red lines in Figure 1. The data were processed using the Insight-HXMT Data Analysis Software (HXMTDAS) v2.06 with the latest CALDB. Light curves were generated using the standard pipeline routine hpipeline with a bin size of 1.0 s. Total effective exposure times are 284 ks, 157 ks, and 353 ks for NICER, Insight-HXMT LE, and Insight-HXMT ME, respectively.
We searched for X-ray bursts by visually inspecting the light curve profiles from each observation, and 155 X-ray bursts in NICER and 48 X-ray bursts in Insight-HXMT are identified1. All identified X-ray bursts are posterior to MJD 58933, before which no X-ray burst is detected. The peak count rates exceed the persistent count rates about 20–30 counts s−1 and 50–150 counts s−1 for X-ray bursts in Insight-HXMT and NICER, respectively. It was hard to analyze the spectral evolution of the X-ray bursts in Insight-HXMT due to their poor statistical qualities2, so we focused on the X-ray bursts in NICER in this work.
Some X-ray bursts are not completely covered by observation. And there is a notable variation in the persistent count rate in some bursts. Both are not beneficial to the spectral analysis, so it is necessary to apply a filter to the sample of NICER X-ray bursts. Firstly, if the persistent count rate was not stable, the burst would be removed from our sample3. Secondly, in order to eliminate the effect of the fluctuation, the Savitzky-Golay filter (Savitzky & Golay 1964) was applied to the light curves in order to obtain the peak time, tpeak, for each burst, where a fourth-order polynomial4 was fit with a window size of 31 s. The time of maximum count rate of the filtered light curve during the burst was selected as the peak time. Additionally, it was ensured that each burst contained complete data from tpeak−50 s to tpeak+100 s, otherwise the burst was excluded. Finally, a sample of 117 X-ray bursts was obtained.
In these X-ray bursts, roughly two types of profiles could be identified in NICER light curves. The first type exhibits a rapid rise with a slow decay, while the second type shows a relatively symmetrical profile. The peak count rate in the first type (∼150 counts s−1) is typically higher than that in the second type (∼100 counts s−1). Two representative bursts are presented in Figure 2.
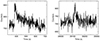 |
Fig. 2. Two representative bursts in NICER light curves. The x axis represents the time since the observation starts. |
The analysis of the spectral evolution of a single X-ray burst is challenging, so we attempted to merge multiple X-ray bursts to enhance the statistics. Before that, it is necessary to classify these X-ray bursts according to the two types of profiles5.
3. Methodology and results of classification
In this section, we attempted to classify these X-ray bursts based on their profiles. At first, the mean count rate between tpeak−50 s and tpeak−30 s was regarded as the background for each burst. With the background subtracted, the profiles of X-ray bursts became comparable. Then these X-ray bursts were aligned with the time tpeak. In this work, we defined:
where r1i, r2i, e1i, and e2i represent the count rate of two X-ray bursts and their errors, respectively. For two aligned X-ray burst light curves, ξ could be calculated based on the above equation, where t1 = tpeak − 30 s, tN = tpeak + 100 s, and N = 131. If two X-ray burst profiles were similar to each other, ξ would be about 1, otherwise ξ would be significantly greater than 1. Accordingly, ξ could be used to classify these X-ray bursts.
The K-medoids clustering algorithm (Kaufmann & Rousseeuw 1987) divides a series of data points into k partitions. The clustering algorithm could be described by:
where the total distance, D, is required to be minimized. One data point, mi, is chosen as the medoid in each part, Ci, then the above equation could be used to calculate the total distance. This process is repeated until the total distance between data points and the closest medoids is minimal. The property of ξ for two bursts is analogous to dist(xj, mi), thus ξ could be regarded as the distance between two X-ray bursts. Accordingly, the K-medoids clustering algorithm could be applied to the X-ray burst classification. Based on the two typical profiles, these X-ray bursts are classified into two categories, designated as Class A and B. In practice, a K-mean style algorithm (a kind of K-medoids clustering algorithm, see e.g., Schubert & Rousseeuw 2019) was employed to obtain the classification, where the number of clusters was fixed at 2. To obtain the optimal classification, 10 000 groups of different initial medoids were used. A classification could be obtain in each group through iteration. The classification with the minimum total distance was selected as the optimal one. The results are presented in Table A.1, and the mean count rates for the two classes are shown in Figure 36. Class A and Class B contain 39 and 78 bursts, respectively. The mean peak count rate in Class A (∼130 counts s−1) is significantly higher than that in Class B (∼80 counts s−1). The distributions of the background count rate for the two classes of X-ray bursts are presented in Figure 4. A Kolmogorov-Smirnov test was applied to the two distributions, resulting in a p-value of 0.09. The results indicate that there is no significant difference between the two classes of X-ray bursts in the background count rate.
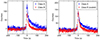 |
Fig. 3. Mean count rates for two classes of bursts. The background interval is marked in gray. The tpeak is set to 0. The count rate of Class B is multiplied by 1.53 in the right panel. |
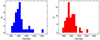 |
Fig. 4. Distributions of the background count rate for the two classes of X-ray bursts. The x and y axes represent the background count rate and the number of X-ray bursts, respectively. Class A and B are marked in blue and red, respectively. |
In order to investigate more closely the discrepancy in profiles between the two classes, the mean count rate was multiplied by a factor of 1.53 for Class B, thereby aligning the peak count rate between the two classes. The results are presented in Figure 3. The profiles exhibit similarities prior to ∼tpeak + 15 s, with Class B showing a more rapid decline after that.
4. Spectral analysis
For these observations listed in Table A.1, nicerl3-spec was employed to obtain the X-ray spectra with SCORPEON selected as the background model7, where spectra were grouped using the optimal binning option (Kaastra & Bleeker 2016) with a minimum of 10 counts per bin. The abundance table was set to aspl (Asplund et al. 2009) in the spectral model. A simple model was adopted to obtain the column density of the intrinsic absorption component. The used model was tbabs*phabs*(diskbb+bbodyrad+gaussian), where tbabs and phabs components represented the interstellar absorption and the intrinsic absorption, respectively. The diskbb component represented the blackbody emission from the accretion disk. The bbodyrad component represented the blackbody emission from the boundary layer and/or the NS surface. The gaussian component allowed for a potential spectral line feature. In the spectral fitting, the column density of the interstellar absorption was fixed to 1.8 × 1022 cm−2 (Heinz et al. 2013). The best-fits show that the column density of the intrinsic absorption ranges from 0.8 to 1.4 × 1022 cm−2, and there is no significant difference in the intrinsic absorption across these observations.
In order to investigate the spectral evolution of X-ray bursts, we firstly extracted the time-resolved spectra in 1 s steps8. With the peak time of each burst aligned, the spectra from the same intervals were combined for Class A and B, respectively. The data from tpeak − 50 s to tpeak − 25 s were considered as the background. Then, we performed the best-fits with the model tbabs*phabs*bbodyrad, where the column density of the intrinsic absorption phabs was fixed to 1022 cm−2. If the blackbody component could not be constrained, the time step would be extended until the parameters could be constrained. The parameters derived from the time-resolved spectroscopy are presented in Figure 5, where the radius of the blackbody component was calculated with a distance of 9.4 kpc (Heinz et al. 2015). The temperature evolution is different between the two classes of X-ray bursts. Prior to the peak, an increase in the temperature is observed in Class A, while the temperature remains relatively constant in Class B. During the tail of X-ray bursts of Class A, the decay in temperature may be present, despite the trend not being prominent. During the tail of X-ray bursts of Class B, no significant variation is detected in temperature. The radius evolution is similar between the two classes. The radius increases gradually, followed by a subsequent decrease. The maximum radius is reached near the peak time. The maximum radii are 5 km and 4 km for Class A and B, respectively. It should be noted that the derived radius from fitting the faint burst spectrum may not accurately reflect the actual radius of an X-ray burst emission region (van Paradijs & Lewin 1986), therefore the maximum radii presented here are intended for reference only.
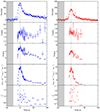 |
Fig. 5. Results from the time-resolved spectroscopy. Class A and B are marked in blue and red, respectively. The background intervals adopted in the spectral fitting are marked in gray. Each panel shows the net count rate, the blackbody temperature, the blackbody radius, the blackbody flux, and the reduced chi-square from the top to the bottom. |
5. Timing analysis
The barycenter-corrected event files were generated through the routine barycorr. The Z2 searching algorithm (Buccheri et al. 1983) was applied to each burst in the range of 10–2000 Hz. The time window was located near the peak time for each burst and its width was set to 10 s. No period is identified with a chance probability of being due to noise below 0.1%.
6. Properties of X-ray bursts
The α value is defined as the ratio of the persistent fluence between the X-ray bursts and the X-ray burst fluence. The occurrence of multiple X-ray bursts in a single observation permits the estimation of α. However, the existence of observational gaps between neighbor X-ray bursts of Class A precludes the determination of α. Nevertheless, a lower limit for Class A could be estimated. In the case of continuous observational data, where a single X-ray burst of Class A is present, the exposure time is typically ∼500 − 1000 s. It indicates that the recurrence time of Class A is at least 250 − 500 s. The persistent flux fpersistent was estimated using the data from tpeak − 50 s to tpeak − 25 s, and the average burst flux fburst was estimated using the data from tpeak − 10 s to tpeak + 100 s for each X-ray burst of Class A. The data from tpeak − 50 s to tpeak − 25 s were considered as the background of each X-ray burst. The employed models were tbabs*phabs*(diskbb+bbodyrad+gaussian) and tbabs*phabs*bbodyrad for the estimation of the persistent flux and the average burst flux, respectively. Finally, the estimated  , where fpersistent and fburst were estimated in the energy band between 0.01 and 100 keV9. Consequently, we derive a lower limit of α ranging from 8 to 58 for Class A, where relative error ranges from 15% to 45%. In contrast, no observational gap between some neighbor X-ray bursts is present in Class B. The light curves of NICER ObsId 3578010101 as an example are shown in Figure 6. With the X-ray bursts between 39 000 s and 40 000 s in NICER ObsId 3578010101, we could estimate α in Class B. The persistent flux was obtained using the data between 39 000 s and 40 000 s, and the average burst flux was estimated with the data from tpeak − 10 s to tpeak + 50 s. With the above process repeated, the derived α = 82 ± 21 and 210 ± 140 for the two X-ray bursts marked with vertical red lines between 39 000 s and 40 000 s in Figure 6. Furthermore, another attempt was made to estimate the α value using a standard way. The average burst fluence, F, was determined by integrating the burst light curve in Figure 5. The persistent flux, fpersistent, was estimated with the merged spectrum in the interval of tpeak − 50 s to tpeak − 25 s for Class A and B, respectively. The observed recurrence time, Δt, ranges from ∼300 s to ∼600 s in this work. The α value could be calculated using the formula
  . Given the recurrence time of 300 s, the average α value is estimated to be 49 ± 1 and 113 ± 3 for Class A and B, respectively. The α value is doubled with a recurrence time of 600 s. The estimated α values are consistent with those obtained through the aforementioned method, and also consistent with the α values estimated in Linares et al. (2010).
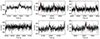 |
Fig. 6. Light curves of NICER ObsId 3578010101. The x axis represents the time since the observation starts. The vertical red lines indicate the peak time of X-ray bursts of Class B. Segments with a duration of less than 100 s are excluded. |
Linares et al. (2011) found that if the ratio of peak luminosity of burst to persistent luminosity β = Lpeak/Lpersistent 2 − 50 keV < 0.7, the X-ray bursts would exhibit a non-cooling tail. The β was estimated from the merged X-ray spectra, and the result shows β = 0.25 ± 0.02 and 0.18 ± 0.01 for Class A and B, respectively. These results suggest that all X-ray bursts detected in this work are non-cooling bursts. This finding supports the spectral evolution of Class B and may account for the relatively weak temperature decay observed in X-ray bursts of Class A.
The interval of X-ray bursts between 39 000 s and 40 000 s in ObsId 3578010101 indicates the potential existence of a mHz quasi-periodic oscillation (QPO), which may imply a quasi-periodic burning on the surface of the NS. These bursts exhibit a recurrence time of ∼300 s, which is the shortest recurrence time reported for Cir X-1 to date. Assuming the presence of a QPO, the corresponding frequency of the QPO is ∼3.3 mHz. The corresponding persistent luminosity is estimated to be ∼1.2 × 1038 erg s−1, which corresponds to ∼1.0 × 10⁻⁸ M⊙ yr−1 given that the mass and radius of the NS are 1.4 M⊙ and 10 km, respectively. We also investigated the correlation between the bolometric flux and the recurrence time. To obtain the recurrence time, some X-ray bursts removed in Section 2 were also included. As the duration of each segment in NICER is typically less than 1000 s, the recurrence time discussed here was limited to less than 1000 s. The bolometric flux was estimated by analyzing the spectrum from an exposure time of 100 s between two neighbor X-ray bursts10. The results are shown in Figure 7, which reveals that there is no correlation between the bolometric flux and the recurrence time.
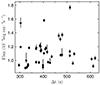 |
Fig. 7. Lack of correlation between the bolometric flux and the recurrence time. |
In order to investigate the occurrence of X-ray bursts, it is necessary to estimate the burst rate of Cir X-1 with respect to orbital phase. Given the absence of X-ray bursts prior to MJD 58933, the burst rate was estimated with observations posterior to MJD 58933 here. The related results are presented in Figures 8, where the burst rate was defined as the number of X-ray bursts per unit effective exposure time. The number of X-ray bursts was assumed to follow a Poisson distribution here. A significant variation in burst rate with respect to orbital phase is present. The burst rate in the phase between 0.4 and 0.8 is remarkably higher than that in the phase between 0 and 0.4. Additionally, we find that no X-ray burst is detected during the dip (ϕ ∼ 0.85 − 0.95).
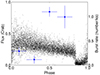 |
Fig. 8. Blue points represent the burst rate with respect to orbital phase. Poisson errors are adopted here. The burst rates are derived from 155 X-ray bursts observed by NICER. The folded light curves obtained from the MAXI light curve from MJD 58933 to 60200, where orbital phases are derived from the Nicolson (2007)’s ephemeris. |
7. Discussion
In comparison with previous studies, our sample includes numerous X-ray bursts, which could help us investigate the statistical properties of X-ray bursts in Cir X-1. Linares et al. (2010) identified 15 X-ray bursts in Cir X-1. The characteristics of nine X-ray bursts are consistent with those typically observed in type I X-ray bursts, while some other weak X-ray bursts shows approximately symmetric profiles. These characteristics are also present in our sample of X-ray bursts. The spectral evolution of Class A prior to the peak resembles that of identified type I X-ray bursts in Linares et al. (2010). However, the temperature decay is not prominent in Class A. This phenomenon may be attributed to the presence of some weak X-ray bursts in Class A. The spectral evolution of Class B is similar to that of weak X-ray bursts in Linares et al. (2010).
The nuclear reaction chain plays an important role in the profiles of thermal X-ray bursts, wherein the rp process is primarily responsible for the late nuclear burning. We employed in’t Zand et al. (2017)’s method to investigate whether the presence/absence of an rp process leads to different profiles of X-ray bursts of two classes. The decay data of X-ray bursts were fit with a two-parameter power law model and a power law plus a one-sided Gaussian model, respectively. The best-fit of a two-parameter power law model gives χν2(ν) = 0.88(21) and 1.13(7) for X-ray bursts of two classes, but that of a power law plus a one-sided Gaussian model gives χν2(ν) = 0.96(19) and 1.16(5)11. It means that the one-sided Gaussian component is not requisite for X-ray bursts in Cir X-1. The Gaussian component may be attributed to the rp process (in’t Zand et al. 2017). Therefore, our data do not support that the presence/absence of an rp process leads to different profiles of X-ray bursts of two classes, which requires further investigation.
The α value is typically in the range of ∼101 − 103 in type I X-ray bursts (Keek et al. 2010), which is consistent with that of X-ray bursts of both two classes in this work. It suggests that all X-ray bursts analyzed in this work may be classified as type I X-ray bursts. However, the lack of correlation between the recurrence time and the bolometric flux does not agree with the scenario of type I X-ray bursts. It may be attributed to that the estimated bolometric flux is derived from NICER observations, which may be not reliable due to the lack of hard X-ray spectra. Moreover, the burst rate with respect to the orbital phase also agrees with the scenario of thermonuclear burning. Yu et al. (2024) analyzed spectral properties of Cir X-1 around periastron (ϕ ∼ 0 − 0.1), and obtained the bolometric luminosity of Cir X-1 to be ∼1 Eddington luminosity (Flux < 0.5 Crab). It means that Cir X-1 may undergo stable burning around periastron, which would explain its relatively low burst rate. As Cir X-1 moves away from periastron, the accretion rate will decrease, resulting in a resumption of X-ray bursts. Furthermore, the long-term X-ray variation of Cir X-1 is also consistent with the scenario of type I X-ray bursts (see long-term light curves in Parkinson et al. 2003; Armstrong et al. 2013; Yu et al. 2024). The X-ray bursts are present in 1984–1985, in which the flux is significantly lower than 0.5 Crab. As Cir X-1 becomes brighter, it will enter a state of stable thermonuclear burning, leading to the cessation of type I X-ray bursts. When the accretion rate of Cir X-1 decreases, the recurrence time will lengthen, making the detection of type I X-ray bursts difficult. When the accretion rate of Cir X-1 increases, the recurrence time will decrease, facilitating the detection of X-ray bursts. However, we find that no X-ray burst is detected prior to MJD 58933 in NICER and Insight-HXMT. To investigate the reason for the absence of X-ray bursts, we initially present the folded light curve between MJD 58700 and 58933 in Figure 9. The observed flux during the orbital phase between 0.5 and 0.8 is comparable to that in the same phases posterior to MJD 58933. Its effective exposure time is ∼15.1 ks, and the expected burst number is ∼15. A test was conducted to estimate the possibility of no detected X-ray burst12 and the result shows p = 3 × 10⁻⁷. The presence of the disk wind and the dip in light curves indicates that Cir X-1 is a system with a high orbital inclination (Brandt & Schulz 2000; Schulz & Brandt 2002; Yu et al. 2024). Therefore, it is possible that the presence of additional gas blocking the X-ray emission may lead to the occurrence of weak X-ray bursts, which are difficult to detect. To investigate it further, we perform best-fits with the aforementioned model. The results indicate that there is no significant variation in the absorption column density. Therefore, the absence of X-ray bursts prior to MJD 58933 in NICER and Insight-HXMT remains a puzzle that requires further investigation.
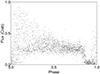 |
Fig. 9. Folded light curves obtained from the MAXI light curve from MJD 58700 to 58933, where orbital phases are derived from the Nicolson (2007)’s ephemeris. |
Data availability
The data used in this article from Insight-HXMT are available at http://hxmten.ihep.ac.cn
The spectra were also grouped using the optimal binning option (Kaastra & Bleeker 2016) with a minimum of 10 counts per bin, but the systematic error was not included here.


Acknowledgments
We thank the anonymous referee for the constructive suggestions that help to improve this work. This work made use of the data and software from the Insight-HXMT mission, a project funded by China National Space Administration (CNSA) and the Chinese Academy of Sciences (CAS). This research has made use of data and/or software provided by the High Energy Astrophysics Science Archive Research Center (HEASARC), which is a service of the Astrophysics Science Division at NASA/GSFC. This research has made use of the MAXI data provided by RIKEN, JAXA, and the MAXI team. This work is supported by the National Key R&D Program of China (2023YFB4503300), the National Key R&D Program of China (2021YFA0718500), and the National Natural Science Foundation of China under grants 12173103, 12333007, U2038101, and U1938103. This work is partially supported by the International Partnership Program of the Chinese Academy of Sciences (grant No. 113111KYSB20190020).
References
- Angelini, L., Stella, L., & White, N. E. 1991, ApJ, 371, 332 [NASA ADS] [CrossRef] [Google Scholar]
- Armstrong, R. P., Fender, R. P., Nicolson, G. D., et al. 2013, MNRAS, 433, 1951 [Google Scholar]
- Asplund, M., Grevesse, N., Sauval, A. J., & Scott, P. 2009, ARA&A, 47, 481 [NASA ADS] [CrossRef] [Google Scholar]
- Bagnoli, T., in’t Zand, J. J. M., D’Angelo, C. R., & Galloway, D. K. 2015, MNRAS, 449, 268 [NASA ADS] [CrossRef] [Google Scholar]
- Brandt, W. N., & Schulz, N. S. 2000, ApJ, 544, L123 [Google Scholar]
- Buccheri, R., Bennett, K., Bignami, G. F., et al. 1983, A&A, 128, 245 [NASA ADS] [Google Scholar]
- Gendreau, K. C., Arzoumanian, Z., Adkins, P. W., et al. 2016, in Space Telescopes and Instrumentation 2016: Ultraviolet to Gamma Ray, eds. J.-W. A. den Herder, T. Takahashi, & M. Bautz, SPIE Conf. Ser., 9905, 99051H [NASA ADS] [CrossRef] [Google Scholar]
- Heinz, S., Sell, P., Fender, R. P., et al. 2013, ApJ, 779, 171 [Google Scholar]
- Heinz, S., Burton, M., Braiding, C., et al. 2015, ApJ, 806, 265 [Google Scholar]
- in’t Zand, J. J. M., Cumming, A., Triemstra, T. L., Mateijsen, R. A. D. A., & Bagnoli, T. 2014, A&A, 562, A16 [CrossRef] [EDP Sciences] [Google Scholar]
- in’t Zand, J. J. M., Visser, M. E. B., Galloway, D. K., et al. 2017, A&A, 606, A130 [CrossRef] [EDP Sciences] [Google Scholar]
- Johnston, H. M., Soria, R., & Gibson, J. 2016, MNRAS, 456, 347 [Google Scholar]
- Jonker, P. G., Nelemans, G., & Bassa, C. G. 2007, MNRAS, 374, 999 [Google Scholar]
- Kaastra, J. S., & Bleeker, J. A. M. 2016, A&A, 587, A151 [NASA ADS] [CrossRef] [EDP Sciences] [Google Scholar]
- Kaufmann, L., & Rousseeuw, P. 1987, Data Analysis Based on the L1-Norm and Related Methods, 405 [Google Scholar]
- Keek, L., Galloway, D. K., in’t Zand, J. J. M., & Heger, A. 2010, ApJ, 718, 292 [Google Scholar]
- Kouveliotou, C., van Paradijs, J., Fishman, G. J., et al. 1996, Nature, 379, 799 [NASA ADS] [CrossRef] [Google Scholar]
- Lewin, W. H. G., Doty, J., Clark, G. W., et al. 1976, ApJ, 207, L95 [NASA ADS] [CrossRef] [Google Scholar]
- Lewin, W. H. G., van Paradijs, J., & Taam, R. E. 1993, Space Sci. Rev., 62, 223 [CrossRef] [Google Scholar]
- Li, X. D., & van den Heuvel, E. P. J. 1997, A&A, 321, L25 [Google Scholar]
- Linares, M., Watts, A., Altamirano, D., et al. 2010, ApJ, 719, L84 [Google Scholar]
- Linares, M., Chakrabarty, D., & van der Klis, M. 2011, ApJ, 733, L17 [Google Scholar]
- Nicolson, G. D. 2007, ATel, 985, 1 [Google Scholar]
- Parkinson, P. M. S., Tournear, D. M., Bloom, E. D., et al. 2003, ApJ, 595, 333 [NASA ADS] [CrossRef] [Google Scholar]
- Rai, B., Pradhan, P., & Paul, B. C. 2018, Res. Astron. Astrophys., 18, 148 [CrossRef] [Google Scholar]
- Savitzky, A., & Golay, M. J. E. 1964, Anal. Chem., 36, 1627 [Google Scholar]
- Schubert, E., & Rousseeuw, P. J. 2019, in Similarity Search and Applications, eds. G. Amato, C. Gennaro, V. Oria, & M. Radovanović (Cham: Springer International Publishing), 171 [Google Scholar]
- Schulz, N. S., & Brandt, W. N. 2002, ApJ, 572, 971 [Google Scholar]
- Schulz, N. S., Kallman, T. E., Heinz, S., et al. 2020, ApJ, 891, 150 [Google Scholar]
- Strohmayer, T., & Bildsten, L. 2006, Compact Stellar X-ray Sources, 39, 113 [NASA ADS] [CrossRef] [Google Scholar]
- Tennant, A. F., Fabian, A. C., & Shafer, R. A. 1986a, MNRAS, 221, 27P [Google Scholar]
- Tennant, A. F., Fabian, A. C., & Shafer, R. A. 1986b, MNRAS, 219, 871 [NASA ADS] [CrossRef] [Google Scholar]
- Toor, A. 1977, ApJ, 215, L57 [Google Scholar]
- van den Eijnden, J., Bagnoli, T., Degenaar, N., et al. 2017, MNRAS, 466, L98 [NASA ADS] [CrossRef] [Google Scholar]
- van Paradijs, J., & Lewin, H. G. 1986, A&A, 157, L10 [NASA ADS] [Google Scholar]
- Yu, Z. L., Zhang, S., Chen, Y. P., et al. 2024, MNRAS, 527, 8029 [Google Scholar]
- Zhang, S.-N., Li, T., Lu, F., et al. 2020, Sci. China Phys., Mech. Astron., 63, 249502 [Google Scholar]
Appendix A: Results of X-ray bursts classification
Result of the classification derived from K-medoids clustering algorithm
All Tables
All Figures
|
Fig. 1. Long-term light curves of Cir X-1 with MAXI from MJD 57900 to 60200. The vertical blue and red lines represent the observations with NICER and Insight-HXMT, respectively. The date of the vertical dashed purple line is MJD 58933. All found bursts in this work are posterior to this date. The low flux (∼0 Crab) observed in certain data points represents the dip in every orbit. |
| In the text | |
|
Fig. 2. Two representative bursts in NICER light curves. The x axis represents the time since the observation starts. |
| In the text | |
|
Fig. 3. Mean count rates for two classes of bursts. The background interval is marked in gray. The tpeak is set to 0. The count rate of Class B is multiplied by 1.53 in the right panel. |
| In the text | |
|
Fig. 4. Distributions of the background count rate for the two classes of X-ray bursts. The x and y axes represent the background count rate and the number of X-ray bursts, respectively. Class A and B are marked in blue and red, respectively. |
| In the text | |
|
Fig. 5. Results from the time-resolved spectroscopy. Class A and B are marked in blue and red, respectively. The background intervals adopted in the spectral fitting are marked in gray. Each panel shows the net count rate, the blackbody temperature, the blackbody radius, the blackbody flux, and the reduced chi-square from the top to the bottom. |
| In the text | |
|
Fig. 6. Light curves of NICER ObsId 3578010101. The x axis represents the time since the observation starts. The vertical red lines indicate the peak time of X-ray bursts of Class B. Segments with a duration of less than 100 s are excluded. |
| In the text | |
|
Fig. 7. Lack of correlation between the bolometric flux and the recurrence time. |
| In the text | |
|
Fig. 8. Blue points represent the burst rate with respect to orbital phase. Poisson errors are adopted here. The burst rates are derived from 155 X-ray bursts observed by NICER. The folded light curves obtained from the MAXI light curve from MJD 58933 to 60200, where orbital phases are derived from the Nicolson (2007)’s ephemeris. |
| In the text | |
|
Fig. 9. Folded light curves obtained from the MAXI light curve from MJD 58700 to 58933, where orbital phases are derived from the Nicolson (2007)’s ephemeris. |
| In the text | |
Current usage metrics show cumulative count of Article Views (full-text article views including HTML views, PDF and ePub downloads, according to the available data) and Abstracts Views on Vision4Press platform.
Data correspond to usage on the plateform after 2015. The current usage metrics is available 48-96 hours after online publication and is updated daily on week days.
Initial download of the metrics may take a while.