| Issue |
A&A
Volume 670, February 2023
|
|
|---|---|---|
| Article Number | A87 | |
| Number of page(s) | 10 | |
| Section | Astrophysical processes | |
| DOI | https://doi.org/10.1051/0004-6361/202244984 | |
| Published online | 08 February 2023 | |
Type I X-ray bursts’ spectra and fuel composition from the atoll and transient source 4U 1730–22
1
Key Laboratory of Stars and Interstellar Medium, Xiangtan University, Xiangtan, 411105 Hunan, PR China
e-mail: This email address is being protected from spambots. You need JavaScript enabled to view it.
, This email address is being protected from spambots. You need JavaScript enabled to view it.
2
Key Laboratory of Particle Astrophysics, Institute of High Energy Physics, Chinese Academy of Sciences, 19B Yuquan Road, Beijing 100049, PR China
3
School of Physics and Astronomy, Sun Yat-Sen University, Zhuhai 519082, PR China
4
International Space Science Institute (ISSI), Hallerstrasse 6, 3012 Bern, Switzerland
5
Physikalisches Institut, University of Bern, Sidlerstrasse 5, 3012 Bern, Switzerland
Received:
16
September
2022
Accepted:
13
December
2022
Abstract
NICER observed two outbursts from the neutron star low-mass X-ray binary 4U 1730–22 in 2021 and 2022, which showed a similar spectral evolution in the hardness-intensity diagram. Seventeen type I X-ray bursts were identified in both outbursts. The X-ray burst spectra showed clear deviations from the blackbody model, firstly ∼10 s after onset. Adding the enhanced persistent emission due to the Poynting-Robertson drag or the reflection from the accretion disk both significantly improved the fitting results. We found that 12 out of 17 X-ray bursts showed the photospheric radius expansion (PRE) characteristic. Considering the nine PRE bursts out of ten X-ray bursts observed by Insight-HXMT, 78% of bursts from 4U 1730–22 exhibited PRE. According to the burst rise time, the duration, the local accretion rate, and the burst fuel composition estimated from recurrence time, we propose that these PRE bursts were powered by pure helium. From the touchdown flux of PRE bursts, we estimate the source distance of d = 7.54 ± 0.46(X = 0) kpc for a canonical neutron star with MNS = 1.4 M⊙ and RNS = 10 km.
Key words: X-rays: bursts / accretion, accretion disks / X-rays: binaries / X-rays: individuals: 4U 1730–22
© The Authors 2023
 Open Access article, published by EDP Sciences, under the terms of the Creative Commons Attribution License (https://creativecommons.org/licenses/by/4.0), which permits unrestricted use, distribution, and reproduction in any medium, provided the original work is properly cited.
This article is published in open access under the Subscribe-to-Open model. This email address is being protected from spambots. You need JavaScript enabled to view it. to support open access publication.
1. Introduction
Neutron stars (NSs) in low-mass X-ray binary (LMXB) systems accrete matter from a Roche-lobe overflowing low-mass companion star (M ≲ 1 M⊙; Frank et al. 1992). The accumulated matter on the NS surface can trigger unstable thermonuclear bursts, also known as type I X-ray bursts (see e.g., Lewin et al. 1993; Strohmayer & Bildsten 2006; Galloway & Keek 2021, for reviews). Based on the composition of the accreted fuel and the ignition depth, most of the observed type I X-ray bursts are burning mixed hydrogen and helium or pure helium. At a low local mass accretion rate, that is ṁ ≲ 10% of the local Eddington rate, a helium burst is triggered rapidly and energetically through a triple-alpha process, which only takes an ∼1 − 2 s rise time to reach the peak flux and lasts ∼10 − 20 s, where helium comes from either the donor, that is a helium white dwarf, or from the stable completion burning of hydrogen. The decay time of these bursts is attributed to the cooling of the NS photosphere resulting in a gradual softening of the burst spectrum. For a NS LMXB with a higher mass accretion rate, it usually occurs in mixed hydrogen and helium bursts triggered by thermally unstable helium ignition, where hydrogen is accreted faster than it is consumed through a hot CNO cycle limited by β decays, then the rise and decay are slower. For a review, readers can refer to Lewin et al. (1993) and Strohmayer & Bildsten (2006), for example.
The X-ray burst spectra can be described by blackbody radiation with temperatures in the range of kTbb ≈ 0.5 − 3 keV. For some energetic bursts, when the peak luminosity reaches the Eddington luminosity, their radiation pressure exceeds the gravitational potential on the NS surface, causing substantial photospheric radius expansion (PRE; Lewin et al. 1993). These PRE bursts are generally used as standard candles to phenomenologically determine the distance to the source (Kuulkers & den Hartog 2003). The touchdown moment and the cooling tail during PRE bursts have been used to constrain the NS mass-radius relation (Sztajno et al. 1987; Özel et al. 2009; Poutanen et al. 2014; Suleimanov et al. 2017; Li et al. 2015, 2018). From the X-ray burster MINBAR catalog, about 20% of ∼7000 observed bursts exhibit PRE bursts (Galloway 2020). In a few X-ray bursts, such as 4U 1820–30, 4U 1916–053, and 4U 1728–34, a large fraction of X-ray bursts showed PRE, believed to be powered by pure helium in a hydrogen-poor environment (see e.g., Galloway et al. 2008).
The X-ray source 4U 1730–22 was discovered in 1972 by Uhuru during an X-ray outburst (Forman et al. 1978; Cominsky et al. 1978). Based on its spectral evolution and quiescent spectrum, 4U 1730–22 was classified as a possible NS LMXB (Tanaka & Shibazaki 1996; Chen et al. 1997; Tomsick et al. 2007). After an ∼50 year-long quiescence state, in 2021 and 2022, 4U 1730–22 went into an ∼90 day and ∼280 day outburst, respectively. These two outbursts have been observed by the MAXI/Gas Slit Camera (GSC), Swift, the Neutron star Interior Composition Explorer (NICER; Gendreau & Arzoumanian 2017), and Insight-HXMT (Kobayashi et al. 2021; Kennea et al. 2021a,b; Iwakiri et al. 2021). Bult et al. (2021a) reported the discovery of a type I X-ray burst from 4U 1730–22, confirming its nature as a NS LMXB. NICER observed 17 type I X-ray bursts from 4U 1730–22 for both outbursts, and one of them showed a burst oscillation, confirming that the source is a transient LMXB, hosting a fast rotational NS with a spin frequency of ∼585 Hz (Li et al. 2022). Chen et al. (2023) reported ten type I X-ray bursts from 4U 1730–22 observed by Insight-HXMT, and they found that nine of them exhibited PRE. The burst spectra of five bright PRE bursts showed deviations from a blackbody below 3 keV and above 10 keV, which can be modeled either by enhanced persistent emission due to the Poynting-Robertson drag (Walker 1992; in’t Zand et al. 2013; Worpel et al. 2013) or through Comptonization of the burst emission by the corona. From the PRE bursts, they derived a source distance of ∼10.4 kpc, assuming peak luminosity at the Eddington value for a pure helium burst. The optical counterpart of 4U 1730–22 emits strong hydrogen emission lines with relatively low full-width half-maximum and weaker helium lines, suggesting that this source has a main sequence companion, a short orbit period of ≲2 − 3 h, and low inclination with respect to the line of sight (Russell et al. 2021; Strader et al. 2021).
In this work, we report the analysis of the 17 X-ray bursts 4U 1730–22 observed by NICER during its 2021 and 2022 outbursts. In Sect. 2, we describe the properties of the 2021 and 2022 outbursts and X-ray bursts, respectively. In Sect. 3, we analyze the persistent emission and time-resolved spectra for the X-ray bursts. In Sect. 4, we estimate the source distance and the burst fuel composition.
2. Observations
We analyzed all of the 4U 1730–22 NICER observations between modified Julian date (MJD) 59374–59455 for the 2021 outburst and between MJD 59624–59860 for the 2022 outburst, respectively. The ObsIDs include 4202200101–420220010134 for the 2021 outburst and 420220010134–420220010143, 5202200101–5202200122, and 4639010101–4639010215 for the 2022 outburst, which have the net unfiltered exposure time of 102 ks and 588 ks, respectively. We processed the NICER data by applying the standard filtering criteria using HEASOFT V6.30.1 and the NICER Data Analysis Software (NICERDAS).
We extracted 1-s binned light curves in the energy ranges between 0.5–10 keV, 2.0–3.8 keV, and 3.8–6.8 keV using the command xselect. We also calculated the hardness ratio between 2.0–3.8 keV and 3.8–6.8 keV. From the 2021 and 2022 outbursts, none were found to dip or eclipse. As published by Li et al. (2022), we identified 17 type I X-ray bursts, one during the 2021 outburst and 16 during the 2022 outburst, which are listed in Table 1.
Best-fitted parameters of all persistent spectra.
2.1. The 2021 and 2022 outbursts
In Fig. 1 the 2021 and 2022 outbursts’ light curves and hardness ratio are shown. All X-ray bursts have been removed from the light curve; however, the time of the detected bursts are indicated with arrows. To have a better coverage of the two outbursts, that is to say from the onset back to quiescence, we added the MAXI/GCS light curves in Fig. 1. These MAXI/GCS light curves are based on 1.0 d binned monitoring observations in the 2.0–20 keV energy band.
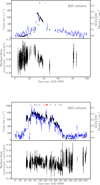 |
Fig. 1. Light curves and hardness ratio of 2021 (top panel) and 2022 (bottom panel) outbursts. In the top of each panel, we show the light curves in the 0.5–10 keV and 2.0–20.0 keV bands from NICER and MAXI observations, respectively. In the bottom, we show the NICER hardness ratio between 3.8–6.8 keV and 2.0–3.8 keV. Each black point means 64 s data of NICER and all bursts have been removed. The blue points represent the MAXI data. We marked the onset of all bursts observed by NICER and Insight-HXMT as black and red bars, respectively. |
In the 2021 outburst, during the first 25 days, the NICER source-count rate slowly increased from ∼40 c s−1 to ∼200 c s−1; afterwards, the flux rapidly raised within five days to ∼700 c s−1. After the outburst maximum, the count rate decreased within the next two months to a preoutburst flux level of ∼50 c s−1.
We found that the hardness ratio increased slowly from 0.25 to 0.35 during the first 25 days and, at the highest flux level, the hardness ratio decreased back to 0.25 to slightly rise again around 0.3 toward the end of the outburst (see Fig. 1). This is typical behavior of a LMXB atoll source in which the hardness ratio probably evolves as a function of the mass accretion rate (Hasinger & van der Klis 1989). The bottom panel of Fig. 1 shows the 2022 outburst observed by NICER between MJD 59620–59860. The raise of the outburst was missed by NICER, but observed by the MAXI/GSC monitoring program and reported in Fig. 1. Similar to the 2021 outburst, the flux raised rapidly to around ∼800 c s−1; afterwards, the flux fluctuated for ∼100 days around ∼700 c s−1, and then it slowly decreased to its preoutburst flux level. The hardness ratio followed the same pattern as the 2021 outburst. Indeed in Fig. 2 we show the hardness-intensity diagram (HID) of the 2021 and 2022 outburst from 4U 1730-022, following a spectral transition from a soft to hard state. The X-ray persistent fluxes followed a hardness ration correlation (spectral evolution) similar to other NS LMXB binary atoll sources (Falanga et al. 2006; Bult et al. 2018; Zhao et al. 2022). These two outbursts are quite similar in their hardness ratio and the HID, even though their durations are different. Moreover, the HIDs of two outbursts generally evolve in a counterclockwise direction. We note that the arrows mark the intensities and the hardness ratios prior to each X-ray burst (see Sect. 2.2). We also put the Insight-HXMT bursts in the HID, where the intensity and hardness ratio are taken from the NICER data closest to the Insight-HXMT burst onset.
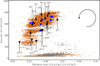 |
Fig. 2. HID of the 4U 1730–22 2021 and 2022 outbursts from NICER observations. The gray (brown) dots represent the outburst observed in 2021 (2022). All bursts have been removed, and each point represents a segment of 64 s. The HID of the persistent emission before each NICER X-ray burst are marked as black diamond points. The blue diamond points represent the Insight-HXMT bursts. The circle indicates the evolution direction of HID over time. |
2.2. The X-ray bursts’ light curves
For each X-ray burst, we first determined the burst peak count rate at the time where the count rate exceeded the preburst rate by a factor of 1.5. We define this time as the onset time of the X-ray burst. The preburst rate is defined as an average count rate in a 64 s window and 10 s prior to the burst peak rate. We determined the burst rise time as the time interval between the burst onset time and the first time bin whose count rates exceed 90% of the peak count rate. We note that to measure the burst rise time, we used 0.125 s binned light curves instead of a 1 s bin. The burst end time was calculated at the point where the burst count rate decayed to the preburst level. Specifically, we searched the first time bin whose count rate was within 1σ of the preburst rate after the onset time of 20 s. In Fig. 3, we show the net 0.5–10 keV 1–s light curves of all X-ray bursts relative to their onset time. We note that part of the tail in burst #3 was truncated due to the NICER data gap. The source persistent emission is considered as the background and subtracted from the burst count rate. From the burst spectral analysis, we could distinguish the non-PRE and PRE bursts as is detailed in Sects. 3.2.1 and 3.2.2, respectively. Bursts #1–2, #6–7, and #11 are non-PRE bursts, with a 3.5–6 s rise time to a burst peak count rate of about 3000 c s−1. The PRE bursts have a shorter rise time, ∼0.5 − 2 s, and a higher peak rate of ∼6000 − 8000 c s−1. The rise time, peak rate, and observed recurrence time of all bursts are listed in Table 2. Burst #2 was the first burst to be observed during the 2022 outburst, and therefore it did not experience recurrence. We note that, due to the relatively short exposures of each NICER observation, we did not observe successive bursts in a single continuous exposure; therefore, to have the most accurate recurrence time, we also report the ten burst start time observed by Insight-HXMT in Table 2 (Chen et al. 2023).
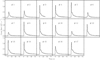 |
Fig. 3. Light curve of the 17 X-ray bursts from 4U 1730–22 observed with NICER. Black lines are light curves in 0.5–10 keV and they were binned at 1 s time resolution. Light curves were relative to the burst onset time and subtracted the persistent emission. The gray dashed-dotted line represents the persistent emission. |
Burst parameters’ overview.
3. Spectral analysis
For this work, we performed the spectra analysis using Xspec v12.12.0 (Arnaud 1996). The instrumental background spectra were extracted from the tool nibackgen3C50 (Remillard et al. 2022). We generated the ancillary response files (ARFs) with the tool nicerarf and response matrix files (RMFs) with the tool nicerrmf. The errors of all parameters are quoted at the 1σ confidence level.
3.1. Preburst persistent emission
For all 17 observed X-ray bursts in 4U 1730–22, we extracted a 128 s long preburst persistent emission spectra. We performed the optimal binning for each persistent spectrum by using ftgrouppha as suggested by the NICER team. Then we adopted the thermally Comptonized continuum model, nthcomp (Zdziarski et al. 1996; Życki et al. 1999), modified by the TübingenBoulder model, TBabs, with abundances from Wilms et al. (2000) to fit all persistent spectra. The model parameters include the asymptotic power law index, Γ, the electron temperature, kTe, the seed photon temperature, kTbb, seed, the input type of seed photons, and the normalization for nthcomp, as well as the equivalent hydrogen column, NH, for TBabs. We applied a joint fit to all persistent spectra, where we tied the absorption column density across all spectra, but let the parameters of the nthcomp model vary for each spectrum (see e.g., Bult et al. 2021b). The red χ2 are around unity, indicating that the persistent spectra are well fitted by the nthcomp model. We found the absorption column density at NH = (0.413 ± 0.004)×1022 cm−2, which is well consistent with the value  from the Chandra observations (Tomsick et al. 2007). The prebursts’ persistent spectra showed similar parameters, that is the seed photon temperatures, kTbb, seed ∼ 0.36 keV, and the power law index, Γ ∼ 1.8 − 2.2. We also calculated the unabsorbed bolometric flux in the energy range of 0.1–250 keV by using the tool cflux. The best-fit parameters are listed in Table 1 and, in the top panel in Fig. 4, we show one best-fit preburst persistent emission spectrum (burst #5). We also generated two persistent spectra from the top right – with the rate ∼ 816 c s−1 and hardness ratio ∼0.32 – and from the bottom left – with the rate ∼ 38 c s−1 and hardness ratio ∼0.27 – part in HID, with the total exposure of 256 s and 800 s, respectively. The above-mentioned model can also fit the spectra very well by using the same NH (see the bottom panel in Fig. 4). The black dash-dotted line, which is the black solid model multiplied by 20, is slightly softer than the red solid line, indicating the hardness ratio difference between these two spectra.
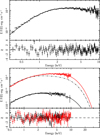 |
Fig. 4. Persistent spectra of 4U 1730–22. Top panel: preburst persistent spectrum in the energy range 0.3–10 keV and the best-fit models, Tbabs × nthcomp, for burst #5. Bottom panel: red points are the persistent spectrum produced from the observations on top right of HID with the exposure of 256 s, while the black points are from the bottom of HID with the exposure of 800 s. The solid lines are the best-fit models for each spectrum. The same models were used. The black dash-dotted line is the black solid model multiplied by 20. The residuals of the best-fit model to the data are plotted. |
3.2. X-ray burst time-resolved spectroscopy
To investigate the time-resolved spectroscopy during X-ray bursts, we extracted the burst spectra with the exposure time varying between 0.125–4 s, to guarantee each spectrum had at least 2000 counts in the energy range between 0.3–10 keV. All burst spectra were grouped using grappha with a minimum count of 20. To fit the burst spectra, we first used an absorbed blackbody model, TBabs × bbodyrad, where we regarded the persistent spectra being the background and remaining unchanged during bursts. The bbodyrad model has two parameters, the blackbody temperature, Tbb, and the normalization, K. We fixed the hydrogen column density at 0.413 × 1022 cm−2. We found that the blackbody model can fit the spectra well during the cooling tail. However, for the first ∼10 s of all 17 X-ray bursts, the model could not fit the spectra below 1.5 keV and above 5 keV. The red χ2 are higher than unity (see the gray dashed lines in Figs. 5 and 6). The fit can be significantly improved by using the enhanced persistent emission model (see Sect. 3.2.1) or by adding a reflection component from the surrounding accretion disk (see Sect. 3.2.2).
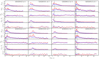 |
Fig. 5. Time-resolved spectroscopy using the fa model (red dot) and the disk reflection model (blue square) for bursts #1–8. For each panel, from top to bottom, we exhibit the burst bolometric flux, Fburst; the blackbody temperature, kTbb, and the blackbody radii, Rbb, which were calculated using a distance of 7.54 kpc; the enhanced persistent emission flux and disk reflection flux, Ffa and Frefl, respectively; and the goodness of fit per degree of freedom, red χ2. The gray dashed-dotted lines mean the persistent emission level, and the black dashed lines label the touchdown moment of the fa model. The red χ2 of the blackbody model are plotted as a gray dashed line for comparison. |
3.2.1. Enhanced persistent emission
To account for the residuals of the blackbody burst fit, we adopted the following best-fit fa model composed of TBabs × (bbodyrad + fa × nthcomp). The nthcomp accounts for the persistent emission during the burst, and its parameters are fixed to the best-fitted values listed in Table 1. We assumed that the amplitude of the persistent emission can change during bursts. In this case, only the instrumental background was subtracted. The parameter fa is a free scaling factor that can be used to account for the persistent emission variation. If fa = 1, this means that the amplitude of persistent emission during the burst is equal to the value before the burst. We show the best-fit values of all bursts by using the fa method in Figs. 5 and 6, where the red χ2 of the blackbody model is plotted for comparison. For all bursts, the fa values rise at the burst start and quickly reach the maximum within a few seconds; then they decrease slowly and return to around unity during the cooling tail. This indicates that during the expansion phase, due to the X-ray burst radiation, the persistent emissions rapidly enhanced, and then returned to the preburst level during the cooling tail. Based on the time-resolved spectra, we found that 12 out of 17 X-ray bursts showed significant PRE (Galloway et al. 2008). For these 12 bursts, the blackbody radii expanded at the burst start and reached the maximum at around 20 km. When the atmosphere moved back to the NS surface, the blackbody temperature increased to its peak and the blackbody radii decreased to its local minimum which corresponds to the touchdown moment. Afterwards, the atmosphere temperature decreased and the blackbody radii were around 10 km, implying that the whole NS surface cooled down.
We measured the bolometric flux at the touchdown moment for all 12 PRE bursts. We obtained the burst fluence, Eb, by summing the measured flux over the burst. The peak flux, Fpeak, the bolometric flux at the touchdown moment, FTD, and the burst fluence of each burst are listed in Table 2.
3.2.2. The disk reflection model
We can also explain the deviations of the blackbody model to the burst spectra by adding a disk reflection component. We used the advanced model relxillNS to account for the disk reflection, which calculates a photoionized accretion disk illuminated by blackbody spectra radiated from a NS (García et al. 2022). The relxillNS model has been used to fit the continuum of a black hole and NSs in LMXBs (Ludlam et al. 2019; Connors et al. 2020), and also to explain the contribution from the accretion disk reflecting the burst radiation in 4U 1636–536 (Zhao et al. 2022). We used the model TBabs × (bbodyrad + nthcomp + relxillNS) to fit the spectrum of the burst, where the blackbody, nthcomp, and relxillNS account for the X-ray burst emission, the persistent emission, and the reflection of the burst photons from the accretion disk, respectively. The parameters of nthcomp were fixed to the best-fit values reported in Table 1. The parameters of the relxillNS model are difficult to constrain simultaneously because the exposure of each burst spectrum is very short. Only the normalization of relxillNS is free to change. We fixed the indices of emissivity for the coronal flavor models, q1 = q2 = 3, and the break radius between these two emissivity indices, Rbr = 15. Assuming canonical NS mass MNS = 1.4 M⊙ and radius RNS = 10 km, as well as the observed spin frequency of 584.65 Hz (Li et al. 2022), we obtained the dimensionless spin parameter, a = 0.27. We assumed an inclination angle from the system to the observer of i = 30°, the inner and outer radii of the accretion disk, Rin = RISCO and Rout = 400Rg, where RISCO is the innermost stable circular orbit (ISCO) and Rg = GMNS/c2 is the gravitational radius, G is the gravitational constant, and c is the speed of light. We fixed the ionization parameter of the accretion disk at log ξ = 3.2, the solar iron abundance, AFe = 4.5, and the logarithmic value of the density, log n = 1016 cm−3. The temperature of input spectrum kTBB, seed is tied with the temperature of bbodyrad. We set the reflection fraction parameter frefl = −1, which means only the reflection emission was returned.
The fitted parameters of the disk reflection model are shown in Figs. 5 and 6 and marked as blue squares, where Frefl is the flux of the relxillNS component calculated by using cflux in the energy range of 0.1–250 keV. We found that the disk reflection model can also model the derivations properly for all red χ2 ∼ 1.0. Compared with the results of the enhanced persistent emission model, the disk reflection model provides similar blackbody radii but lower temperatures, and thus lower bolometric fluxes. The fluxes of the reflection component are statistically significant for the first ∼10 s for all bursts, and they can be neglected during the cooling tail. We find the temperatures and bolometric flux of the disk reflection model to be less than the fa model by a factor ∼0.25 and 2.3, respectively, which is similar to Zhao et al. (2022). We also tried to coadd the spectra of all PRE bursts during the expansion phase to find spectral features, but we detected none.
4. Discussion
We analyzed the 2021 and 2022 outbursts of 4U 1730–22 from NICER observations. These two outbursts showed a typical behavior of atoll sources and similar spectral evolution from the HID. We carried out detailed time-resolved spectral analyses on all 17 type I X-ray bursts. Each persistent spectrum prior to the trigger of these bursts could be well fitted by an absorbed thermally Comptonized model in the energy range 0.3–10 keV. We found that the burst spectra for the first ∼10 s after onset were deviated from the blackbody model. Therefore, we introduced the fa model and the reflection model to account for it. Both the fa model and the reflection model explain the burst spectra well (see also Zhao et al. 2022), and they are difficult to distinguish by using current on-orbit instruments. We found that the contribution of the enhanced persistent emission or the disk reflection of PRE bursts are more significant than non-PRE bursts. This is not surprising because PRE bursts with Eb ∼ 3.3 − 5.4 × 10⁻⁷ erg cm−2 are more energetic than non-PRE bursts with Eb ∼ 1.4 − 3.1 × 10⁻⁷ erg cm−2, and thus they can induce more significant enhanced persistent emission or disk reflection. The touchdown fluxes determined from the reflection model are lower than the results from the fa model. However, when the burst photons are reflected, the observed burst flux could be blocked and/or strengthened by the accretion disk. The anisotropy of the burst emission depends on the inclination angle of the disk to the line of sight and the shape of the disk (He & Keek 2016). For this work, we have used the results from the fa model to estimate the distance to 4U 1730–22 (Sect. 4.1) and to determine the burning fuel from the recurrence time (Sect. 4.2).
From the time-resolved spectra, 12 out of 17 bursts are PRE bursts; when accounting for nine PRE bursts out of ten X-ray bursts observed by Insight-HXMT, 78% of X-ray bursts from 4U 1730–22 exhibited PRE. Such a large fraction of PRE bursts have also been found in 4U 1820–30, 4U 1916–053, and 4U 1728–34, which was the case for the ignition of pure helium in a hydrogen-poor environment (Galloway et al. 2008; Galloway 2020). The light-curve profiles of all 12 PRE bursts from 4U 1730–22 are similar, and they have the rise time of 0.5–2 s and the decay time, τ = Eb/Fpeak, of ∼10 s. The observed rise and decay times are close to the case of helium bursts from 4U 1820–30, 4U 1916–053, and 4U 1728–34 with the decay time τ ∼ 5 − 9 s (Galloway et al. 2008; Galloway 2020), but they are smaller than the mixed hydrogen and helium bursts, such as XTE J1739–285, with the rise time of 3.6–11.5 s and the decay time of ∼20 s (Bult et al. 2021b). The unstable burning of helium through the triple-alpha process is usually faster than the unstable burning of mixed hydrogen and helium. Thus, we propose that these PRE bursts are powered by the unstable burning of pure helium, following the completion of hydrogen burning, since the companion of 4U 1730–22 is likely in the main sequence (Strohmayer & Bildsten 2006; Russell et al. 2021; Strader et al. 2021).
4.1. The source distance
Assuming spherically symmetric emission, we can estimate the Eddington luminosity measured by the observer at infinity as (Lewin et al. 1993; Suleimanov et al. 2012; Poutanen 2017)
![Mathematical equation: $$ \begin{aligned}&L_{\rm Edd,~\infty } =\frac{8\pi Gm_{p} M_{\rm NS}c[1+(kT/39.4\,\mathrm {keV})^{0.976}]}{\sigma _{\rm T}(1+X)(1+z)} \nonumber \\&\qquad \quad =2.7\times 10^{38}\Bigr (\frac{M_{\rm NS}}{1.4\,M_\odot }\Bigr )\frac{1+(kT/39.4\,\mathrm{keV})^{0.976} }{(1+X)}\nonumber \\&\qquad \qquad \times \Bigl (\frac{1+z}{1.31}\Bigr )^{-1}\,\mathrm erg\,s^{-1} , \end{aligned} $$](/articles/aa/full_html/2023/02/aa44984-22/aa44984-22-eq10.gif) (1)
(1)
where mp is the mass of the proton, σT is the Thompson scattering cross section, kT is the effective temperature of the atmosphere in units of keV, the gravitational redshift factor 1 + z = (1 − 2GMNS/Rc2)−1/2 at the radius of R, the mass fraction of hydrogen X = 0 for pure helium, and X = 0.7 for solar abundance. We assumed the blackbody temperature at the touchdown moment as the effective temperature, that is kT = kTTD. For a typical NS with a mass of 1.4 M⊙ and the atmosphere being located on the NS surface at the radius of 10 km, we obtained the Eddington luminosity of pure helium and the solar abundance, LEdd, ∞ ∼ 2.93 × 1038 erg s−1 and 1.72 × 1038 erg s−1, respectively. We calculated the distance by using the touchdown flux via the relation D = (LEdd, ∞/4πFTD, PRE)1/2, then we obtained the average distance d = 7.54 ± 0.46 kpc for X = 0, and d = 5.79 ± 0.35 kpc for X = 0.7. We note that the error of each observable parameter was propagated to estimate the uncertainties of the distance and other quantities in Tables 2 and 3. The distance is smaller than the result from Chen et al. (2023), that is 10.4 kpc, in which they used the empirical value 3.8 × 1038 erg s−1 as the Eddington luminosity (Kuulkers & den Hartog 2003) and a smaller touchdown flux, FTD = 2.92 ± 0.11 × 10⁻⁸ erg cm−2 s−1, measured by Insight-HXMT possibly due to the adopted different energy bands between Insight-HXMT and NICER. If we take the same Eddington luminosity, 3.8 × 1038 erg s−1, as was used in Chen et al. (2023), the distance is 8.59 ± 0.54 kpc closer to the distance value we derived using Eq. (1). Hereafter, we use 7.54 kpc as the distance to the source.
Calculated parameters.
4.2. X-ray burst fuel
Besides the rise and decay time of burst light curves, we were able to determine the burst fuel in an independent way. We calculated the α factor to verify the burst fuel composition, which is the ratio of the persistent fluence between bursts to the total burst fluence of the burst, α = FperΔTrec/Eb. We obtained the α of the burst with ΔTrec < 1 day, and listed all α in Table 2. The calculated α is the upper limit, which was hard to verify for the burst fuel composition. Instead, we estimated the averaged recurrence time by dividing the unfiltered exposure of 467.8 ks collected between the first and last bursts from ObsIDs 5202200101 and 4639010179 during the 2022 outburst, respectively, by the number of bursts observed. We obtained the mean recurrence time  h. From the average values of burst fluence, persistent flux, and
  , we found the average
  , which is close to a helium fuel composition. Even if eight X-ray bursts are added during the 2022 outburst from Insight-HXMT without an extra exposure time,
  is still larger than the mixed hydrogen and helium fuel.
The burst fuel composition can be verified in another way by determining the local accretion rate (Galloway et al. 2008),
 (2)
(2)
where Fper is the persistent flux. We used distance d = 7.54 ± 0.46 kpc to calculate ̇m. We assumed the local Eddington accretion rate  , then we obtained the local accretion rate, ̇m, as a fraction of the local Eddington accretion rate, ̇mEdd, for X = 0.7 and X = 0, respectively. We listed ̇m and ̇m/̇mEdd in Table 3. All ̇m are less than 10% ̇mEdd for X = 0, which supports the idea that these bursts were ignited in a helium-rich environment (see e.g., Galloway & Keek 2021). For the case of X = 0.7, most ̇m were higher than 10% ̇mEdd, but for bursts #15–17, ̇m ∼ 6% ̇mEdd, which does not support the mixed hydrogen and helium bursts.
We can estimate the ignition depth at the onset of the burst with the equation
 (3)
(3)
where Eb is the burst fluence, the nuclear energy generated for solar composition (X = 0.7) is Qnuc ≈ 1.31 + 6.95X − 1.92X2 MeV nucleon−1 ≈ 4.98 MeV nucleon−1 and Qnuc ≈ 1.31 MeV nucleon−1 for X = 0 (Goodwin et al. 2019). We used d = 7.54 ± 0.46 kpc to determine yign. Once the ignition depth was known, we calculated the recurrence time between bursts by using the equation Δtrec = (yign/̇m)(1 + z). The estimated recurrence time and ignition depth are listed in Table 3. The recurrence times for X = 0 are four times longer than X = 0.7.
The Δtrec for X = 0 between the first Insight-HXMT burst and burst #1 is 5.40 ± 1.18 h, which is consistent with the observed recurrence time ΔTrec = 6.0 h. The calculated recurrence time Δtrec between bursts #12 and #13 is 15.67 ± 3.10 h, which is slightly higher than the observed result ΔTrec = 10.7 h. The reason is that the local accretion rate (̇m) decreased between these two bursts. Other calculated recurrence times are prominently less than the observed recurrence time, which means that some bursts were likely missed due to data gaps. We verified that at the predicted burst recurrence time, we always had an observational data gap for X = 0, but not for X = 0.7. We also computed the average recurrence time, and found  h for X = 0.7 and 0, respectively. We note that due to burst #1 appearing in the 2021 outburst, all of the calculated average values do not include it. For X = 0, the
  within the error range is close to the observed mean recurrence time
  h. For X = 0.7, the predicted recurrence time
  is prominently less than
  . If these bursts were powered by mixed hydrogen and helium, we would expect to observe more X-ray bursts within 467.8 ks. Therefore, in regards to the magnitude, we conclude that these bursts from 4U 1730–22 occurred in a helium-rich environment, where helium was mainly produced from the steady burning of the accreted hydrogen from the main sequence companion.
We note that Bult et al. (2022) also reported the analysis of type I X-ray bursts independently from the same data set of NICER observations. Compared with their work, we found that the persistent spectra did not show the disk blackbody component significantly. We obtained a smaller hydrogen column density, 0.413 × 1022 cm−2 versus 0.71 × 1022 cm−2, and smaller red χ2; however, our NH value is consistent with the result report in Tomsick et al. (2007). The different persistent spectra and NH can explain why Bult et al. (2022) obtained larger peak fluxes and burst fluences by using the fa model. However, the distance to the source in our work is consistent with Bult et al. (2022) within a 1σ confidence level.
5. Conclusions
We detected 17 type I X-ray bursts from 4U 1730–22 during its 2021 and 2022 outbursts by NICER observations. The persistent spectra of all bursts are well fitted by TBabs × nthcomp, which showed a similar spectral shape. We have analyzed the time-resolved spectra of all bursts in detail. We found that the burst spectra in the first few seconds of onset are deviated from a blackbody shape below ∼1.5 keV and above ∼5 keV. The deviation could be explained by the enhanced persistent emission caused by the Poynting-Robertson drag (in’t Zand et al. 2013) and the reflection of the burst emission from the surrounding accretion disk (see e.g., Ballantyne & Strohmayer 2004; Zhao et al. 2022). Specifically, we introduced the fa model and the reflection model relxillNS to fit the time-resolved spectra of the burst, respectively. Due to the limited energy band of the observations, it is difficult to distinguish these two models. It is likely that the persistent emissions were enhanced and the accretion disk reflects part of X-ray burst photons at the same time during X-ray bursts. We found that 12 of 17 type I X-ray bursts are PRE bursts. Accompanied with nine bursts out of ten being PRE bursts detected by Insight-HXMT, 78% of X-ray bursts from 4U 1730–22 showed PRE, systematically higher than the MINBAR catalog, that is, 20% of PRE bursts. We propose that these PRE bursts were powered by pure helium based on the raise time, the recurrence time, and the local accretion rate.
Acknowledgments
We appreciate the referee for valuable comments that improved this manuscript. Z.L. and Y.Y.P. were supported by National Natural Science Foundation of China (12103042, 12273030, U1938107). This work is supported by the National Key R&D Program of China (2021YFA0718500), the National Natural Science Foundation of China under grants 11733009, U1838201, U1838202, U1938101, U2038101. This research has made use of data obtained from the High Energy Astrophysics Science Archive Research Center (HEASARC), provided by NASA’s Goddard Space Flight Center.
References
- Arnaud, K. A. 1996, ASP Conf. Ser., 101, 17 [Google Scholar]
- Ballantyne, D. R., & Strohmayer, T. E. 2004, ApJ, 602, L105 [NASA ADS] [CrossRef] [Google Scholar]
- Bult, P., Altamirano, D., Arzoumanian, Z., et al. 2018, ApJ, 860, L9 [Google Scholar]
- Bult, P., Altamirano, D., Arzoumanian, Z., et al. 2021a, ApJ, 907, 79 [NASA ADS] [CrossRef] [Google Scholar]
- Bult, P. M., Jaisawal, G. K., Jaodand, A., et al. 2021b, ATel, 14769, 1 [NASA ADS] [Google Scholar]
- Bult, P., Mancuso, G. C., Strohmayer, T. E., et al. 2022, ApJ, 940, 81 [NASA ADS] [CrossRef] [Google Scholar]
- Chen, W., Shrader, C. R., & Livio, M. 1997, ApJ, 491, 312 [NASA ADS] [CrossRef] [Google Scholar]
- Chen, Y. P., Zhang, S., Ji, L., et al. 2023, ApJ, 942, 14 [Google Scholar]
- Cominsky, L., Jones, C., Forman, W., & Tananbaum, H. 1978, ApJ, 224, 46 [NASA ADS] [CrossRef] [Google Scholar]
- Connors, R. M. T., García, J. A., Dauser, T., et al. 2020, ApJ, 892, 47 [NASA ADS] [CrossRef] [Google Scholar]
- Falanga, M., Götz, D., Goldoni, P., et al. 2006, A&A, 458, 21 [NASA ADS] [CrossRef] [EDP Sciences] [Google Scholar]
- Forman, W., Jones, C., Cominsky, L., et al. 1978, ApJS, 38, 357 [Google Scholar]
- Frank, J., King, A., & Raine, D. 1992, Accretion Power in Astrophysics (Cambridge University Press), 21 [Google Scholar]
- Galloway, D. K., & Keek, L. 2021, Astrophys. Space Sci. Lib., 461, 209 [NASA ADS] [CrossRef] [Google Scholar]
- Galloway, D. K., Muno, M. P., Hartman, J. M., Psaltis, D., & Chakrabarty, D. 2008, ApJS, 179, 360 [NASA ADS] [CrossRef] [Google Scholar]
- Galloway, D. K., in’t Zand, J., Chenevez, J., et al. 2020, ApJS, 249, 32 [NASA ADS] [CrossRef] [Google Scholar]
- García, J. A., Dauser, T., Ludlam, R. M., et al. 2022, ApJ, 926, 13 [CrossRef] [Google Scholar]
- Gendreau, K., & Arzoumanian, Z. 2017, Nat. Astron., 1, 895 [NASA ADS] [CrossRef] [Google Scholar]
- Goodwin, A. J., Heger, A., & Galloway, D. K. 2019, ApJ, 870, 64 [NASA ADS] [CrossRef] [Google Scholar]
- Hasinger, G., & van der Klis, M. 1989, A&A, 225, 79 [NASA ADS] [Google Scholar]
- He, C.-C., & Keek, L. 2016, ApJ, 819, 47 [NASA ADS] [CrossRef] [Google Scholar]
- in’t Zand, J. J. M., Galloway, D. K., Marshall, H. L., et al. 2013, A&A, 553, A83 [CrossRef] [EDP Sciences] [Google Scholar]
- Iwakiri, W., Negoro, H., Nakajima, M., et al. 2021, ATel, 14757, 1 [NASA ADS] [Google Scholar]
- Kennea, J. A., Bahramian, A., Evans, P. A., et al. 2021a, ATel, 14686, 1 [NASA ADS] [Google Scholar]
- Kennea, J. A., Evans, P. A., Bahramian, A., et al. 2021b, ATel, 14688, 1 [NASA ADS] [Google Scholar]
- Kobayashi, K., Negoro, H., Serino, M., et al. 2021, ATel, 14683, 1 [NASA ADS] [Google Scholar]
- Kuulkers, E., den Hartog, P. R., in’t Zand, J. J. M., et al. 2003, A&A, 399, 663 [NASA ADS] [CrossRef] [EDP Sciences] [Google Scholar]
- Lewin, W. H. G., van Paradijs, J., & Taam, R. E. 1993, Space Sci. Rev., 62, 223 [CrossRef] [Google Scholar]
- Li, Z.-S., Qu, Z.-J., Chen, L., et al. 2015, ApJ, 798, 56 [Google Scholar]
- Li, Z., Suleimanov, V. F., Poutanen, J., et al. 2018, ApJ, 866, 53 [NASA ADS] [CrossRef] [Google Scholar]
- Li, Z., Yu, W., Lu, Y., Pan, Y., & Falanga, M. 2022, ApJ, 935, 123 [NASA ADS] [CrossRef] [Google Scholar]
- Ludlam, R. M., Miller, J. M., Barret, D., et al. 2019, ApJ, 873, 99 [Google Scholar]
- Özel, F., Güver, T., & Psaltis, D. 2009, ApJ, 693, 1775 [Google Scholar]
- Poutanen, J. 2017, ApJ, 835, 119 [NASA ADS] [CrossRef] [Google Scholar]
- Poutanen, J., Nättilä, J., Kajava, J. J. E., et al. 2014, MNRAS, 442, 3777 [Google Scholar]
- Remillard, R. A., Loewenstein, M., Steiner, J. F., et al. 2022, AJ, 163, 130 [NASA ADS] [CrossRef] [Google Scholar]
- Russell, D. M., Baglio, M. C., Saikia, P., Abdelmaguid, M., & Lewis, F. 2021, ATel, 14693, 1 [NASA ADS] [Google Scholar]
- Strader, J., Sokolovsky, K., Aydi, E., et al. 2021, ATel, 14694, 1 [NASA ADS] [Google Scholar]
- Strohmayer, T., & Bildsten, L. 2006, in Compact stellar X-ray sources, eds. W. Lewin, & M. van der Klis (Cambridge: Cambridge University Press), 113 [CrossRef] [Google Scholar]
- Suleimanov, V., Poutanen, J., & Werner, K. 2012, A&A, 545, A120 [NASA ADS] [CrossRef] [EDP Sciences] [Google Scholar]
- Suleimanov, V. F., Poutanen, J., Nättilä, J., et al. 2017, MNRAS, 466, 906 [Google Scholar]
- Sztajno, M., Fujimoto, M. Y., van Paradijs, J., et al. 1987, MNRAS, 226, 39 [NASA ADS] [CrossRef] [Google Scholar]
- Tanaka, Y., & Shibazaki, N. 1996, ARA&A, 34, 607 [NASA ADS] [CrossRef] [Google Scholar]
- Tomsick, J. A., Gelino, D. M., & Kaaret, P. 2007, ApJ, 663, 461 [NASA ADS] [CrossRef] [Google Scholar]
- Walker, M. A. 1992, ApJ, 385, 651 [NASA ADS] [CrossRef] [Google Scholar]
- Wilms, J., Allen, A., & McCray, R. 2000, ApJ, 542, 914 [Google Scholar]
- Worpel, H., Galloway, D. K., & Price, D. J. 2013, ApJ, 772, 94 [NASA ADS] [CrossRef] [Google Scholar]
- Zdziarski, A. A., Johnson, W. N., & Magdziarz, P. 1996, MNRAS, 283, 193 [NASA ADS] [CrossRef] [Google Scholar]
- Zhao, G., Li, Z., Pan, Y., et al. 2022, A&A, 660, A31 [NASA ADS] [CrossRef] [EDP Sciences] [Google Scholar]
- Życki, P. T., Done, C., & Smith, D. A. 1999, MNRAS, 309, 561 [Google Scholar]
All Tables
All Figures
|
Fig. 1. Light curves and hardness ratio of 2021 (top panel) and 2022 (bottom panel) outbursts. In the top of each panel, we show the light curves in the 0.5–10 keV and 2.0–20.0 keV bands from NICER and MAXI observations, respectively. In the bottom, we show the NICER hardness ratio between 3.8–6.8 keV and 2.0–3.8 keV. Each black point means 64 s data of NICER and all bursts have been removed. The blue points represent the MAXI data. We marked the onset of all bursts observed by NICER and Insight-HXMT as black and red bars, respectively. |
| In the text | |
|
Fig. 2. HID of the 4U 1730–22 2021 and 2022 outbursts from NICER observations. The gray (brown) dots represent the outburst observed in 2021 (2022). All bursts have been removed, and each point represents a segment of 64 s. The HID of the persistent emission before each NICER X-ray burst are marked as black diamond points. The blue diamond points represent the Insight-HXMT bursts. The circle indicates the evolution direction of HID over time. |
| In the text | |
|
Fig. 3. Light curve of the 17 X-ray bursts from 4U 1730–22 observed with NICER. Black lines are light curves in 0.5–10 keV and they were binned at 1 s time resolution. Light curves were relative to the burst onset time and subtracted the persistent emission. The gray dashed-dotted line represents the persistent emission. |
| In the text | |
|
Fig. 4. Persistent spectra of 4U 1730–22. Top panel: preburst persistent spectrum in the energy range 0.3–10 keV and the best-fit models, Tbabs × nthcomp, for burst #5. Bottom panel: red points are the persistent spectrum produced from the observations on top right of HID with the exposure of 256 s, while the black points are from the bottom of HID with the exposure of 800 s. The solid lines are the best-fit models for each spectrum. The same models were used. The black dash-dotted line is the black solid model multiplied by 20. The residuals of the best-fit model to the data are plotted. |
| In the text | |
|
Fig. 5. Time-resolved spectroscopy using the fa model (red dot) and the disk reflection model (blue square) for bursts #1–8. For each panel, from top to bottom, we exhibit the burst bolometric flux, Fburst; the blackbody temperature, kTbb, and the blackbody radii, Rbb, which were calculated using a distance of 7.54 kpc; the enhanced persistent emission flux and disk reflection flux, Ffa and Frefl, respectively; and the goodness of fit per degree of freedom, red χ2. The gray dashed-dotted lines mean the persistent emission level, and the black dashed lines label the touchdown moment of the fa model. The red χ2 of the blackbody model are plotted as a gray dashed line for comparison. |
| In the text | |
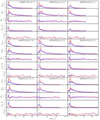 |
Fig. 6. Similar to Fig. 5, but for bursts #9–17. |
| In the text | |
Current usage metrics show cumulative count of Article Views (full-text article views including HTML views, PDF and ePub downloads, according to the available data) and Abstracts Views on Vision4Press platform.
Data correspond to usage on the plateform after 2015. The current usage metrics is available 48-96 hours after online publication and is updated daily on week days.
Initial download of the metrics may take a while.