| Issue |
A&A
Volume 685, May 2024
|
|
|---|---|---|
| Article Number | A71 | |
| Number of page(s) | 11 | |
| Section | Stellar structure and evolution | |
| DOI | https://doi.org/10.1051/0004-6361/202347534 | |
| Published online | 07 May 2024 | |
New insight into the hard X-ray emission influenced by the type I bursts observed by Insight-HXMT during the outburst of 4U 1636–536
1
Key Laboratory of Particle Astrophysics, Institute of High Energy Physics, Chinese Academy of Sciences, Beijing 100049, PR China
e-mail: This email address is being protected from spambots. You need JavaScript enabled to view it.
; This email address is being protected from spambots. You need JavaScript enabled to view it.
; This email address is being protected from spambots. You need JavaScript enabled to view it.
2
University of Chinese Academy of Sciences, Chinese Academy of Sciences, Beijing 100049, PR China
3
Institute für Astronomie und Astrophysik, Kepler Center for Astro and Particle Physics, Eberhard Karls, Universität, Sand 1, 72076 Tübingen, Germany
4
School of Physics and Astronomy, Sun Yat-Sen University, Zhuhai 519082, PR China
5
Yunnan Observatories, Chinese Academy of Sciences, Kunming 650216, PR China
6
Key Laboratory for the Structure and Evolution Celestial Objects, Chinese Academy of Sciences, Kunming 650216, PR China
7
Center for Astronomical Mega-Science, Chinese Academy of Sciences, Beijing 100012, PR China
8
CAS Key Laboratory for Research in Galaxies and Cosmology, Department of Astronomy, University of Science and Technology of China, Hefei 230026, PR China
9
School of Astronomy and Space Science, University of Science and Technology of China, Hefei 230026, PR China
10
Key Laboratory of Stars and Interstellar Medium, Xiangtan University, Xiangtan 411105, Hunan, PR China
11
College of Science, China Three Gorges University, Yichang 443002, PR China
12
Center for Astronomy and Space Sciences, China Three Gorges University, Yichang 443002, PR China
Received:
21
July
2023
Accepted:
29
January
2024
Abstract
Context. Thermonuclear bursts, also known as type I X-ray bursts, result from unstable nuclear burning of H/He accreted to the surface of neutron stars, lasting from tens to hundreds of seconds. Thermonuclear bursts have an important impact on accretion environments around the neutron stars, such as their disks and coronas, and are therefore a subject of extensive research. Thermonuclear bursts can be used as probes to gain a deeper understanding of the properties of their disks and coronas.
Aims. By analyzing the data from Insight-HXMT and NICER, we can determine the evolution of the significance of the hard shortage in 4U 1636–536 with its spectral state, as well as the evolution of the fraction of deficit with energy. Additionally, we investigate the possible geometry and evolution of the corona in 4U 1636–536 by combining our findings with the results of spectral analysis.
Methods. We extracted the light curves from the Insight-HXMT low-energy, medium-energy, and high-energy data and subtracted their pre-burst emission, which allowed us to estimate the significance of the hard shortages during the bursts. By fitting the spectra, the correlation between the persistent spectral parameters and the significance of the hard shortages could be established. The bursts were then grouped according to the spectral state in which they occurred, and the significance of the hard shortages was estimated. These in turn helped to investigate the evolution of the fraction of deficit with energy.
Results. We find that during the soft state the significance of possible hard X-ray shortage in bursts is almost zero. However, in the hard state, some bursts exhibit significant shortages (> 3σ), while others do not. We attempt to establish a correlation between the significance of the hard X-ray shortage and the spectral parameters, but the data quality and the limited number of bursts prevent us from finding a strong correlation. For bursts with insignificant shortages in the soft state, the fraction of the deficit remains small. However, in the hard state the fraction of deficit for all bursts increases with energy, regardless of the significance of the shortage of individual bursts. For bursts during the hard state, we investigated the evolution of the fraction of deficit during the bursts by stacking the peaks and decays of the bursts, and find that as the flux of the bursts decreases, the energy corresponding to the maximum of the fraction of deficit becomes progressively higher.
Conclusions. We explore the possible geometry and evolution of the corona suggested by the evolution of the fraction of deficit, which is obtained from the spectral and temporal analysis.
Key words: X-rays: binaries / X-rays: bursts
© The Authors 2024
 Open Access article, published by EDP Sciences, under the terms of the Creative Commons Attribution License (https://creativecommons.org/licenses/by/4.0), which permits unrestricted use, distribution, and reproduction in any medium, provided the original work is properly cited.
This article is published in open access under the Subscribe to Open model. This email address is being protected from spambots. You need JavaScript enabled to view it. to support open access publication.
1. Introduction
A low-mass X-ray binary (LMXRB) consists of a companion and a compact star, such as a black hole or neutron star. LMXRBs can be classified into persistent or transient sources (Tetarenko et al. 2016; Sreehari et al. 2018). The transient sources show occasional sudden increases in X-ray flux through accretion, referred to as outbursts. Neutron star LMXRBs can be classified into z-sources and atoll sources. Z-sources are significantly brighter than atoll sources, but more type I bursts can be seen in atoll sources (Lewin et al. 1993; Galloway et al. 2008). Interestingly, z-sources and atoll sources can be transformed into each other (Lin et al. 2009). With the evolution of outbursts, we can observe changes in their spectral state on the color-color diagram (CCD). The trajectory of an atoll source on the CCD during an outburst typically follows a C or U shape. The spectral state of atoll sources can be classified into two states: the hard state and the soft state (Hasinger & van der Klis 1989; Schulz et al. 1989). During the hard state, the spectral energy distribution of LMXRBs is dominated by hard X-ray emission, typically with a power-law shape. This emission is produced by the Comptonization of soft photons in the hot corona surrounding the accretion disk. In contrast, during the soft state, the spectrum is dominated by the thermal emission of the accretion disk, which emits a blackbody-like spectrum.
Type I bursts are caused by unstable burning of the accreted hydrogen and helium on the surface of a neutron star (Hansen & van Horn 1975; Belian et al. 1976). The flux of the bursts can be several times higher than the pre-burst persistent emission. The flux rise time of the classical X-ray bursts is between 1 and 10 s, while their duration can span from tens to hundreds of seconds. The light curves show the characteristics of “fast rise and slow decay” (Lewin et al. 1993; Cumming 2004; Strohmayer & Bildsten 2006).
The influence of these bursts on the disk and corona is of great importance for studying the structure and evolution of these components. Fragile et al. (2018, 2020) has demonstrated through simulation that the presence of Poynting–Robertson (PR) drag causes the inner edge of the disk to retreat from the neutron-star surface toward larger radii and then to recover on the timescale of the burst. Keek et al. (2018) reported a soft excess in Aql X–1 and provided an interpretation by introducing a reprocessing of the strongly photoionized disk and an enhancement of the pre-burst persistent flux, probably due to PR drag. Lu et al. (2023) also reported the enhanced persistent emission in 4U 1730–22 due to PR drag or the reflection from the accretion disk with the observation of NICER. Bult et al. (2019) and Buisson et al. (2020) also reported soft excesses respectively in SAX J1808.4–3658 and Swift J1858.6–0814 with NICER. Maccarone & Coppi (2003) showed a hard X-ray shortage in an X-ray burst using RXTE/HXETE, with a significance of 2σ. Chen et al. (2012) stacked the light curves of several X-ray bursts of IGR J17473–2721 with the observation of RXTE/PCA, and found the hard X-ray shortage with high confidence for the first time. Later on, a series of hard X-ray shortages were reported in Aql X–1 (Chen et al. 2013), 4U 1636–536 (Ji et al. 2013; Chen et al. 2019), KS 1731–260 (Ji et al. 2014b), 4U 1705–44 (Ji et al. 2014b), GS 1826–238 (Ji et al. 2014a), 4U 1728–34 (Kajava et al. 2017), and MAXI J1816–195 (Chen et al. 2022) based on RXTE/PCA, INTEGRAL and Insight-HXMT observations. Chen et al. (2022) gave the evolution of the deficit of fraction with energy in the millisecond accreting system MAXI J1816–195. They found a clue that the fraction of the deficit drops at ∼65–85 keV, which is probably attributed to hard X-rays from the accretion column of the magnetic pole, where the emissions are less influenced by the burst.
4U 1636–536 is a neutron star low-mass X-ray binary (LMXRB) with a companion star of mass ∼0.4 M⊙ discovered by the Eighth Orbiting Solar Observatory (OSO-8; Giles et al. 2002). The track of 4U 1636–536 on the CCD is C-shaped or U-shaped, behaving as a standard atoll source (Hasinger & van der Klis 1989; Schulz et al. 1989; Zhang et al. 2011). The orbit of 4U 1636–536 is about 3.8 h (van Paradijs et al. 1990) and the spin period is 581 Hz (Strohmayer et al. 1998). Galloway et al. (2006) used type I bursts with photospheric radius expansion (PRE) to estimate a distance of ∼6 kpc. Since the discovery of 4U 1636–536, more than 700 bursts have been observed, including some PRE bursts, single-peaked bursts, and multi-peaked bursts (Maurer & Watts 2008; Zhang et al. 2009; Galloway et al. 2020). In the study of multi-peaked type I X-ray bursts in the Neutron Star LMXB 4U 1636–536 with RXTE, the first quadruple-peaked burst has been reported. (Li et al. 2021). Ji et al. (2013) detect the hard X-ray shortage (30–50 keV) in 4U 1636–536 by stacking 114 RXTE bursts. The hard X-ray shortage lags behind that of the soft X-rays by 2.4 ± 1.5 s. The time lag was regarded as a timescale for cooling and recovering the corona. Chen et al. (2019) reported Insight-HXMT observation of the high-energy shortage induced by a single burst, with a significance of 6.2σ. Zhao et al. (2022) found enhanced persistent emissions possibly due to the PR drag and disk reflections during the bursts with NICER observations. Güver et al. (2022) also revealed soft excess in 4U 1636–536, which is attributed to the increased mass accretion rate onto the neutron star due to PR drag. They also found evidence of corona cooling by stacking seven NuSTAR bursts.
In this paper we analyze the burst data of 4U 1636–536 collected by Insight-HXMT and NICER, and investigate in detail the burst influence on its corona in the context of outburst evolution. In Sect. 2 we describe the observations and data reduction. The detailed results are presented in Sect. 3. The results are discussed and the conclusions are presented in Sect. 4.
2. Observations and data reduction
2.1. Insight-HXMT
Insight-HXMT is the first Chinese X-ray astronomy satellite; it was successfully launched on 2017 June 15 (Zhang et al. 2014, 2018, 2020). It carries three scientific payloads: the low-energy X-ray telescope (LE, SCD detector, 1–15 keV, 384 cm2; Chen et al. 2020), the medium-energy X-ray telescope (ME, Si-PIN detector, 5–35 keV, 952 cm2; Cao et al. 2020), and the high-energy X-ray telescope (HE, phoswich NaI(CsI), 20–250 keV, 5100 cm2; Liu et al. 2020).
Insight-HXMT observed 4U 1636–536 from 2018 to 2022, with a total exposure time of 1050 ks. We extracted the data from all three payloads using the Insight-HXMT Data Analysis software HXMTDAS v2.05. The data were filtered with the criteria recommended of the Insight-HXMT Data Reduction Guide v2.051.
We extracted the total light curves with a time bin of one second (including instrument background and source counts) for LE (1–10 keV) and ME (6–30 keV), and a time bin of four seconds for HE (40–70 keV). Then we extracted the light curves during the bursts with the peak of the ME light curves of the bursts as the time zero (Fig. 1). Xspec v12.12.12 was used to fit the spectra and the energy bands were chosen as LE 2–8 keV, ME 8–28 keV, and HE 28–100 keV. A one percent systematic error was added to data, and the errors were estimated via Markov chain Monte Carlo (MCMC) chains with a length of 20 000.
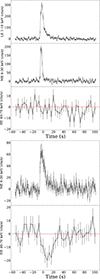 |
Fig. 1. Two examples of Insight-HXMT light curves The upper three panels show a burst in soft state; the lower two panels show a burst in hard state with the most significant hard X-ray shortage. The upper panels (from top to bottom) are the LE, ME, and HE light curves during the burst of 4U 1636–536 in 1–10 keV, 6–30 keV, and 40–70 keV, respectively. Time 0 s is the peak flux of the ME. For all bursts the mean value of the pre-burst emission (both persistent emission and instrumental background) is taken as the background, and it is subtracted from the light curves of LE, ME, and HE to obtain the net light curves. |
2.2. NICER
The Neutron Star Interior Composition Explorer (NICER) is an International Space Station (ISS) payload, which was launched by the Space X Falcon 9 rocket on 2017 June 3. NICER has a large effective area and high temporal resolution in the soft X-ray band (0.2–12 keV). NICER observed 4U1636–536 in 2018 and obtained four observations that are almost simultaneous with those of Insight-HXMT. The NICER data were reduced using the standard pipeline tool nicerl23. The background was calculated by the nibackgen3C504 tool provided by the NICER team. We grouped each spectrum as having at least 50 counts in each channel, and for the fitting of the spectrum we chose an energy range of 0.5–10 keV.
3. Result
3.1. Color-color diagram and Insight-HXMT light curves
We subtracted the background and obtained the net count rates of Insight-HXMT LE: 1–3 keV, 3–6 keV, and ME: 10–25 keV, 15–20 keV, and then constructed CCD of 4U 1636–536. As shown in Fig. 2, the soft color of the CCD is defined as the LE count rate ratio of 3–6 keV to 1–3 keV, while the hard color is the ME count rate ratio of 15–20 keV to 10–15 keV. We corrected the CCD by taking into account the relative count rate ratio for Crab, using similar observation times for 4U 1636–536. In Fig. 2 the red dots represent the type I bursts used in this paper, and most of these bursts are in the hard state.
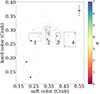 |
Fig. 2. Insight-HXMT CCD of 4U 1636–536, where soft-color is defined as the ratio of LE 3–6 keV to 1–3 keV count rates, and hard-color is defined as the ratio of ME 15–20 keV to 10–15 keV count rates. Correction is made by dividing by the count rate of the Crab corresponding to the time and energy band. The time bin of the points is 4 h. The stars are the type I bursts used in the paper. The average error bar is shown in the top right corner. The color bar shows the levels of significance of hard X-ray shortage during the bursts. The bursts in the hard state are classified into four groups based on their positions on the CCD. |
For each burst we extracted the light curves of the Insight-HXMT 1–10 keV and 6–30 keV with a time bin of one second for LE and ME, and 40–70 keV with a time bin of four seconds for HE. We used the time of the flux peak of each ME light curve with a time resolution of 1 second as a reference (time zero in Fig. 1). For all bursts, we subtracted the pre-burst count rate, which includes both persistent emission and instrumental background, to have the net burst light curves for LE, ME, and HE. Shown in Table 1 are the significant levels of the hard X-ray shortages for each burst which are estimated as the ratio of the deficit area to the sum of all error bars during the deficit (more details in Yan et al. 2024). As shown in Fig. 1, for a typical burst embedded in the soft state, the significance of the hard X-ray shortage is essentially zero in the 40–70 keV energy range. However, for bursts in the hard state, the hard X-ray shortage is quite significant, indicating a shortage of hard X-rays induced by bursts. The hard X-ray shortage detected in a single burst can be as large as around 7σ, which turns out to be the most significant hard X-ray shortage detected to date from a single burst (see Fig. 1). Moreover, after combining the bursts of hard states, the significance of the hard shortage increases to 15.6σ (Table 1), thus providing the most significant burst-induced hard X-ray shortage detected to date for 4U 1636–536.
Bursts detected by Insight-HXMT of 4U 1636–536.
3.2. Evolution of the spectral parameters
To investigate the relationship between the significance of hard X-ray shortage of each burst and the parameters of the continuum spectrum in which the bursts are located, we fit the pre-burst continuum spectrum. We used the TBABS component to account for the interstellar absorption (Wilms et al. 2000). Because of the calibration problem of LE, we ignored energies below 2 keV. Accordingly, the column density NH cannot be well constrained, and is hence fixed at 0.3 × 1022 cm−2 (Pandel et al. 2008). We multiply a CONSTANT to account for the calibration discrepancies between Insight-HXMT LE, ME, and HE; for this paper we fixed the constant of LE to 1. The DISKBB model was used to fit the multitemperature blackbody component of the accretion disk (Mitsuda et al. 1984). At this step an obvious Compton hump shows up in the residual [χ2/(d.o.f.) = 814/342 = 2.38], and so we convolve the THCOMP model with the DISKBB model to fit the continuum formed by the Comptonization of the thermal electrons (Zdziarski et al. 2020) [χ2/(d.o.f.) = 327/339 = 0.96]. Therefore, our fitting model is CONSTANT*TBABS*(THCOMP*DISKBB). A typical joint spectral fit is shown in Fig. 3.
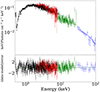 |
Fig. 3. Simultaneous broadband spectrum of ObsID P011465402801 of 4U 1636–536 is observed from NICER (black), Insight-HXMT/LE (red), Insight-HXMT/ME (green), and Insight-HXMT/HE (blue). |
As the flux of 4U 1636–536 is too low for the Insight-HXMT data to constrain the model parameters well, we took almost simultaneous observations via NICER and Insight-HXMT for joint fitting. The model used for fitting is the aforementioned one, and the resulting spectral parameters are shown in Fig. 4. The red points are from the joint fit and the black points are the results with Insight-HXMT data only. We can see that the photon index Γ and electron temperature kTe are essentially consistent regardless of whether the NICER data are present in spectral fitting, and hence for Insight-HXMT data without contemporary NICER data only the spectral parameters of photon index and electron temperature are considered well constrained. Because the minimum energy of Insight-HXMT LE can only go down to 2 keV, the Insight-HXMT data cannot constrain well the parameters of the disk, resulting in a large difference from the joint fit. The results of joint fitting are more reliable for the disk parameters.
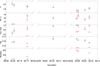 |
Fig. 4. Evolution of parameters of the pre-burst continuum spectrum of 4U 1636–536 in 2018: Γ is the low-energy power-law photon index, kTe the electron temperature, Cov_frac the coverage factor, Tin the temperature of the inner disk, and Rin the inner radius of the disk. The black points are the parameters by fitting only with the data of Insight-HXMT. The red points are the parameters by joint fitting of Insight-HXMT and NICER. |
As shown in Table 2 for the parameters derived from the joint fittings, the coverage factor increases gradually from MJD 58 175.85 to MJD 58 300.71 and decreases again at MJD 58 308.99. A similar evolution trend is hinted at as well for the significance level of hard X-ray shortage σ and electron temperature kTe. We calculated the correlation coefficients and the significance for the deficit and coverage factor and kTe, which were 0.89, 1.6σ and 0.92, 1.8σ, respectively, which suggests the existence of correlation, but with low significance. For the time-resolved spectra of the bursts, we also investigated the correlation between the average fa of each burst and the deficit significance, and find no obvious correlation.
Spectrum parameters of 4U1636–536 Insight-HXMT and NICER joint fitting.
With the joint diagnosis from other spectral parameters, for example photon index and flux (40–70 keV), we can see in these four joint observations that 4U 1636–536 evolved from soft to hard and then to soft. The possible correlation of the hard X-ray shortage with the parameters of spectral index, corona temperature, and flux in 40–70 keV are investigated. As shown in Fig. 5, for a single burst all correlations turn out to be relatively weak. To improve the statistics, as shown in Fig. 2, we classify the bursts in the hard state into four groups according to their positions on the CCD and merge them separately. Then it can be seen from the right panel of Fig. 5 that the shortage significance increases with electron temperature kTe, and has an obvious anti-correlation with the spectral index.
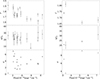 |
Fig. 5. Correlation of flux and persistent spectral parameters for 4U 1636–536. On the y-axis, σ is the significance of hard X-ray shortage, kTe the electron temperature, and Γ the photon index; on the x-axis Flux is the persistent emission flux of 40–70 keV. Left panel: points corresponding to the pre-burst continuum spectrum of the observation in which each burst of 4U 1636–536 is located. Right panel: bursts stacked in the hard state. The points (from left to right) correspond to the stacking of the bursts in the four regions 1, 2, 3, and 4 in Fig. 2. The spectral parameters are the result of the fit after combining the pre-burst continuum spectra of the observations where these bursts are located. |
3.3. Evolution of deficit fraction
As shown in Fig. 1, some bursts exhibit a significant shortage in the light curves of HE during the bursts. To further study the evolution of the shortage with energy, we used the tool addspec5 of HEASOFT to stack the spectra. For each burst, we extracted the spectrum based on its rise time and decay time (shown in Table 1). Specifically, the spectra of bursts in the soft state, the hard state with low shortage significance (less than 3σ), the hard state with high shortage significance (greater than 3σ), and the overall hard state are combined separately. All the pre-burst spectra with an exposure time of 50 s before each burst are also stacked.
As shown in Fig. 6, the middle panel is the spectrum of the burst after subtraction of the pre-burst persistent emission as the background. The top panel is the net spectrum of the persistent emission. We define their ratio as the fraction of deficit (bottom panel). We fit the relationship between the fraction of deficit and the energy with a linear function: Y = aX + b. We find that when the source is in the soft state, the fraction of deficit is essentially zero. However, in the hard state, we find that the fraction of deficit increases with energy. This trend is observed in the spectra obtained by combining all bursts in the hard state, and in the spectra obtained by combining bursts according to the significance of the hard X-ray shortage. Specifically, the trend in the fraction of deficit is consistent between the bursts with low shortage significance and those with high shortage significance. However, bursts with significant hard X-ray shortage exhibit more dramatic evolution and larger values of the fraction of deficit compared to bursts with low shortage significance.
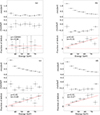 |
Fig. 6. Top panel: spectrum of the persistent emission by HE. Middle panel: detected spectrum of the bursts. Bottom panel: fraction of deficit vs. energy during the bursts detected by HE. Panel a displays the evolution of the fraction of deficit of bursts during the soft state; panels b, c, and d show the same for the hard state, and respectively display all stacked bursts, stacked bursts with insignificant hard shortage, and stacked bursts with significant hard shortage. The red solid line represents the relationship between the fraction of deficit and energy. |
To investigate the evolution of the fraction of deficit during bursts, we extracted the peak with a time interval of 2–12 s and the decay with time intervals of 12–32 s, 32–62 s, and 62–112 s for all bursts in the hard state. We then stacked the spectra to estimate the fraction of deficit. As shown in Fig. 7, as bursts decay, the fraction of deficit also decreases. Similarly to the energy dependence of the deficit fraction, the deficit fraction increases with energy and almost reaches unity at energies around 60–70 keV and then tends to turn over. However, in 62–112 s, the fraction of deficit in the high-energy band drops from 1 to about 0.3, and no trend of turnover is visible at higher energies. We obtain the electron temperatures of the corona by fitting the spectra for these four-time intervals, which are 4.6 keV, 7.5 keV, 12.3 keV, and 16.7 keV. We assumed that the cooling of the corona is only affected by the electron temperatures, and we obtained the evolution of the fraction of deficit using a simulation in which we only consider that the pre-burst electron temperatures of 19.8 keV are cooled down to their corresponding temperatures (red points in Fig. 7). We find that the results of the simulations are in general agreement with our estimates. However, we do not find the trend of turnover at around 60–70 keV through simulations if considering only the different temperatures of the corona. The energy dependence of the deficit fraction is also investigated for the four groups of bursts denoted in Fig. 2. We find that the overall positive correlation between the energy and deficit fraction holds for groups of bursts embedded in the hard states, but with a weaker trend of turnover at high energies (see Fig. 8).
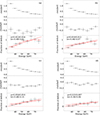 |
Fig. 7. Top panel: spectrum of persistent emission by HE. Middle panel: detected spectrum of the bursts. Bottom panel: fraction of deficit vs. energy during the bursts detected by HE. Panel a displays the peak (2–12 s) after the bursts merge during the hard state, while panels b, c, and d respectively illustrate the decay of the bursts with time intervals of 12–32 s, 32–62 s, and 62–112 s. The red points in all panels represent the simulated evolution of the deficit fraction of a corona, starting with an initial temperature of 19.8 keV and gradually cooling to different temperatures. The solid red line represents the measured fraction of deficit and energy, while the red dash-dotted line represents the simulated fraction of deficit and energy. |
4. Discussion and conclusion
We carried out detailed analyses of the burst influences on the accretion environment by taking a sample of 20 bursts detected by Insight-HXMT from 4U 1636–536. All the bursts in the hard state show hard X-ray shortage, but none in the soft state do. A hard X-ray shortage is found at roughly 7σ from one burst, serving as the most significant detection for hard X-ray shortage observed so far from a single burst. The significance of the hard X-ray shortage shows a strong anti-correlation with the spectral index of the persistent emission. The deficit fraction is found to increase with energy, suggesting either that there is a more efficient cooling of the corona at higher energies or that the entire corona is cooled to a lower temperature.
Since the first hint of about 2σ for hard X-ray shortage induced by type I bursts was discovered (Maccarone & Coppi 2003), a hard shortage has been found in a series of X-ray binaries, mostly via stacking a large number of bursts. However, thanks to the high-energy band and large effective area of Insight-HXMT HE, hard shortage from a single burst was first detected at 6.2σ from 4U 1636–536 in the 40–70 keV energy range. We analyzed the 20 thermonuclear bursts (2 in the soft state and 18 in the hard state) of 4U 1636–536 observed by Insight-HXMT and NICER from 2018 to 2022. As shown in Table 1, a hard X-ray shortage is only detected for bursts in the hard state but not in the soft state. One burst was detected with a hard X-ray shortage as significant as 7σ, which is higher than any of the previous reports from a single burst. A sum-up of all the bursts in the hard state results in the detection of hard X-ray shortage at a significance of 15.6σ, higher than the 3σ value derived previously from stacking 114 bursts observed by RXTE (Ji et al. 2013).
It is generally believed that type I bursts can serve as a probe to study the accretion environment in LMXBRs. Apart from the increase in the persistent emission of soft X-rays during the burst, which is most likely related to the PR-dragging effect induced by the burst, the hard X-rays of the persistent emission show up with shortage, which is usually understood as the surrounding hot corona being cooled down by the soft X-ray shower of the burst. So it is not surprising that the hard X-ray shortage is not detectable in the soft state when the source has weak hard X-ray emission, probably due to a compact corona that exposes a very small solid angle to the neutron star, such that the corona cannot effectively be cooled by the soft X-ray showers of the type I bursts from the neutron star surface. While in the hard state, the source is dominated by the non-thermal emission from the corona, the burst-induced hard X-ray shortage provides a chance to investigate how the corona evolves during the outburst. With a sample of 18 bursts from 4U 1636–536, the significance of the hard X-ray shortage is found to have a strong anti-correlation with the spectral index of the persistent emission. As shown in Fig. 5, the significance increases when the spectral index decreases from 1.8 to 1.65. The non-thermal spectral index is related to the temperature and the optical depth of the corona in the form of  , where θ = kTe/mec2 and mec2 = 511 keV is the electron rest mass (Lightman & Zdziarski 1987), and the optical depth τ can denote the geometric size of the corona. By taking an average of the corona temperature of around 20 keV, as shown in Fig. 5, a change in spectral index from 1.8 to 1.65 would require an increase in the corona temperature of 6.1 keV, which is slightly beyond a variation range of roughly 5 keV, as shown in Fig. 5 when the bursts are classified into four groups. This in turn may suggest the need for an increment of the coronal optical depth by enlarging the size of the corona with the same density. The observed anti-correlation between the significance in shortage and the spectral index can therefore be understood, at least as one possibility, in a scenario that an enlarged corona would have a larger solid angle exposed to the neutron star, and thus a more efficient cooling effect by intercepting more soft X-ray photons from a burst. We also note, as shown in Fig. 8, that the deficit fraction of the fourth group does not reach 100%, indicating that the corona is not fully cooled, although in this group the bursts have relatively significant shortage in hard X-rays, and the persistent emission also has a relatively hard energy spectrum. This may suggest that at the initial hard state the corona should be farther away from the neutron star if the corona size undergoes little change during the evolution of the hard state.
 |
Fig. 8. Top panel: spectrum of persistent emission by HE. Middle panel: detected spectrum of the bursts. Bottom panel: fraction of deficit vs. energy during the bursts detected by HE. Panels 1, 2, 3, and 4 correspond to the stacking of the bursts in the four regions 1, 2, 3, and 4 of Fig. 2. The red solid line represents the relationship between the fraction of deficit and energy. |
For the burst influence on the persistent spectrum, Kajava et al. (2017) analyzed the spectrum by stacking 123 X-ray bursts in the hard state of 4U 1728–34 using data from the INTEGRAL JEM-X and IBIS/ISGRI instruments. They found that the emission above 40 keV decreased by a factor of approximately three during the burst with respect to the persistent emission level. We calculated the fraction of deficit for the spectrum in the counting space, as given in their paper. We find that the fraction of deficit is around  at 35 keV, and then increases to around
  and
and  at 45 keV and 65 keV, respectively. These values barely show a trend of an increase in the deficit fraction with energy. A clear energy dependence of the fraction of deficit was reported from Chen et al. (2022) in a millisecond pulsar system MAXI 1816–195, where the fraction of deficit increases with energy and turns over above 70 keV. Such a turnover is interpreted as the contribution of hard X-rays from the emission region of the magnetic pole, which is less influenced by the burst shower. Here we obtain a similar result where the deficit fraction increases with energy (Fig. 6). Specifically, around the burst peak, we find the deficit fraction starts to turn over at energies above 65 keV, but keeps increasing toward higher energies when the bursts decay to low flux levels (Fig. 7). An overall increase in the deficit fraction with energies can be accounted for by introducing a cooler corona. For example, by having a cooled corona with a temperature of 19.8 keV, as shown by the red points in Fig. 7, a deficit feature of increase with energy and flattening at high energies can be well established. However, the deficit fraction can be observed to reach almost 100% and then tend to turn over at energies above 65 keV during the burst peak period (see Fig. 7). Such a feature may be accounted for if the hard X-rays at higher energies are produced in a flattened region that has a smaller solid angle with respect to the neutron star, and hence a decreasing cooling efficiency. In this case the turnover is expected to turn over gradually and eventually disappear once the corona temperature starts to recover in the decay phase of the bursts, as shown in Fig. 7.
In summary, the broad energy coverage and large detection area at hard X-rays characterize Insight-HXMT as the proper mission for investigating the burst influences on the accretion environment. Accordingly, a sample of 20 bursts from 4U 1636–536 observed by Insight-HXMT provides us with some insights into the possible evolution of the corona during the outburst. Apart from the usual speculations that the corona can be cooled by the burst shower, we find that the energy dependence of the deficit fraction may indicate a change in the corona properties along with the outburst.
Acknowledgments
This work is supported by the National Key R&D Program of China (2021YFA0718500), the National Natural Science Foundation of China under grants U1838201, U1838202, U2038101, U1938103, 12173103, U1938107, 12273030, 12333007 and 12027803. This work made use of data and software from the Insight-HXMT mission, a project funded by China National Space Administration (CNSA) and the Chinese Academy of Sciences (CAS). This work was partially supported by the International Partnership Program of CAS (Grant No. 113111KYSB20190020). This research has made use of software provided by of data obtained from the High Energy Astrophysics Science Archive Research Center (HEASARC), provided by NASA’s Goddard Space Flight Center.
References
- Belian, R. D., Conner, J. P., & Evans, W. D. 1976, ApJ, 206, L135 [CrossRef] [Google Scholar]
- Buisson, D. J. K., Altamirano, D., Bult, P., et al. 2020, MNRAS, 499, 793 [CrossRef] [Google Scholar]
- Bult, P., Jaisawal, G. K., Güver, T., et al. 2019, ApJ, 885, L1 [CrossRef] [Google Scholar]
- Cao, X., Jiang, W., Meng, B., et al. 2020, Sci. China Phys. Mech. Astron., 63, 249504 [NASA ADS] [CrossRef] [Google Scholar]
- Chen, Y.-P., Zhang, S., Zhang, S.-N., Li, J., & Wang, J.-M. 2012, ApJ, 752, L34 [NASA ADS] [CrossRef] [Google Scholar]
- Chen, Y.-P., Zhang, S., Zhang, S.-N., et al. 2013, ApJ, 777, L9 [NASA ADS] [CrossRef] [Google Scholar]
- Chen, Y. P., Zhang, S., Zhang, S. N., et al. 2019, J. High Energy Astrophys., 24, 23 [CrossRef] [Google Scholar]
- Chen, Y., Cui, W., Li, W., et al. 2020, Sci. China Phys. Mech. Astron., 63, 249505a [NASA ADS] [CrossRef] [Google Scholar]
- Chen, Y.-P., Zhang, S., Ji, L., et al. 2022, ApJ, 936, L21 [CrossRef] [Google Scholar]
- Cumming, A. 2004, Nucl. Phys. B Proc. Suppl., 132, 435 [Google Scholar]
- Fragile, P. C., Ballantyne, D. R., Maccarone, T. J., & Witry, J. W. L. 2018, ApJ, 867, L28 [CrossRef] [Google Scholar]
- Fragile, P. C., Ballantyne, D. R., & Blankenship, A. 2020, Nat. Astron., 4, 541 [NASA ADS] [CrossRef] [Google Scholar]
- Galloway, D. K., Psaltis, D., Muno, M. P., & Chakrabarty, D. 2006, ApJ, 639, 1033 [NASA ADS] [CrossRef] [Google Scholar]
- Galloway, D. K., Muno, M. P., Hartman, J. M., Psaltis, D., & Chakrabarty, D. 2008, ApJS, 179, 360 [NASA ADS] [CrossRef] [Google Scholar]
- Galloway, D. K., in’t Zand, J., Chenevez, J., et al. 2020, ApJS, 249, 32 [NASA ADS] [CrossRef] [Google Scholar]
- Giles, A. B., Hill, K. M., Strohmayer, T. E., & Cummings, N. 2002, ApJ, 568, 279 [NASA ADS] [CrossRef] [Google Scholar]
- Güver, T., Bostancı, Z. F., Boztepe, T., et al. 2022, ApJ, 935, 154 [CrossRef] [Google Scholar]
- Hansen, C. J., & van Horn, H. M. 1975, ApJ, 195, 735 [NASA ADS] [CrossRef] [Google Scholar]
- Hasinger, G., & van der Klis, M. 1989, A&A, 225, 79 [NASA ADS] [Google Scholar]
- Ji, L., Zhang, S., Chen, Y., et al. 2013, MNRAS, 432, 2773 [NASA ADS] [CrossRef] [Google Scholar]
- Ji, L., Zhang, S., Chen, Y., et al. 2014a, ApJ, 782, 40 [NASA ADS] [CrossRef] [Google Scholar]
- Ji, L., Zhang, S., Chen, Y. P., et al. 2014b, A&A, 564, A20 [NASA ADS] [CrossRef] [EDP Sciences] [Google Scholar]
- Kajava, J. J. E., Sánchez-Fernández, C., Kuulkers, E., & Poutanen, J. 2017, A&A, 599, A89 [NASA ADS] [CrossRef] [EDP Sciences] [Google Scholar]
- Keek, L., Arzoumanian, Z., Bult, P., et al. 2018, ApJ, 855, L4 [NASA ADS] [CrossRef] [Google Scholar]
- Lewin, W. H. G., van Paradijs, J., & Taam, R. E. 1993, Space Sci. Rev., 62, 223 [CrossRef] [Google Scholar]
- Li, C., Zhang, G., Méndez, M., Wang, J., & Lyu, M. 2021, MNRAS, 501, 168 [Google Scholar]
- Lightman, A. P., & Zdziarski, A. A. 1987, ApJ, 319, 643 [NASA ADS] [CrossRef] [Google Scholar]
- Lin, D., Remillard, R. A., & Homan, J. 2009, ApJ, 696, 1257 [NASA ADS] [CrossRef] [Google Scholar]
- Liu, C., Zhang, Y., Li, X., et al. 2020, Sci. China Phys. Mech. Astron., 63, 249503 [NASA ADS] [CrossRef] [Google Scholar]
- Lu, Y., Li, Z., Pan, Y., et al. 2023, A&A, 670, A87 [NASA ADS] [CrossRef] [EDP Sciences] [Google Scholar]
- Maccarone, T. J., & Coppi, P. S. 2003, A&A, 399, 1151 [NASA ADS] [CrossRef] [EDP Sciences] [Google Scholar]
- Maurer, I., & Watts, A. L. 2008, MNRAS, 383, 387 [Google Scholar]
- Mitsuda, K., Inoue, H., Koyama, K., et al. 1984, PASJ, 36, 741 [NASA ADS] [Google Scholar]
- Pandel, D., Kaaret, P., & Corbel, S. 2008, ApJ, 688, 1288 [NASA ADS] [CrossRef] [Google Scholar]
- Schulz, N. S., Hasinger, G., & Truemper, J. 1989, A&A, 225, 48 [NASA ADS] [Google Scholar]
- Sreehari, H., Nandi, A., Radhika, D., Iyer, N., & Mandal, S. 2018, J. Astrophys. Astron., 39, 5 [NASA ADS] [CrossRef] [Google Scholar]
- Strohmayer, T., & Bildsten, L. 2006, Compact stellar X-ray sources, 39, 113 [NASA ADS] [CrossRef] [Google Scholar]
- Strohmayer, T. E., Zhang, W., Swank, J. H., White, N. E., & Lapidus, I. 1998, ApJ, 498, L135 [NASA ADS] [CrossRef] [Google Scholar]
- Tetarenko, B. E., Sivakoff, G. R., Heinke, C. O., & Gladstone, J. C. 2016, VizieR Online Data Catalog: J/ApJS/222/15 [Google Scholar]
- van Paradijs, J., van der Klis, M., van Amerongen, S., et al. 1990, A&A, 234, 181 [NASA ADS] [Google Scholar]
- Wilms, J., Allen, A., & McCray, R. 2000, ApJ, 542, 914 [Google Scholar]
- Yan, Z., Zhang, G., Chen, Y.-P., et al. 2024, MNRAS, 529, 1585 [NASA ADS] [CrossRef] [Google Scholar]
- Zdziarski, A. A., Szanecki, M., Poutanen, J., Gierliński, M., & Biernacki, P. 2020, MNRAS, 492, 5234 [NASA ADS] [CrossRef] [Google Scholar]
- Zhang, G., Méndez, M., Altamirano, D., Belloni, T. M., & Homan, J. 2009, MNRAS, 398, 368 [NASA ADS] [CrossRef] [Google Scholar]
- Zhang, G., Méndez, M., & Altamirano, D. 2011, MNRAS, 413, 1913 [NASA ADS] [CrossRef] [Google Scholar]
- Zhang, S., Lu, F. J., Zhang, S. N., & Li, 2014, in Space Telescopes and Instrumentation 2014: Ultraviolet to Gamma Ray, eds. T. Takahashi, J. W. A. den Herder, & M. Bautz, SPIE Conf. Ser., 9144, 914421 [NASA ADS] [Google Scholar]
- Zhang, S., Zhang, S. N., Lu, F. J., et al. 2018, in Space Telescopes and Instrumentation 2018: Ultraviolet to Gamma Ray, eds. J. W. A. den Herder, S. Nikzad, & K. Nakazawa, SPIE Conf. Ser., 10699, 106991U [NASA ADS] [Google Scholar]
- Zhang, S.-N., Li, T., Lu, F., et al. 2020, Sci. China Phys. Mech. Astron., 63, 249502 [NASA ADS] [CrossRef] [Google Scholar]
- Zhao, G., Li, Z., Pan, Y., et al. 2022, A&A, 660, A31 [NASA ADS] [CrossRef] [EDP Sciences] [Google Scholar]
All Tables
All Figures
|
Fig. 1. Two examples of Insight-HXMT light curves The upper three panels show a burst in soft state; the lower two panels show a burst in hard state with the most significant hard X-ray shortage. The upper panels (from top to bottom) are the LE, ME, and HE light curves during the burst of 4U 1636–536 in 1–10 keV, 6–30 keV, and 40–70 keV, respectively. Time 0 s is the peak flux of the ME. For all bursts the mean value of the pre-burst emission (both persistent emission and instrumental background) is taken as the background, and it is subtracted from the light curves of LE, ME, and HE to obtain the net light curves. |
| In the text | |
|
Fig. 2. Insight-HXMT CCD of 4U 1636–536, where soft-color is defined as the ratio of LE 3–6 keV to 1–3 keV count rates, and hard-color is defined as the ratio of ME 15–20 keV to 10–15 keV count rates. Correction is made by dividing by the count rate of the Crab corresponding to the time and energy band. The time bin of the points is 4 h. The stars are the type I bursts used in the paper. The average error bar is shown in the top right corner. The color bar shows the levels of significance of hard X-ray shortage during the bursts. The bursts in the hard state are classified into four groups based on their positions on the CCD. |
| In the text | |
|
Fig. 3. Simultaneous broadband spectrum of ObsID P011465402801 of 4U 1636–536 is observed from NICER (black), Insight-HXMT/LE (red), Insight-HXMT/ME (green), and Insight-HXMT/HE (blue). |
| In the text | |
|
Fig. 4. Evolution of parameters of the pre-burst continuum spectrum of 4U 1636–536 in 2018: Γ is the low-energy power-law photon index, kTe the electron temperature, Cov_frac the coverage factor, Tin the temperature of the inner disk, and Rin the inner radius of the disk. The black points are the parameters by fitting only with the data of Insight-HXMT. The red points are the parameters by joint fitting of Insight-HXMT and NICER. |
| In the text | |
|
Fig. 5. Correlation of flux and persistent spectral parameters for 4U 1636–536. On the y-axis, σ is the significance of hard X-ray shortage, kTe the electron temperature, and Γ the photon index; on the x-axis Flux is the persistent emission flux of 40–70 keV. Left panel: points corresponding to the pre-burst continuum spectrum of the observation in which each burst of 4U 1636–536 is located. Right panel: bursts stacked in the hard state. The points (from left to right) correspond to the stacking of the bursts in the four regions 1, 2, 3, and 4 in Fig. 2. The spectral parameters are the result of the fit after combining the pre-burst continuum spectra of the observations where these bursts are located. |
| In the text | |
|
Fig. 6. Top panel: spectrum of the persistent emission by HE. Middle panel: detected spectrum of the bursts. Bottom panel: fraction of deficit vs. energy during the bursts detected by HE. Panel a displays the evolution of the fraction of deficit of bursts during the soft state; panels b, c, and d show the same for the hard state, and respectively display all stacked bursts, stacked bursts with insignificant hard shortage, and stacked bursts with significant hard shortage. The red solid line represents the relationship between the fraction of deficit and energy. |
| In the text | |
|
Fig. 7. Top panel: spectrum of persistent emission by HE. Middle panel: detected spectrum of the bursts. Bottom panel: fraction of deficit vs. energy during the bursts detected by HE. Panel a displays the peak (2–12 s) after the bursts merge during the hard state, while panels b, c, and d respectively illustrate the decay of the bursts with time intervals of 12–32 s, 32–62 s, and 62–112 s. The red points in all panels represent the simulated evolution of the deficit fraction of a corona, starting with an initial temperature of 19.8 keV and gradually cooling to different temperatures. The solid red line represents the measured fraction of deficit and energy, while the red dash-dotted line represents the simulated fraction of deficit and energy. |
| In the text | |
|
Fig. 8. Top panel: spectrum of persistent emission by HE. Middle panel: detected spectrum of the bursts. Bottom panel: fraction of deficit vs. energy during the bursts detected by HE. Panels 1, 2, 3, and 4 correspond to the stacking of the bursts in the four regions 1, 2, 3, and 4 of Fig. 2. The red solid line represents the relationship between the fraction of deficit and energy. |
| In the text | |
Current usage metrics show cumulative count of Article Views (full-text article views including HTML views, PDF and ePub downloads, according to the available data) and Abstracts Views on Vision4Press platform.
Data correspond to usage on the plateform after 2015. The current usage metrics is available 48-96 hours after online publication and is updated daily on week days.
Initial download of the metrics may take a while.