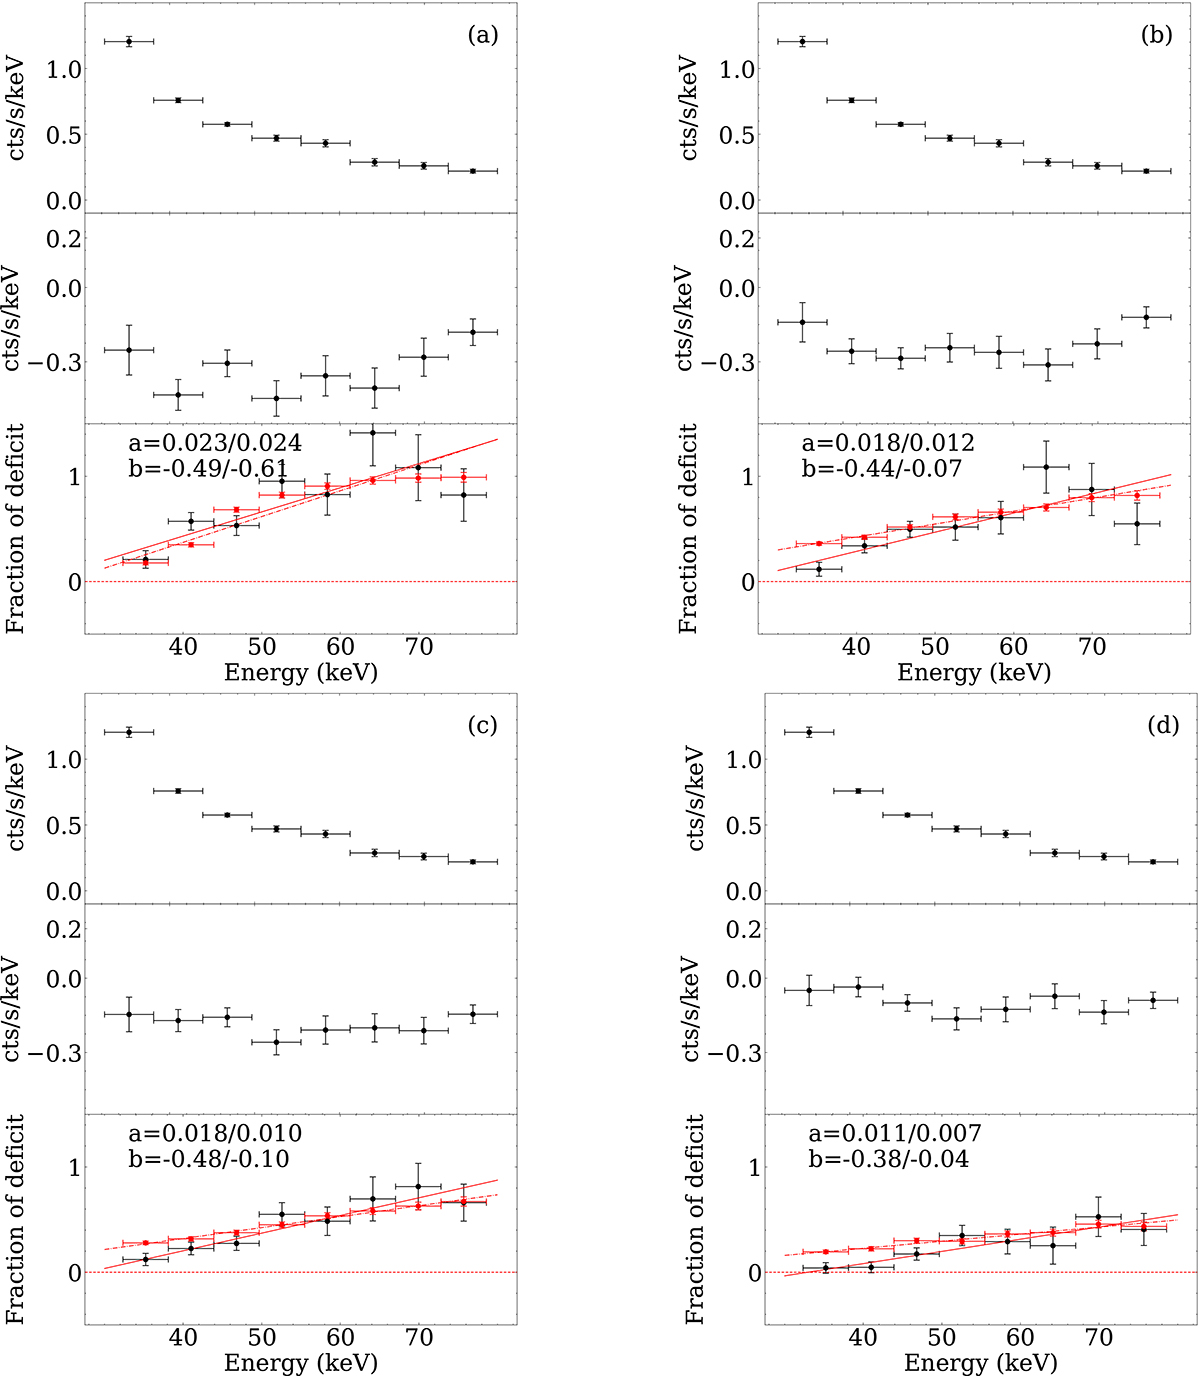
Fig. 7.
Download original image
Top panel: spectrum of persistent emission by HE. Middle panel: detected spectrum of the bursts. Bottom panel: fraction of deficit vs. energy during the bursts detected by HE. Panel a displays the peak (2–12 s) after the bursts merge during the hard state, while panels b, c, and d respectively illustrate the decay of the bursts with time intervals of 12–32 s, 32–62 s, and 62–112 s. The red points in all panels represent the simulated evolution of the deficit fraction of a corona, starting with an initial temperature of 19.8 keV and gradually cooling to different temperatures. The solid red line represents the measured fraction of deficit and energy, while the red dash-dotted line represents the simulated fraction of deficit and energy.
Current usage metrics show cumulative count of Article Views (full-text article views including HTML views, PDF and ePub downloads, according to the available data) and Abstracts Views on Vision4Press platform.
Data correspond to usage on the plateform after 2015. The current usage metrics is available 48-96 hours after online publication and is updated daily on week days.
Initial download of the metrics may take a while.