| Issue |
A&A
Volume 689, September 2024
|
|
|---|---|---|
| Article Number | A47 | |
| Number of page(s) | 11 | |
| Section | Stellar atmospheres | |
| DOI | https://doi.org/10.1051/0004-6361/202348352 | |
| Published online | 30 August 2024 | |
Burst-recurrence properties revealed with Insight-HXMT and NICER for the newly discovered accreting millisecond pulsar MAXI J1816–195
1
Key Laboratory of Particle Astrophysics, Institute of High Energy Physics, Chinese Academy of Sciences,
Beijing
100049,
PR
China
e-mail: This email address is being protected from spambots. You need JavaScript enabled to view it.
; This email address is being protected from spambots. You need JavaScript enabled to view it.
; This email address is being protected from spambots. You need JavaScript enabled to view it.
2
University of Chinese Academy of Sciences, Chinese Academy of Sciences,
Beijing
100049,
PR
China
3
School of Physics and Astronomy, Sun Yat-Sen University,
Zhuhai
519082,
PR
China
4
Institut für Astronomie und Astrophysik, Kepler Center for Astro and Particle Physics, Eberhard Karls Universität,
72076
Tübingen,
Germany
5
CAS Key Laboratory for Research in Galaxies and Cosmology, Department of Astronomy, University of Science and Technology of China,
Hefei
230026,
PR
China
6
School of Astronomy and Space Science, University of Science and Technology of China,
Hefei
230026,
PR
China
7
Key Laboratory of Stars and Interstellar Medium, Xiangtan University, Xiangtan
411105,
Hunan,
PR
China
Received:
23
October
2023
Accepted:
19
June
2024
Abstract
We report the results of our analysis of 83 type-I bursts during the 2022 outburst of the newly discovered accreting millisecond pulsar MAXI J1816–195 based on Insight-HXMT and NICER observations. We focus on the burst-recurrence time and its correlation with persistent flux and outburst evolution. The extensive observations of Insight-HXMT and NICER confirm the presence of quasi-periodic thermonuclear bursts during this outburst, with a recurrence time in the range of 1.15–2 h, which varies with the source persistent flux. The burst recurrence times are, in general, longer at comparable flux levels in the outburst rising phase than those in the fading phase, forming an apparent hysteresis phenomenon. These burst properties make MAXI J1816–195 a unique target for investigating the underlying burst-accretion mechanisms. We discuss the plausible explanations for the hysteresis phenomenon, which appears to be related to changes in the ignition condition or accretion geometry during the outburst.
Key words: X-rays: binaries / X-rays: bursts
© The Authors 2024
 Open Access article, published by EDP Sciences, under the terms of the Creative Commons Attribution License (https://creativecommons.org/licenses/by/4.0), which permits unrestricted use, distribution, and reproduction in any medium, provided the original work is properly cited.
This article is published in open access under the Subscribe to Open model. This email address is being protected from spambots. You need JavaScript enabled to view it. to support open access publication.
1 Introduction
Accreting millisecond pulsars are a class of accreting X-ray pulsars with spin frequencies of greater than 100 Hz. The mass of the donor companion is always less than 1 M⊙, and the accreting material is transferred from the companion via Roche lobe overflow (Di Salvo & Sanna 2020; Patruno & Watts 2021). Thermonuclear bursts have been detected in some accreting millisecond pulsars. Thermonuclear bursts, referred to as type-I X-ray bursts, are due to unstable hydrogen/helium (H/He) burning at the surface of a neutron star (Strohmayer & Bildsten 2006; Galloway et al. 2008; Galloway & Keek 2021). As accretion proceeds, the accreted H/He fuel gradually builds up on the surface of the neutron star, forming a layer several metres thick, and eventually ignites when it reaches thresholds of temperature and density. After the burst occurs, the X-ray flux usually rapidly reaches a peak in less than 10 s, attaining a level of up to several times the persistent flux. The drastic thermonuclear burst burns off the accumulated H/He fuel, followed by a recurrence time typically measured in hours to days, until the accumulated fuel reaches a suitable temperature and density again. Therefore, the burst recurrence time (sometimes referred to as the burst rate) can be used to investigate neutron star accretion, matter accumulation, fuel composition, and unstable burning (Ubertini et al. 1999; Galloway et al. 2004, 2008, 2018; Cavecchi et al. 2020).
The properties of type-I bursts vary with changes to the accretion rate, corresponding to different burst burning compositions, burst recurrence times, and burst profiles. However, within a certain range of accretion rates, type-I bursters may exhibit quasi-periodic bursts with very similar profiles (Ubertini et al. 1999). This indicates that the bursts are triggered consistently within a steady-state regime. Furthermore, a slight increase in the accretion rate causes the bursts to be triggered earlier, resulting in shorter burst recurrence times. This situation was observed for GS 1826–24, which is also commonly known as the clocked burster (Ubertini et al. 1999). GS 1826–24 was observed to have bursts with almost the same profile over years under a rather stable accretion rate. These phenomena make GS 1826–24 a textbook source for studying the nature of thermonuclear bursts (Ubertini et al. 1999; Galloway et al. 2004). Long-term investigations indicate GS 1826–24 shows a monotonically decreasing trend in burst recurrence time with the accretion rate in the hard state (Galloway et al. 2004; Chenevez et al. 2016), as expected from theoretical and numerical simulations (Lampe et al. 2016). However, this smoothed trend was challenged by the April 2003 observations, where the X-ray flux measured by RXTE was seen to diverge from the overall evolution determined by other observations and appears to be underestimated by ~30%. Analyses of the variability and energy spectrum reported by Thompson et al. (2008) suggest that an additional soft component is required in the 2003 observations compared to other instances, potentially compensating for the missing X-ray flux. This extra component might be attributed to the extension of the accretion disk in a radial direction. Generally, the accretion geometry of X-ray binaries is variable, especially in transient sources (Done et al. 2007). Variable accretion geometries contribute to the diverse evolution of the energy spectrum and timing variability, especially regarding the systematic differences between the rising and fading phases of transient source outbursts. An example of this can be seen in the hysteresis of black hole systems, and black hole-like accretion states observed in neutron star systems (Muñoz-Darias et al. 2014).
MAXI J1816–195, a new X-ray millisecond pulsar, was first detected by MAXI in June 2022 (Negoro et al. 2022). Its spin frequency was subsequently obtained by NICER and Insight-HXMT as ~528.6 Hz (Bult et al. 2022a; Li et al. 2023), with an orbital period of 17 402.27 s (Bult et al. 2022b; Li et al. 2023). Near the peak of the outburst in 2022, Insight-HXMT employed a continuous exposure strategy (except during the Earth occultation and South Atlantic Anomaly (SAA)), which allowed the accurate measurement of burst recurrence times and significantly reduced the number of missed bursts due to observational gaps. Based on observations from Insight-HXMT and NICER, we recorded a total of 83 type-I X-ray bursts. Using this substantial sample, we focus on the recurrence behavior of type-I bursts in this paper. We present our results in Section 3, discuss them in Section 4, and provide a summary of our conclusions in Section 5.
2 Observations and data analysis
Insight-HXMT is China’s first X-ray astronomy satellite. Since it was launched in 2017, Insight-HXMT has detected approximately 200 type-I bursts in ten sources over a broad energy band (Chen et al. 2018, 2019, 2021; Li et al. 2021). The three main detectors of Insight-HXMT were designed to meet the scientific aims in a broad energy band (Zhang et al. 2018, 2020). The High Energy X-ray Telescope (HE, 20–250 keV, Zhang et al. 2014; Liu et al. 2020), Medium Energy X-ray Telescope (ME, 5–40 keV, Cao et al. 2020), and Low Energy X-ray Telescope (LE, 1–10 keV, Chen et al. 2020) are made of NaI(Tl)/CsI(Na) phoswich detectors, Si-PIN detectors, and swept charge devices (SCDs), respectively.
Insight-HXMT carried out detailed observations of MAXI J1816–195 during the 2022 outburst following its discovery, and covered almost the entire fading phase. We use the Insight-HXMT processing software HXMTDAS v2.051 and follow the standard processing (The Insight-HXMT Data Reduction Guide v2.052) to extract the event data after screening. For some observations, especially before MJD 59740, the lack of good time interval (GTI) of LE data makes it difficult to study the whole outburst in a broad energy band. Therefore, the NICER observations are combined with Insight-HXMT to compensate for the scarcity of LE data. The detailed exposure times for Insight-HXMT and NICER are provided in Tables A.1 and A.2, respectively.
The Neutron star Interior Composition Explorer (NICER) on board the International Space Station has excellent sensitivity and time resolution, covering 0.2–12 keV (Gendreau et al. 2016). We analyzed the NICER observations of MAXI J1816–195 between MJD 59736 and MJD 59760. The lightly screened (“ufa” file) and screened (“lc” file) event files were reduced using the standard pipeline tool nicerrl23. The spectrum and its background were calculated using the nibackgen3C504 tool (Remillard et al. 2022).
To ensure that no bursts were missed in the statistical analysis of the type-I bursts, we extracted the LE and ME light curves (1 s time resolution) of Insight-HXMT without screening, obtaining a total of 73 type-I burst samples. For the NICER data, we extracted the light curves (1 s time resolution) from the lightly screened event files, obtaining 15 type-I bursts. Of these, 5 type-I burst were also detected with Insight-HXMT (Fig. 1). Therefore, by combining observations from Insight-HXMT and NICER, we obtained a comprehensive sample of 83 type-I bursts. To avoid missing any bursts, all type-I bursts were manually screened by identifying signals that were greater than 5 σ above the average count rate of each light curve.
We exclude the data from 30 s before to 120 s after each burst and take the remaining good times to create the light curves for the persistent emission. For the spectral analysis of the persistent emission, we extracted the data enclosed in the time period from 3840 s (which is 1.1 h minus 120 s) to 30 s before each burst, for both Insight-HXMT and NICER. Joint spectral fittings were performed on 17 simultaneous observations, represented by the blue points in Figure 2, where the source was observed concurrently by NICER, ME, and HE. The spectrum can be fitted by a model of diskbb plus Nthcomp, modified by the Galactic absorption tbabs (Wilms et al. 2000), where NH is fixed to 2.4 × 1022 cm−2, which is the average value obtained from all 17 joint observations when Nh is allowed to vary freely in each fitting. This value is consistent with those reported by Chen et al. (2022) and Mandal et al. (2023). The background dominated the spectra for serval observations at low flux, when the energy exceeded 50.0 keV. Therefore, we fitted the energy spectrum in 1.0–50.0 keV and calculated the bolometric flux using cflux in xspec, and the bolometric persistent flux was calculated within 0.1–200 keV.
Considering that many bursts occur outside of the GTI of observations and that there are only 17 persistent spectra available for broad energy band fitting, we used the interpolate.interp1d function from the scipy package to linearly interpolate the persistent flux and persistent count rate for bursts that occur beyond the time span of these 17 joint observations.
3 Results
3.1 The outburst evolution
The Insight-HXMT observations of the 2022 outburst began close to its peak, whereas the NICER observations captured the rising phase, as shown in Figure 1. The peaks in the outburst light curves across various energy bands occurred at MJD 59740.1 (1.0–10.0 keV), MJD 59739.7 (10.0–30.0 keV), and MJD 59738.2 (30.0–100.0 keV). Therefore, time differences in peak occurrence of >1.9 days and ~0.4 days are observed in the 30.0–100.0 keV and 10.0–30.0 keV energy bands, respectively, relative to the 1.0–10.0 keV energy band. The positions of all 83 type-I bursts detected by Insight-HXMT and NICER are indicated at the top of Figure 1. The majority of these bursts were detected prior to MJD 59748, during which time high levels of persistent outburst flux were present. For a detailed account of the burst properties, such as flux and duration, please refer to Bult et al. (2022c), Chen et al. (2022), and Mandal et al. (2023).
The hardness-intensity diagram (HID) allows visualization of the evolution of the spectral pattern and is commonly used to study the progression of outbursts. As illustrated in Figure 3, the HID presents the hardness-intensity changes throughout the outburst, with the red and blue points distinguishing the different phases of the outburst, where the spectral differences between the rising and fading phases are obvious. During the rising phase of the outburst, the spectral pattern evolves more drastically, with the hardness decreasing from 0.24 to 0.15 within 3 days, while during the longer duration of the fading phase, the hardness remains within a relatively narrow range of 0.11–0.15.
To investigate the factors contributing to the differences between the rising and fading phases of MAXI J1816–195, particularly the dramatic changes in hardness during the rising phase, we have chosen two bursts with comparable bolometric flux from the rising and fading phases, which occurred at MJD 59738.97 and MJD 59741.63, respectively. The persistent spectra before each of these two bursts are shown in Figure 4, which is obtained by joining NICER and Insight-HXMT spectra of the persistent emission. The persistent spectrum can be well fitted with constant*tbabs*(diskbb+Nthcomp) (Chen et al. 2022). The spectral parameters are shown in Table 1. The most obvious difference is the variation of the disk component, which exhibits a lower temperature and larger inner radius during the rising phase compared to the fading phase. Furthermore, the differences between the photon index and the electron temperature indicate variations in the spectral shape between the rising and fading phases, with a harder spectrum noted during the rising phase.
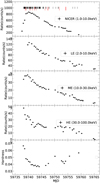 |
Fig. 1 Light curve of the 2022 outburst. Each point in panels 1, 2, 3, and 4 (from top to bottom) represents the persistent rate with the binsize of 12 h for NICER (1.0–10.0 keV), LE (2.0–10.0 keV), ME (10.0–30.0 keV), and HE (30.0–100.0 keV), respectively. The locations of type-I bursts are shown with the vertical solid lines; black and red lines represent the observations of Insight-HXMT and NICER, respectively. Panel 5 represents the evolution of the hardness calculated as the ratio between the ME rate and the NICER rate. |
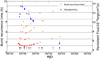 |
Fig. 2 Burst recurrence time vs. burst occurrence time, shown as red points. The range of the y-axis of the burst recurrence time is artificially limited to 0–10 h. The blue points represent the bolometric persistent flux (0.1–200.0 keV) obtained from joint Insight-HXMT and NICER data. The horizontal dashed lines are spaced 1.3 h apart. The black arrows represent the location of bursts presented in Bult et al. (2022c). |
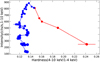 |
Fig. 3 Hardness–intensity diagram of the 2022 outburst with a bin size of 12 h. The hardness is the ratio of the persistent rate of the NICER observation between 4–10 keV and 1–4 keV. The red points indicate the rising phase, and the blue points the fading phase. The size of each point represents the corresponding burst recurrence time in this location. It can be seen that the intensity and hardness of the persistent emission are different between the rising and fading phases, even for similar burst recurrence times. |
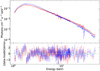 |
Fig. 4 Persistent spectra before each of the two bursts at similar persistent bolometric flux level but different outburst phases. The spectrum in the rising phase is shown in red, while the fading phase is shown in blue. The detailed parameters are presented in Table 1. |
3.2 Quasi-periodic thermonuclear X-ray bursts
The measurement of burst recurrence time is crucial for understanding the nature of bursts; however, it is challenging to obtain precise measurements due to the lack of continuous monitoring data. In this outburst, the high-cadence observational strategy of Insight-HXMT provides us with a rare opportunity to investigate this property. Over the course of ~30 days, a total of 83 type-I X-ray bursts were detected by Insight-HXMT and NICER, with the majority of the bursts being captured by consecutive observations with the ME detector. We define the recurrence time as the interval between the peaks of two neighboring bursts. The uncertainty of the peak time for each burst (the duration of each burst with a count rate above 50 percent of peak count rate is less than 20 s) is significantly less than its recurrence time (>4140 s). Therefore, the error on the burst recurrence time is disregarded in this paper. The histogram of burst recurrence times is presented in Figure 5, which shows that most recurrence times fall within 1–2 h, with a Gaussian fit indicating a most probable value of 1.3 h. The dashed lines in Figure 5 are separated by 1.3 h; another concentrated distribution is noticeable around 2.6 h, with data being slightly more scattered around the other three dashed lines. Manual examination of the light curves confirmed the presence of bursts, suggesting that these additional data clusters could correspond to the primary burst recurrence time of approximately 1.3 h but are influenced by observational gaps. The samples are presented in Figure 6. Figure 6 presents two unscreened light curves with different periods. In the top panel of Figure 6, green dashed lines indicate half-recurrence times where no bursts are present, demonstrating effective detection without Earth obstruction. The absence of bursts at these moments implies that we are observing a reliable fundamental recurrence time, not mistaking harmonic recurrence times for the base frequency due to observational gaps. In the bottom panel of Figure 6, the red dashed and dotted line represents the expected location of the burst if it were not obscured by the Earth, which in turn indicates that the observed harmonic burst recurrence time is caused by observational gaps. Inspired by Ubertini et al. (1999), we propose that the detected type-I bursts have a quasi-periodic property, which is corroborated by the temporal evolution of burst recurrence times illustrated in Figure 2. The red triangles in Figure 2 represent the burst occurrence time against their recurrence time, demonstrating that most recurrence times vary alongside the outburst, following a coherent trend. Some bursts diverge from this primary trend, displaying multiple relationships to it, likely due to observational gaps outside the GTI of the space telescope. Therefore, MAXI J1816–195, as an accreting millisecond pulsar, was found to behave like a clocked burster with quasi-periodic type-I bursts.
In the case of the clocked burster, while the burst profiles may vary slightly at different times, they generally maintain consistency and are of a similar appearance (Galloway et al. 2004). A comparable behavior has been noted for MAXI J1816–195. Bult et al. (2022c) analyzed 15 type-I bursts observed by NICER. The occurrence times of these bursts are presented by the black arrows in Figure 2, and their burst profiles are shown in Figure 2 in Bult et al. (2022c). It can be seen that there is a slight evolution in the profile of the decay phase of the burst; after the peak of the burst, the count rate declines more rapidly as the outburst progresses.
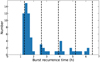 |
Fig. 5 Histogram of the burst recurrence time. The black dashed lines are separated by 1.3 h. The range of the x-axis is artificially limited to 0–7 h. |
3.3 Variation of burst recurrence time with persistent flux
Figure 2 shows the evolution of the burst recurrence time against the occurrence time of the burst for MAXI J1816–195. By focusing on the fundamental burst recurrence time (1–2 h) (as mentioned above, the multiplicity may be the result of missing observations), the minimum burst recurrence time occurs near MJD 59740.630 with 1.15 h. The behavior of burst recurrence times during the rising and fading phases appears asymmetrical. The relationship between the bolometric persistent flux and the recurrence time of these bursts is shown in Figure 7. There is an overall trend of decreasing burst recurrence time as the bolometric flux increases, which is evident in both phases.
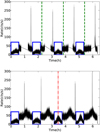 |
Fig. 6 Sample of unscreened light curves of Insight-HXMT. The sharp peaks in the light curves represent the bursts, which occur at regular intervals. The blue rectangles in each panel indicate the periods of observation obscured by the Earth. The top and bottom panels correspond to different observational periods, with the burst recurrence times being approximately 1.6 h for the top panel and 1.2 h for the bottom panel. |
4 Discussion
4.1 First clocked burster source in AMXPs system
We report the burst recurrence properties of the newly discovered transient accreting millisecond pulsar MAXI J1816–195 observed by Insight-HXMT and NICER. We find that the bursts occurring during the outburst are quasi-periodic, with a recurrence time ranging from approximately 1.15–2 h, confirming MAXI J1816–195 as a newly identified clocked burster. Four sources known to exhibit quasi-periodic type-I X-ray bursts have been recognized as clocked burster systems: GS 1826–24 (Ubertini et al. 1999), GS 0836–429 (Aranzana et al. 2016), KS 1731–260 (Cornelisse et al. 2003), and 1RXS J180408.9–342058 (Fiocchi et al. 2019). Apart from GS 1826–24, the other three sources only displayed quasi-periodic type-I X-ray behavior for short periods. GS 1826–24 is the first clocked system to be observed and investigated in detail (Ubertini et al. 1999; Galloway et al. 2004; Thompson et al. 2008), with a burst recurrence time of about 5.76 h (Ubertini et al. 1999). Long-term studies of GS 1826–24 have shown that the burst recurrence time maintains a steady relationship with luminosity during the hard state, decreasing gradually from 5.74 h to 3.56 h as the luminosity rises within the observed range of 0.053 LEdd to 0.089 LEdd (assuming a source distance of 6 kpc and the Eddington luminosity for a typical neutron star of 1.8×1038 erg/s) (Galloway et al. 2004). These X-ray bursts are certified as mixed H/He bursts and exhibit similar profile shapes (Galloway et al. 2004). This result suggests that type-I X-ray bursts can display quasi-periodic behavior within a certain luminosity range, aligning with the theoretical expectation (Lampe et al. 2016). MAXI J1816–195 also exhibits similar features, but on the timescale of a much shorter outburst (~30 days), quasi-periodic H/He type-I burst behavior is observed (Bult et al. 2022c; Chen et al. 2022). Thus, although periodic bursts may require steady accretion or comparable quantities of material accumulation, their accretion rates can produce variations on the order of days. Assuming that the peak of the brightest burst reaches the Eddington luminosity (Chen et al. 2022), we estimate that quasi-periodic bursts occur within the luminosity range of 0.066 LEdd to 0.167 LEdd. This luminosity range coincides with that of GS 1826–24, and suggests that quasi-periodic bursts may occur across a broader range of luminosities.
An interesting characteristic of GS 1826–24 is the anti-correlation between its burst recurrence time and the bolometric persistent flux in the hard state (Galloway et al. 2004; Chenevez et al. 2016). In the case of MAXI J1816–195, we observe two distinct tracks during the rising and fading phases of the outburst, both exhibiting an anti-correlation between burst recurrence time and bolometric persistent flux. Cavecchi et al. (2020) showed that burst recurrence time does not show an anti-correlation with luminosity (accretion rate), even within the same burst regime. Some sources experience a turnover in burst recurrence time (burst rate) when the luminosity (accretion rate) exceeds a critical value, typically ~ 10% of the Eddington value (a more detailed discussion is provided by Galloway et al. 2020). This phenomenon can be explained by the expansion of the stable burning zone on the surface of the neutron star as the accretion rate increases, which ultimately affects the unstable burning and alters the burst recurrence time. Cavecchi et al. (2020) identified an empirical correlation between the Eddington ratio of this critical luminosity and the spin frequency of the neutron star. Using the spin frequency of MAXI J1816–195 and the aforementioned correlation, we can estimate the corresponding Eddington ratio for this source. With a spin frequency of 528.6 Hz for MAXI J1816–195, an Eddington ratio (1.4 M⊙) of ~0.08 LEdd can be estimated from Figure 4 in Cavecchi et al. (2020). Despite the unknown distance of the source, the peak persistent luminosity of the outburst of MAXI J1816–195 can be estimated as 0.167 LEdd, assuming that the peak of the brightest burst reaches the Eddington limit (Chen et al. 2022). This value exceeds the critical luminosity of ~0.08 LEdd (Cavecchi et al. 2020), but no inflection in the burst recurrence time–luminosity relationship is observed. This discrepancy may be due to the fact that the Eddington ratio is used as a reference when estimating the persistent luminosity. The Eddington luminosity used above for this source is estimated by assuming that the peak of the brightest burst reaches the threshold, which may be underestimated in practice. If we assume that the maximum luminosity of MAXI J1816–195 is below 0.08 LEdd, then the luminosity range for the quasi-periodic burst behavior should be corrected to 0.032–0.08 LEdd, which is more consistent with the luminosity range of GS 1826–24.
However, quasi-periodic bursts have been observed in only four sources, which is significantly fewer than the total number of known type-I burst sources. Stable and sustained accretion, complete burning of the accreted fuel, and a constant fuel covering fraction may affect burst triggering and contribute to the scarce samples of clocked bursters. Furthermore, it should be emphasized that none of the previously known clocked burster sources have displayed a pulsating signal, making MAXI J1816–195 the first accreting millisecond pulsar to exhibit clocked burster properties. This discovery may provide new information for the study of clocked bursters.
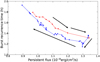 |
Fig. 7 Two branches of the burst recurrence time-persistent flux relation; the bolometric persistent flux corresponding to the burst recurrence time is obtained by interpolation. Red points show branch one, the rising phase (MJD 59738.310–MJD 59739.361). Blue points show branch two, the fading phase (MJD 59739.361–MJD 59746.740). Arrows represent the time evolution. |
4.2 Measurement of bolometric persistent flux
In general, the primary X-ray emission is contained within the energy range of 0.1–200 keV. The measurement of the bolometric flux relies on extrapolating the energy spectrum measured within a narrow energy range (Anastasopoulou et al. 2022). The determination of the bolometric flux may be limited by the energy range of the instrument used. Therefore, broad energy band observations are crucial for constraining the relationship between the burst recurrence time and the bolometric persistent flux.
Using the standard quasi-periodic burst behavior of the source GS 1826–24 (Ubertini et al. 1999; Galloway et al. 2004) as an example, some observations of RXTE occasionally show a deviation from the monotonous burst recurrence time–flux relationship. This deviation was eventually corrected by the addition of a soft component, by using XMM-Newton data in a lower energy band (Thompson et al. 2008). Therefore, observations across a broad energy spectrum are crucial for constraining the persistent flux, which can significantly influence the observed burst recurrence time–flux relationship. Unfortunately, no XMM-Newton observations are available for the outburst of MAXI J1816–195 in the data archive. Nevertheless, the lack of low-energy coverage should not pose a significant problem for MAXI J1816–195, thanks to the combined data from Insight-HXMT and NICER, which extend down to 1 keV. The energy spectrum can be well fitted with the physical model diskbb plus the thermal compton spectrum Nthcomp, without the need for additional components.
4.3 Ignition variability
MAXI J1816–195 exhibits a burst recurrence time evolution similar to that of the classical clocked burster GS 1826–24. However, MAXI J1816–195 shows an inconsistent pattern in the rising and fading phases of the outburst. Specifically, the burst recurrence time during the rising phase is generally longer than during the fading phase when comparing similar flux levels. This result indicates that MAXI J1816–195 may have undergone a hysteresis phenomenon.
This phenomenon can be considered from two perspectives. The first is the variation in burst recurrence times at a consistent observed persistent flux. The second is the variation in observed persistent flux at consistent burst recurrence times. Burst production is, however, significantly influenced by the accretion rate. Therefore, correlating either the burst recurrence time or the observed persistent flux with the accretion rate leads to varying interpretations of the phenomenon depicted in Figure 7. If the observed persistent flux is assumed to correspond one-to-one to the source’s accretion rate, this implies that bursts are triggered earlier or later for the same accretion rate of the rising and fading phases, which may come from the different fuel compositions of the bursts at rising and fading phases. Variations in the H-abundance of the fuel can alter the ignition conditions of a burst, which may lead to the triggering of bursts earlier or later than expected. The variation in fuel composition was employed to explain the differing burst rates observed during the rising and fading phases of the 2008 outburst in IGR J17473–2721, as discussed by Chenevez et al. (2011).
The fuel composition in bursts is typically estimated using the α-factor (Galloway et al. 2008). In bursts where the fuel is H-dominated, the α-factor is below 100. However, the precision of the α-factor is contingent upon the measurement accuracy of the persistent flux, burst fluence, and burst recurrence time. For this study, we used the burst fluences reported by Chen et al. (2022), along with the persistent flux and burst recurrence time data obtained herein, to calculate the α-factor. Given that most bursts lack LE observations (in the low-energy band), only those bursts with both LE and ME observations and precise persistent flux measurements were considered. Table 2 presents the precise α-factor for the bursts observed by Insight-HXMT. It appears that there is no significant variation in the α-factor between MJD 58738.788469 and MJD 599744.158801, which seems to contradict the changes in α-factor reported for different bursts by Bult et al. (2022c). However, it is worth noting that the α-factors of the last two bursts mentioned in Bult et al. (2022c) occur in the end phase of the outburst and the measurement of their persistent flux is limited by the observed energy bands of NICER. Among the α-factor results presented in this paper (Table 2), only one burst (MJD 59738.788469) occurred during the rising phase of the outburst. Therefore, it is challenging to ascertain whether a difference in α-factor exists between the rising and fading phases of the outburst, which may be responsible for the observed hysteresis in burst recurrence.
4.4 Variation of radiation geometry
As mentioned in Section 4.3, if we assume stable and sustained accretion and consistent burst triggering conditions, the burst recurrence time can reflect the real accretion rate of the source. The discrepancy in bolometric persistent fluxes observed during the rising and fading phases at identical burst recurrence times might indicate a mismatch between the observed flux and the real accretion rate. Previous studies of LMXB systems based on timing and spectral analysis indicate that the persistent bolometric flux does not directly point to the accretion rate (van der Klis et al. 1990), despite common assumptions of their one-to-one correlation. The different bolometric persistent fluxes during the rising and fading phases at the same burst recurrence might result from the variation of radiative anisotropy between the rising and fading phases. The observed persistent flux is inversely proportional to the degree of anisotropy in a way shown by Equation (2) in Galloway et al. (2004). The distinct energy spectrum differences between the rising and fading phases imply corresponding alterations in accretion geometry, potentially causing varying radiative anisotropies. The radiation pattern for X-ray binaries is in general considered to include a multiple temperature blackbody of the disk and a Comptonspectrum contributed by the corona (Done et al. 2007). The corona covers both sides of the disk or the neutron star and varies throughout the outburst and could be affected by thermonuclear bursts (Chen et al. 2022). Although spectra with similar bolometric persistent fluxes are reported in Table 1 for the ending and initial stages of the outburst’s rising and fading phases, the hardness evolution with intensity (Figure 3) demonstrates significant changes during the outburst. This rapid decrease in hardness, indicating spectral softening, suggests dramatic disk or corona evolution throughout the outburst. To identify which component predominantly contributes to the flux differences between the rising and fading phases, we examined each component’s bolometric flux from diskbb and Nthcomp as displayed in Figure 8. The relative magnitude of the flux in the rising and fading phases is different for the component of diskbb and Nthcomp. Both components show a hysteresis phenomenon, but in opposite ways. The bolometric flux of Nthcomp shows the same trend as that shown in Figure 7, but with larger flux differences between the rising and fading stages at the same burst recurrence time. However, the bolometric flux of diskbb shows the opposite trend to that shown in Figure 7. This indicates that the hysteresis effect of the total flux is primarily determined by the Nthcomp component, originating from the corona.
The more dominant corona emission (e.g., a higher flux accompanied by a smaller spectral index and larger inner accretion radius) of the rising phase may correspond to an accretion geometry whereby the inner disk region is filled by corona and hence the overall accretion geometry of the rising phase could resemble that shown in Figure 9a. A steeper spectrum (e.g., a larger spectral index) in the fading phase could be the result of a decreased contribution from the corona. Accompanied with a smaller inner accretion radius as shown in Table 1, the accretion geometry in the fading phase may be in a form similar to that shown in Figure 9b, where the corona is thinner in the inner region than inthe outer region. The varying inclinations of the corona with respect to the observer can modulate the observed fluxes during the rising and fading phases. Considering the optical depth of the corona of τ ~ 5, as reported by Chen et al. (2022), the corona is optically thick, which can contribute to an inclination effect. Taking into account the observational inclination angle, changes in accretion geometry could result in apparent differences in observed flux under constant accretion rates: a distant observer would perceive a lower flux during the fading phase. In other words, the hysteresis phenomenon observed in MAXI J1816–195 might be due to an apparent decrease in flux during the fading phase if the corona presents a larger viewing angle (and correspondingly a smaller projected area) to the distant observer. The bottom panel of Figure 8 demonstrates that the corona’s bolometric flux during the rising phase is approximately 18% greater than during the fading phase for equivalent burst recurrence times. Given that the corona is optically thick (τ ~ 5), we can apply the anisotropy factor of ![Mathematical equation: $\[\xi_{\mathrm{p}}^{-1}=2|\cos \theta|\]$](/articles/aa/full_html/2024/09/aa48352-23/aa48352-23-eq28.png) derived by He & Keek (2016) for a flat, optically thick situation with an average corona inclination of 45°. The observed 18% change in flux could be explained by a variation in corona inclination of ~10°.
derived by He & Keek (2016) for a flat, optically thick situation with an average corona inclination of 45°. The observed 18% change in flux could be explained by a variation in corona inclination of ~10°.
Parameters of bursts observed by both LE and ME.
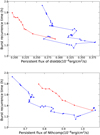 |
Fig. 8 Relation between the burst recurrence time and the bolometric persistent flux of different spectral components. Top panel: burst recurrence time vs. the bolometric persistent flux of diskbb. The red and blue points represent the rising and fading phases of outburst, respectively. Bottom panel: same as top panel, but with the bolometric persistent flux of Nthcomp. |
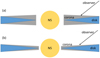 |
Fig. 9 Possible accretion geometries of rising (panel a) and fading (panel b) phases within the same bolometric persistent flux. |
5 Conclusion
We elucidate the burst recurrence properties of the newly discovered accreting millisecond pulsar MAXI J1816–195 using high-cadence observations obtained using Insight-HXMT and NICER during the outburst. We find that several quasi-periodic bursts show hysteresis in their recurrence time evolution with bolometric persistent flux. These discoveries provide new clues as to the relationship between the burst and the accretion environment.
Acknowledgements
This work is supported by the National Key R&D Program of China (2021 YFA0718500), Guangdong Major Project of Basic and Applied Basic Research (Grant No. 2019B030302001) and the National Natural Science Foundation of China under grants U2038101, U1838201, U1838202, U1938101, 12173103, U2031205, U1938103, 11733009, U1938107, 12273030. This work was partially supported by International Partnership Program of Chinese Academy of Sciences (Grant No. 113111KYSB20190020). This work made use of data from the Insight-HXMT mission, a project funded by China National Space Administration (CNSA) and the Chinese Academy of Sciences (CAS). The data of NICER obtained through the High Energy Astrophysics Science Archive Research Center (HEASARC). Lingda Kong is grateful for the financial support provided by the Sino-German (CSC-DAAD) Postdoc Scholarship Program 57607866).
Appendix A Insight-HXMT and nicer observations
The exposure times and observed burst peak times of Insight-HXMT observations.
The exposure times and observed burst peak times of NICER observations.
References
- Anastasopoulou, K., Zezas, A., Steiner, J. F., et al. 2022, MNRAS, 513, 1400 [NASA ADS] [CrossRef] [Google Scholar]
- Aranzana, E., Sánchez-Fernández, C., & Kuulkers, E. 2016, A&A, 586, A142 [NASA ADS] [CrossRef] [EDP Sciences] [Google Scholar]
- Bildsten, L. 1998, The Many Faces of Neutron Stars, 515, 419 [NASA ADS] [CrossRef] [Google Scholar]
- Bildsten, L. 2000, Cosmic Explosions: Tenth AstroPhysics Conference, 522, 359 [Google Scholar]
- Brown, E. F., & Cumming, A. 2009, ApJ, 698, 1020 [NASA ADS] [CrossRef] [Google Scholar]
- Bult, P. M., Ng, M., Altamirano, W. I. D., et al. 2022a, The Astronomer’s Telegram, 15425 [Google Scholar]
- Bult, P. M., Sanna, A., Ng, M., et al. 2022b, The Astronomer’s Telegram, 15431 [Google Scholar]
- Bult, P., Altamirano, D., Arzoumanian, Z., et al. 2022c, ApJ, 935, L32 [NASA ADS] [CrossRef] [Google Scholar]
- Cao, X., Jiang, W., Meng, B., et al. 2020, Sci. China Phys. Mech. Astron., 63, 249504 [NASA ADS] [CrossRef] [Google Scholar]
- Cavecchi, Y., Galloway, D. K., Goodwin, A. J., et al. 2020, MNRAS, 499, 2148 [NASA ADS] [CrossRef] [Google Scholar]
- Chen, Y. P., Zhang, S., Qu, J. L., et al. 2018, ApJ, 864, L30 [NASA ADS] [CrossRef] [Google Scholar]
- Chen, Y. P., Zhang, S., Zhang, S. N., et al. 2019, J. High Energy Astrophys., 24, 23 [CrossRef] [Google Scholar]
- Chen, Y., Cui, W., Li, W., et al. 2020, Sci. China Phys. Mech. Astron., 63, 249505 [NASA ADS] [CrossRef] [Google Scholar]
- Chen, Y. P., Zhang, S., Zhang, S. N., et al. 2021, ApJ, 913, 150 [NASA ADS] [CrossRef] [Google Scholar]
- Chen, Y.-P., Zhang, S., Ji, L., et al. 2022, ApJ, 936, L21 [CrossRef] [Google Scholar]
- Chenevez, J., Altamirano, D., Galloway, D. K., et al. 2011, MNRAS, 410, 179 [NASA ADS] [CrossRef] [Google Scholar]
- Chenevez, J., Galloway, D. K., in ’t Zand, J. J. M., et al. 2016, ApJ, 818, 135 [NASA ADS] [CrossRef] [Google Scholar]
- Cornelisse, R., in’t Zand, J. J. M., Verbunt, F., et al. 2003, A&A, 405, 1033 [NASA ADS] [CrossRef] [EDP Sciences] [Google Scholar]
- Di Salvo, T., & Sanna, A. 2020, arXiv e-prints [arXiv:2010.09005] [Google Scholar]
- Done, C., Gierliński, M., & Kubota, A. 2007, A&A Rev., 15, 1 [CrossRef] [Google Scholar]
- Falanga, M., Kuiper, L., Poutanen, J., et al. 2011, A&A, 529, A68 [NASA ADS] [CrossRef] [EDP Sciences] [Google Scholar]
- Fiocchi, M., Bazzano, A., Bruni, G., et al. 2019, ApJ, 887, 30 [CrossRef] [Google Scholar]
- Galloway, D. K., & Keek, L. 2021, Timing Neutron Stars: Pulsations, Oscillations and Explosions, 461, 209 [NASA ADS] [CrossRef] [Google Scholar]
- Galloway, D. K., Cumming, A., Kuulkers, E., et al. 2004, ApJ, 601, 466 [NASA ADS] [CrossRef] [Google Scholar]
- Galloway, D. K., Muno, M. P., Hartman, J. M., et al. 2008, ApJS, 179, 360 [Google Scholar]
- Galloway, D. K., in ’t Zand, J. J. M., Chenevez, J., et al. 2018, ApJ, 857, L24 [NASA ADS] [CrossRef] [Google Scholar]
- Galloway, D. K., in’t Zand, J., Chenevez, J., et al. 2020, ApJS, 249, 32 [NASA ADS] [CrossRef] [Google Scholar]
- Gendreau, K. C., Arzoumanian, Z., Adkins, P. W., et al. 2016, Proc. SPIE, 9905, 99051H [NASA ADS] [CrossRef] [Google Scholar]
- Grebenev, S. A., & Chelovekov, I. V. 2018, Astron. Lett., 44, 777 [CrossRef] [Google Scholar]
- He, C.-C., & Keek, L. 2016, ApJ, 819, 47 [NASA ADS] [CrossRef] [Google Scholar]
- Lampe, N., Heger, A., & Galloway, D. K. 2016, ApJ, 819, 46 [NASA ADS] [CrossRef] [Google Scholar]
- Li, Z., Pan, Y., & Falanga, M. 2021, ApJ, 920, 35 [NASA ADS] [CrossRef] [Google Scholar]
- Li, Z., Kuiper, L., Ge, M., et al., 2023, ApJ, 958, 177 [CrossRef] [Google Scholar]
- Liu, C., Zhang, Y., Li, X., et al. 2020, Sci. China Phys. Mech. Astron., 63, 249503 [NASA ADS] [CrossRef] [Google Scholar]
- Maurer, I., & Watts, A. L. 2008, MNRAS, 383, 387 [Google Scholar]
- Mandal, M., Pal, S., Chauhan, J., et al. 2023, MNRAS, 521, 881 [NASA ADS] [CrossRef] [Google Scholar]
- Muñoz-Darias, T., Fender, R. P., Motta, S. E., et al. 2014, MNRAS, 443, 3270 [CrossRef] [Google Scholar]
- Negoro, H., Serino, M., Iwakiri, W. 2022, ATEL, 15425 [Google Scholar]
- Patruno, A., & Watts, A. L. 2021, Astrophys. Space Sci. Libr., 461, 143 [NASA ADS] [CrossRef] [Google Scholar]
- Remillard, R. A., Loewenstein, M., Steiner, J. F., et al. 2022, AJ, 163, 130 [NASA ADS] [CrossRef] [Google Scholar]
- Spitkovsky, A., Levin, Y., & Ushomirsky, G. 2002, ApJ, 566, 1018 [Google Scholar]
- Strohmayer, T., & Bildsten, L. 2006, Compact Stellar X-ray Sources, 113 [CrossRef] [Google Scholar]
- Thompson, T. W. J., Galloway, D. K., Rothschild, R. E., et al. 2008, ApJ, 681, 506 [NASA ADS] [CrossRef] [Google Scholar]
- Ubertini, P., Bazzano, A., Cocchi, M., et al. 1999, ApJ, 514, L27 [NASA ADS] [CrossRef] [Google Scholar]
- van der Klis, M., Hasinger, G., Damen, E., et al. 1990, ApJ, 360, L19 [NASA ADS] [CrossRef] [Google Scholar]
- Weng, S.-S., Cai, Z.-Y., Zhang, S.-N., et al. 2021, ApJ, 915, L15 [NASA ADS] [CrossRef] [Google Scholar]
- Wijnands, R., Degenaar, N., & Page, D. 2017, J. Astrophys. Astron., 38, 49 [NASA ADS] [CrossRef] [Google Scholar]
- Wilms, J., Allen, A., & McCray, R. 2000, ApJ, 542, 914 [Google Scholar]
- Zhang, S., Lu, F. J., Zhang, S. N., et al. 2014, Proc. SPIE, 9144, 914421 [NASA ADS] [CrossRef] [Google Scholar]
- Zhang, S., Zhang, S. N., Lu, F. J., et al. 2018, Proc. SPIE, 10699, 106991U [NASA ADS] [Google Scholar]
- Zhang, S.-N., Li, T., Lu, F., et al. 2020, Sci. China Phys. Mech. Astron., 63, 249502 [NASA ADS] [CrossRef] [Google Scholar]
All Tables
All Figures
|
Fig. 1 Light curve of the 2022 outburst. Each point in panels 1, 2, 3, and 4 (from top to bottom) represents the persistent rate with the binsize of 12 h for NICER (1.0–10.0 keV), LE (2.0–10.0 keV), ME (10.0–30.0 keV), and HE (30.0–100.0 keV), respectively. The locations of type-I bursts are shown with the vertical solid lines; black and red lines represent the observations of Insight-HXMT and NICER, respectively. Panel 5 represents the evolution of the hardness calculated as the ratio between the ME rate and the NICER rate. |
| In the text | |
|
Fig. 2 Burst recurrence time vs. burst occurrence time, shown as red points. The range of the y-axis of the burst recurrence time is artificially limited to 0–10 h. The blue points represent the bolometric persistent flux (0.1–200.0 keV) obtained from joint Insight-HXMT and NICER data. The horizontal dashed lines are spaced 1.3 h apart. The black arrows represent the location of bursts presented in Bult et al. (2022c). |
| In the text | |
|
Fig. 3 Hardness–intensity diagram of the 2022 outburst with a bin size of 12 h. The hardness is the ratio of the persistent rate of the NICER observation between 4–10 keV and 1–4 keV. The red points indicate the rising phase, and the blue points the fading phase. The size of each point represents the corresponding burst recurrence time in this location. It can be seen that the intensity and hardness of the persistent emission are different between the rising and fading phases, even for similar burst recurrence times. |
| In the text | |
|
Fig. 4 Persistent spectra before each of the two bursts at similar persistent bolometric flux level but different outburst phases. The spectrum in the rising phase is shown in red, while the fading phase is shown in blue. The detailed parameters are presented in Table 1. |
| In the text | |
|
Fig. 5 Histogram of the burst recurrence time. The black dashed lines are separated by 1.3 h. The range of the x-axis is artificially limited to 0–7 h. |
| In the text | |
|
Fig. 6 Sample of unscreened light curves of Insight-HXMT. The sharp peaks in the light curves represent the bursts, which occur at regular intervals. The blue rectangles in each panel indicate the periods of observation obscured by the Earth. The top and bottom panels correspond to different observational periods, with the burst recurrence times being approximately 1.6 h for the top panel and 1.2 h for the bottom panel. |
| In the text | |
|
Fig. 7 Two branches of the burst recurrence time-persistent flux relation; the bolometric persistent flux corresponding to the burst recurrence time is obtained by interpolation. Red points show branch one, the rising phase (MJD 59738.310–MJD 59739.361). Blue points show branch two, the fading phase (MJD 59739.361–MJD 59746.740). Arrows represent the time evolution. |
| In the text | |
|
Fig. 8 Relation between the burst recurrence time and the bolometric persistent flux of different spectral components. Top panel: burst recurrence time vs. the bolometric persistent flux of diskbb. The red and blue points represent the rising and fading phases of outburst, respectively. Bottom panel: same as top panel, but with the bolometric persistent flux of Nthcomp. |
| In the text | |
|
Fig. 9 Possible accretion geometries of rising (panel a) and fading (panel b) phases within the same bolometric persistent flux. |
| In the text | |
Current usage metrics show cumulative count of Article Views (full-text article views including HTML views, PDF and ePub downloads, according to the available data) and Abstracts Views on Vision4Press platform.
Data correspond to usage on the plateform after 2015. The current usage metrics is available 48-96 hours after online publication and is updated daily on week days.
Initial download of the metrics may take a while.