Fig. 3
Download original image
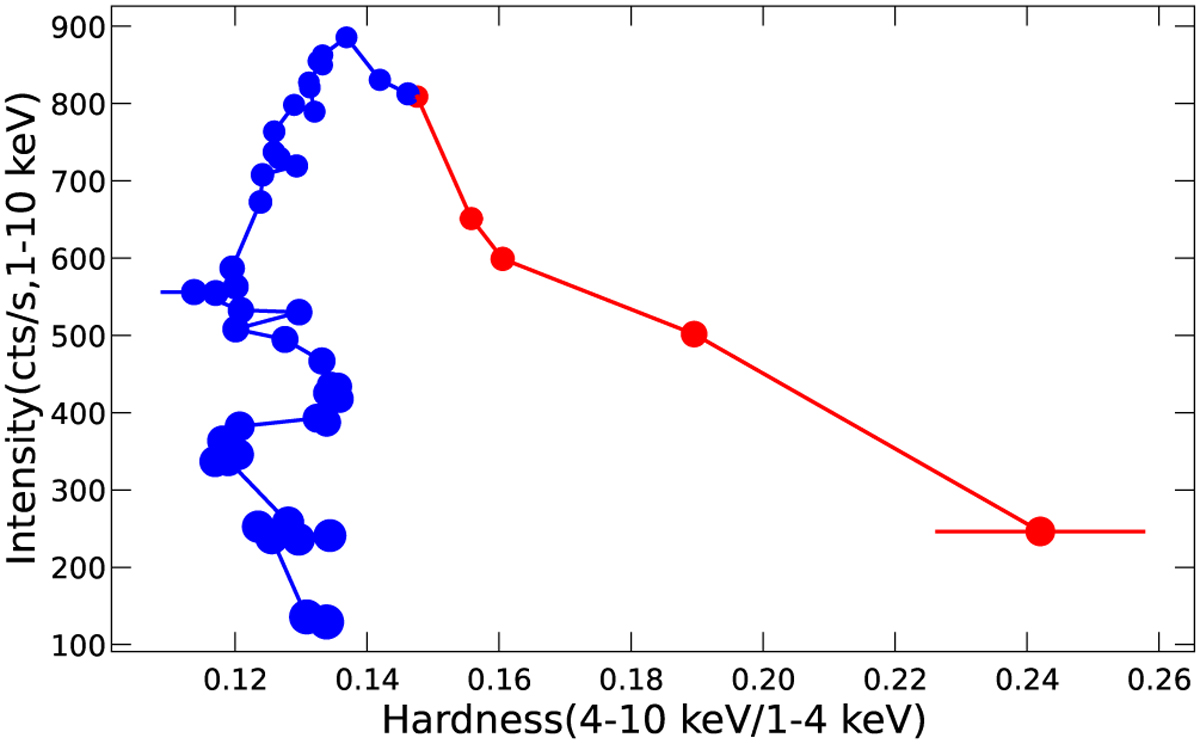
Hardness–intensity diagram of the 2022 outburst with a bin size of 12 h. The hardness is the ratio of the persistent rate of the NICER observation between 4–10 keV and 1–4 keV. The red points indicate the rising phase, and the blue points the fading phase. The size of each point represents the corresponding burst recurrence time in this location. It can be seen that the intensity and hardness of the persistent emission are different between the rising and fading phases, even for similar burst recurrence times.
Current usage metrics show cumulative count of Article Views (full-text article views including HTML views, PDF and ePub downloads, according to the available data) and Abstracts Views on Vision4Press platform.
Data correspond to usage on the plateform after 2015. The current usage metrics is available 48-96 hours after online publication and is updated daily on week days.
Initial download of the metrics may take a while.