Fig. 2
Download original image
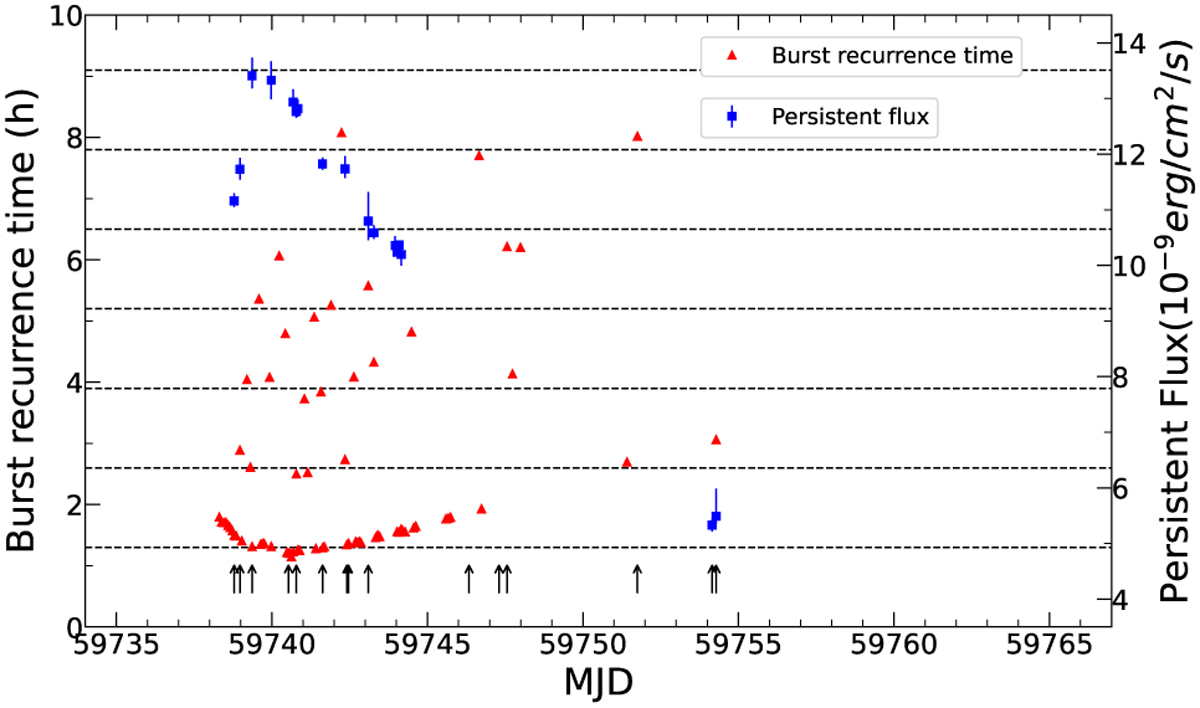
Burst recurrence time vs. burst occurrence time, shown as red points. The range of the y-axis of the burst recurrence time is artificially limited to 0–10 h. The blue points represent the bolometric persistent flux (0.1–200.0 keV) obtained from joint Insight-HXMT and NICER data. The horizontal dashed lines are spaced 1.3 h apart. The black arrows represent the location of bursts presented in Bult et al. (2022c).
Current usage metrics show cumulative count of Article Views (full-text article views including HTML views, PDF and ePub downloads, according to the available data) and Abstracts Views on Vision4Press platform.
Data correspond to usage on the plateform after 2015. The current usage metrics is available 48-96 hours after online publication and is updated daily on week days.
Initial download of the metrics may take a while.