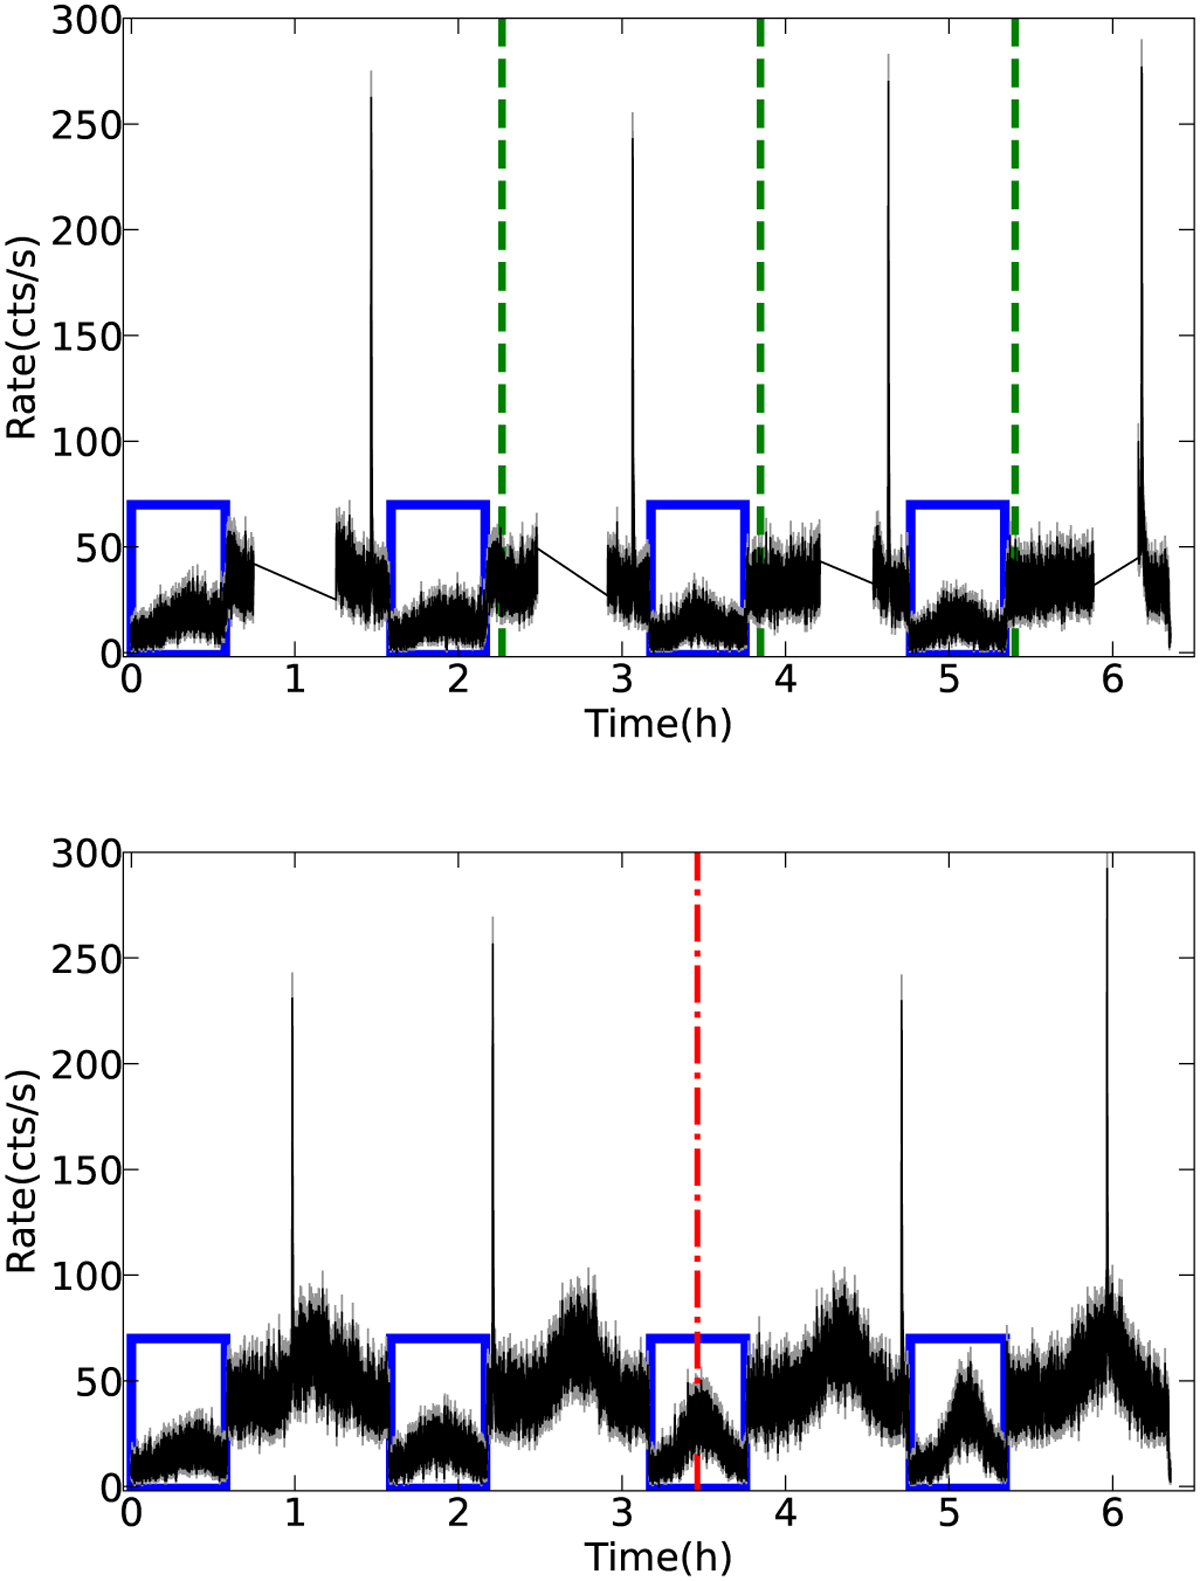
Fig. 6
Download original image
Sample of unscreened light curves of Insight-HXMT. The sharp peaks in the light curves represent the bursts, which occur at regular intervals. The blue rectangles in each panel indicate the periods of observation obscured by the Earth. The top and bottom panels correspond to different observational periods, with the burst recurrence times being approximately 1.6 h for the top panel and 1.2 h for the bottom panel.
Current usage metrics show cumulative count of Article Views (full-text article views including HTML views, PDF and ePub downloads, according to the available data) and Abstracts Views on Vision4Press platform.
Data correspond to usage on the plateform after 2015. The current usage metrics is available 48-96 hours after online publication and is updated daily on week days.
Initial download of the metrics may take a while.