Fig. 1
Download original image
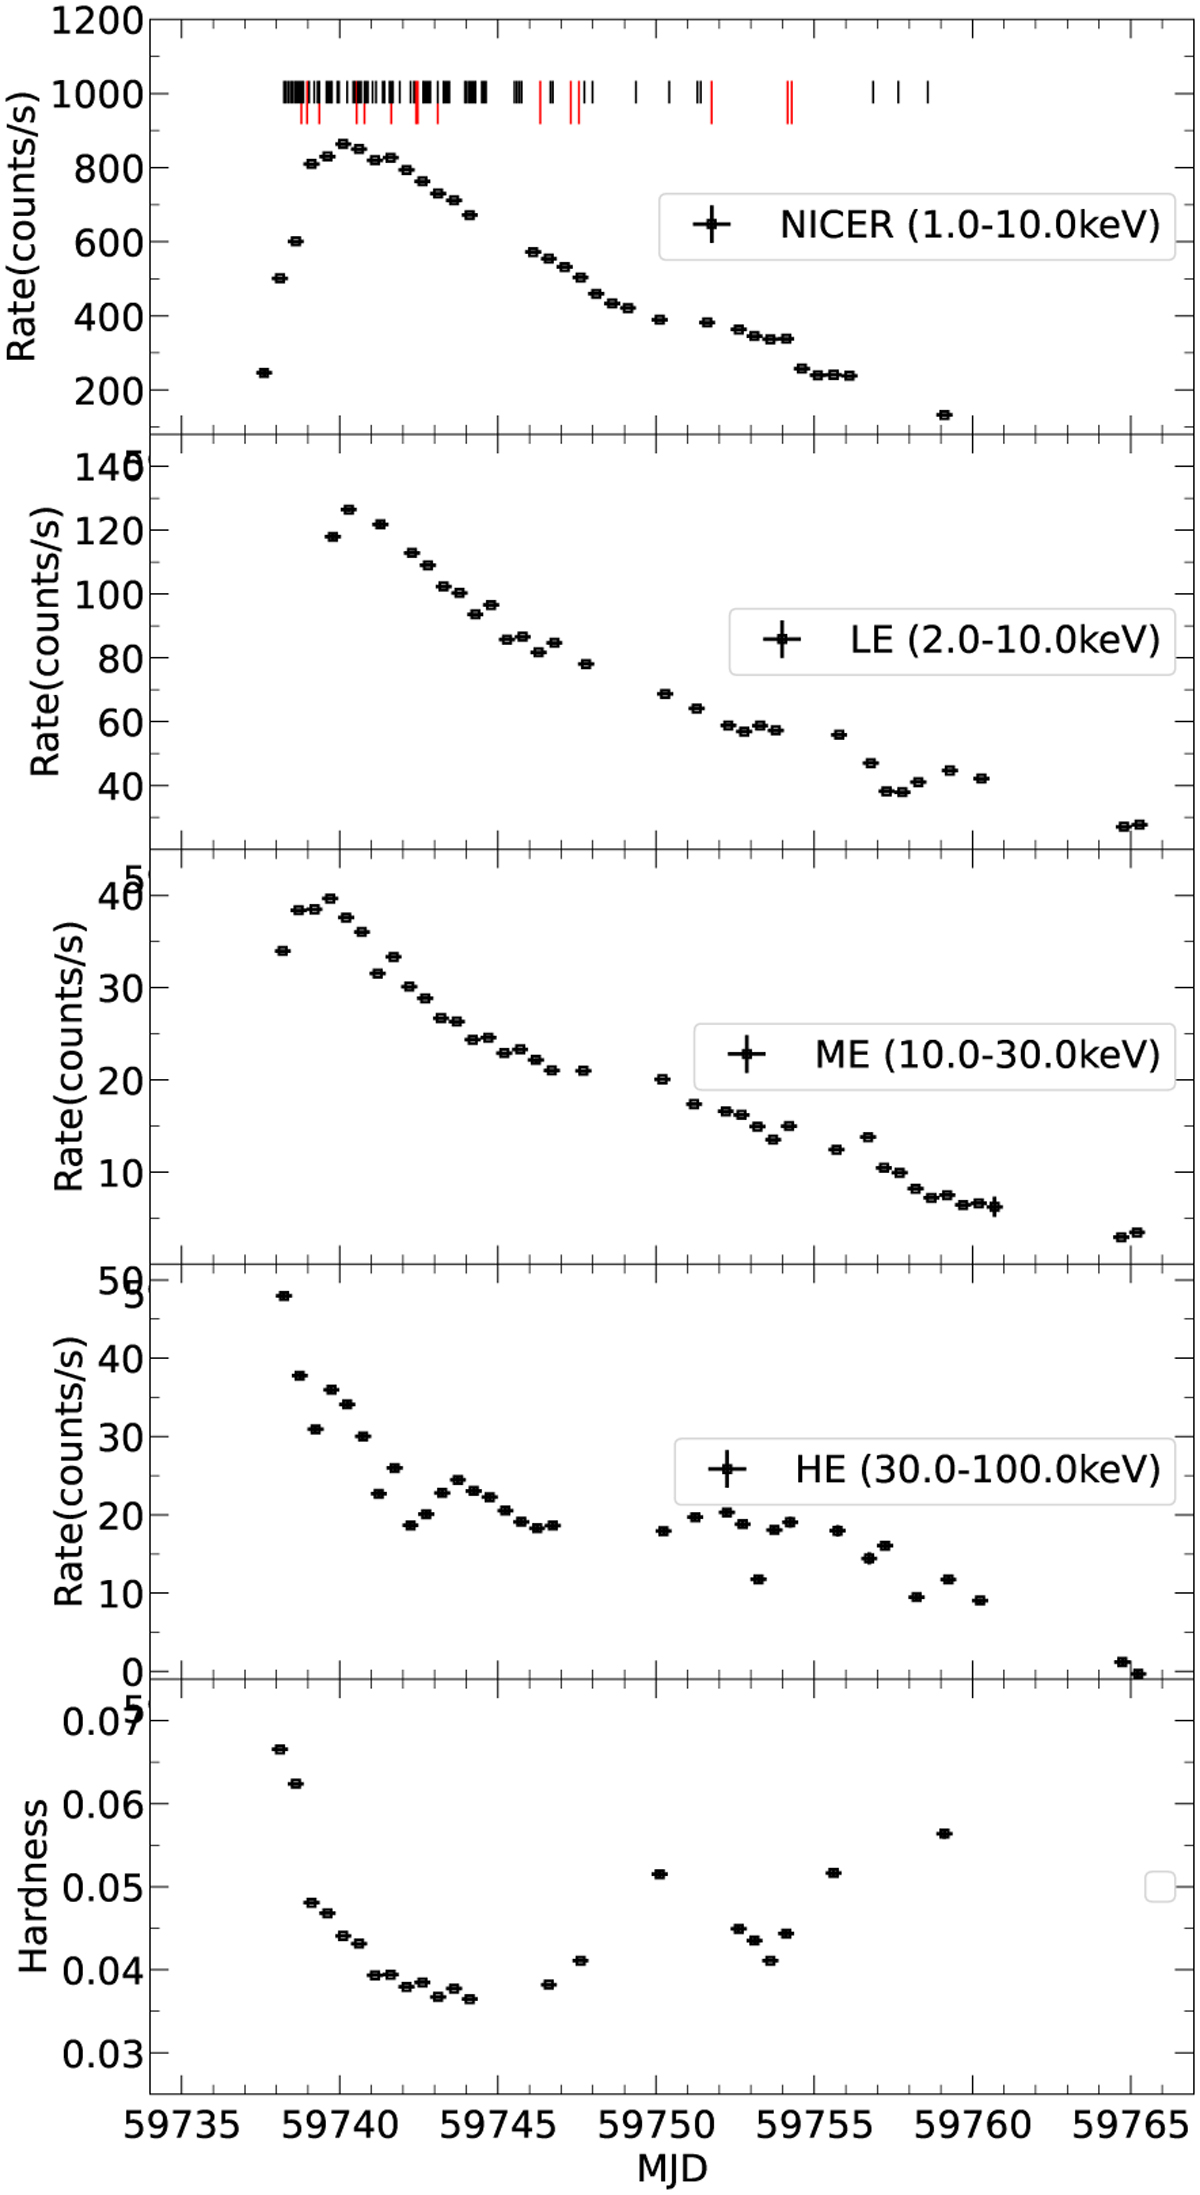
Light curve of the 2022 outburst. Each point in panels 1, 2, 3, and 4 (from top to bottom) represents the persistent rate with the binsize of 12 h for NICER (1.0–10.0 keV), LE (2.0–10.0 keV), ME (10.0–30.0 keV), and HE (30.0–100.0 keV), respectively. The locations of type-I bursts are shown with the vertical solid lines; black and red lines represent the observations of Insight-HXMT and NICER, respectively. Panel 5 represents the evolution of the hardness calculated as the ratio between the ME rate and the NICER rate.
Current usage metrics show cumulative count of Article Views (full-text article views including HTML views, PDF and ePub downloads, according to the available data) and Abstracts Views on Vision4Press platform.
Data correspond to usage on the plateform after 2015. The current usage metrics is available 48-96 hours after online publication and is updated daily on week days.
Initial download of the metrics may take a while.