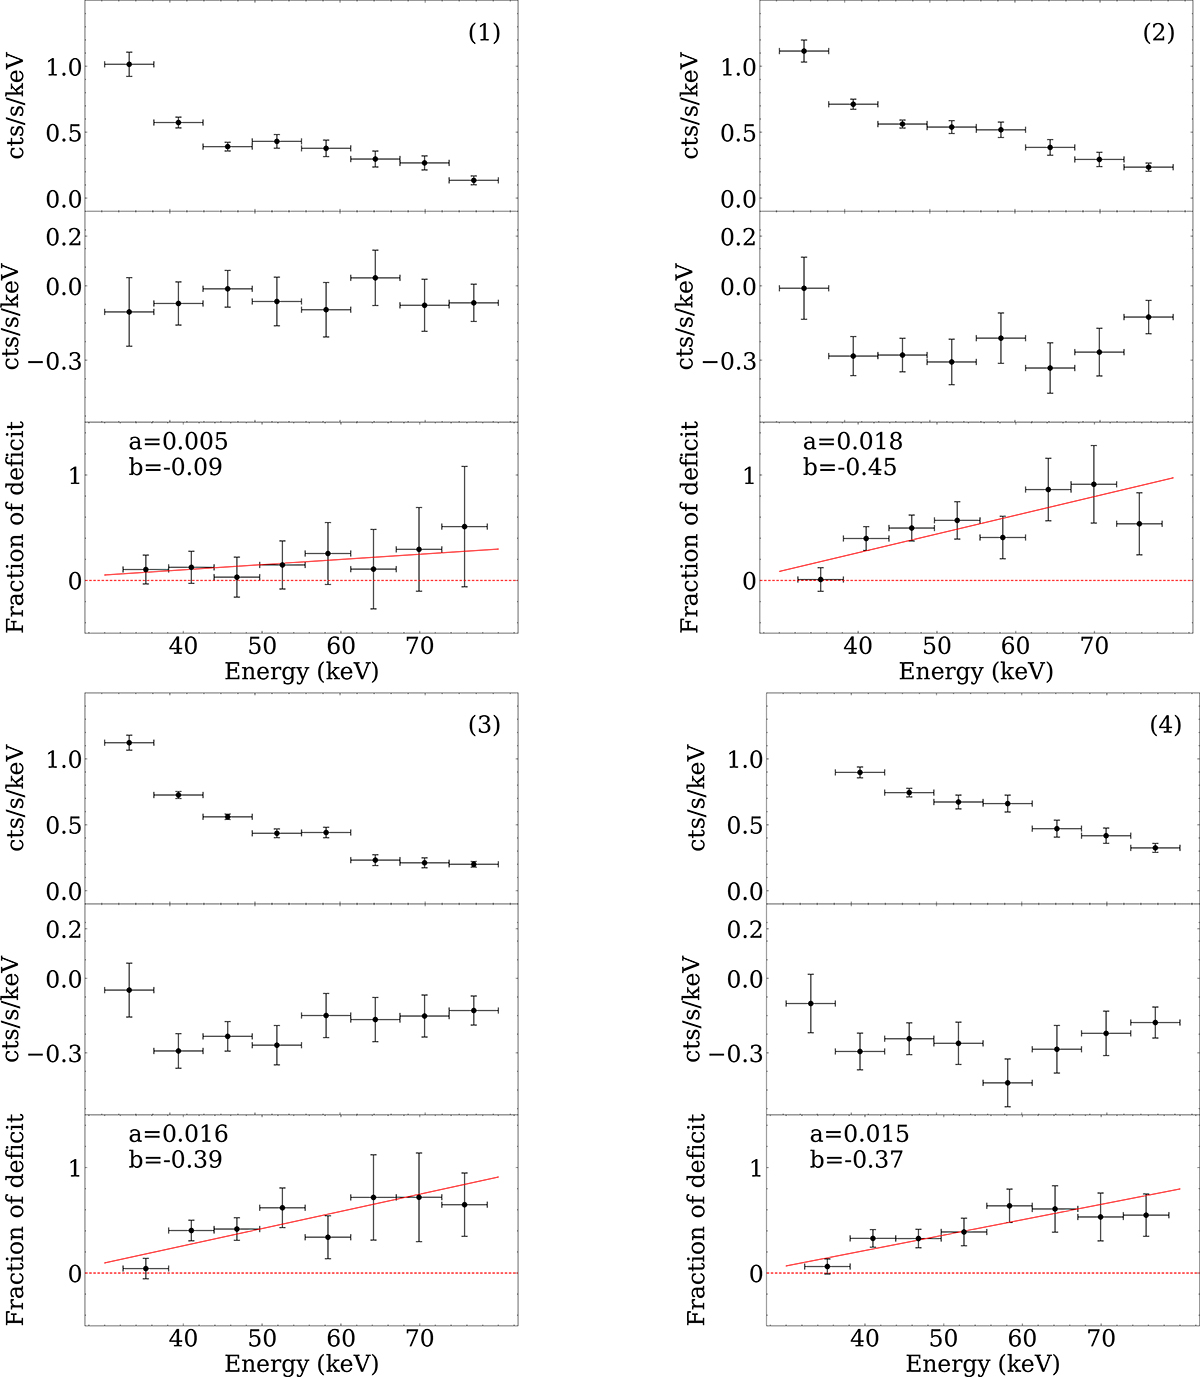
Fig. 8.
Download original image
Top panel: spectrum of persistent emission by HE. Middle panel: detected spectrum of the bursts. Bottom panel: fraction of deficit vs. energy during the bursts detected by HE. Panels 1, 2, 3, and 4 correspond to the stacking of the bursts in the four regions 1, 2, 3, and 4 of Fig. 2. The red solid line represents the relationship between the fraction of deficit and energy.
Current usage metrics show cumulative count of Article Views (full-text article views including HTML views, PDF and ePub downloads, according to the available data) and Abstracts Views on Vision4Press platform.
Data correspond to usage on the plateform after 2015. The current usage metrics is available 48-96 hours after online publication and is updated daily on week days.
Initial download of the metrics may take a while.