Fig. 1.
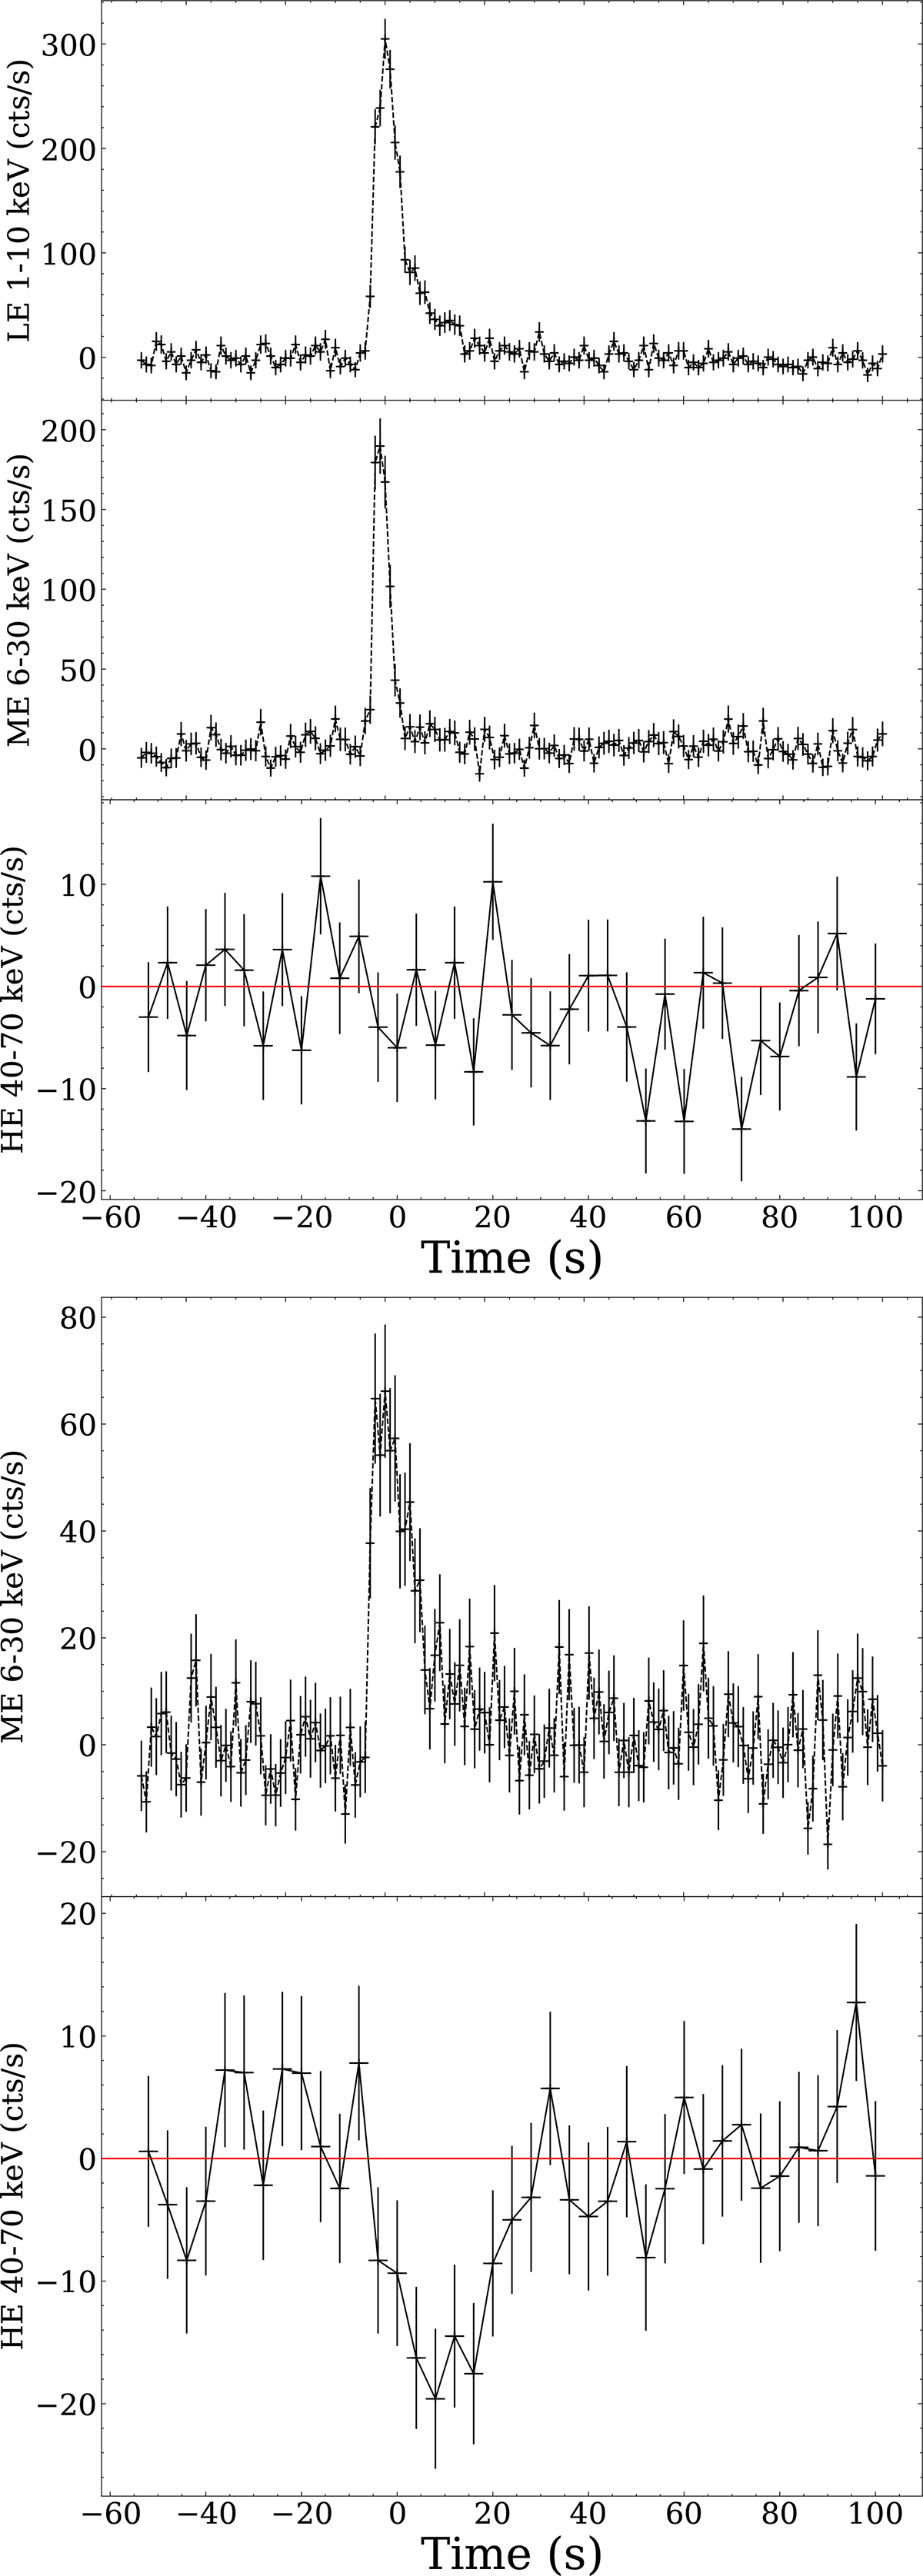
Download original image
Two examples of Insight-HXMT light curves The upper three panels show a burst in soft state; the lower two panels show a burst in hard state with the most significant hard X-ray shortage. The upper panels (from top to bottom) are the LE, ME, and HE light curves during the burst of 4U 1636–536 in 1–10 keV, 6–30 keV, and 40–70 keV, respectively. Time 0 s is the peak flux of the ME. For all bursts the mean value of the pre-burst emission (both persistent emission and instrumental background) is taken as the background, and it is subtracted from the light curves of LE, ME, and HE to obtain the net light curves.
Current usage metrics show cumulative count of Article Views (full-text article views including HTML views, PDF and ePub downloads, according to the available data) and Abstracts Views on Vision4Press platform.
Data correspond to usage on the plateform after 2015. The current usage metrics is available 48-96 hours after online publication and is updated daily on week days.
Initial download of the metrics may take a while.