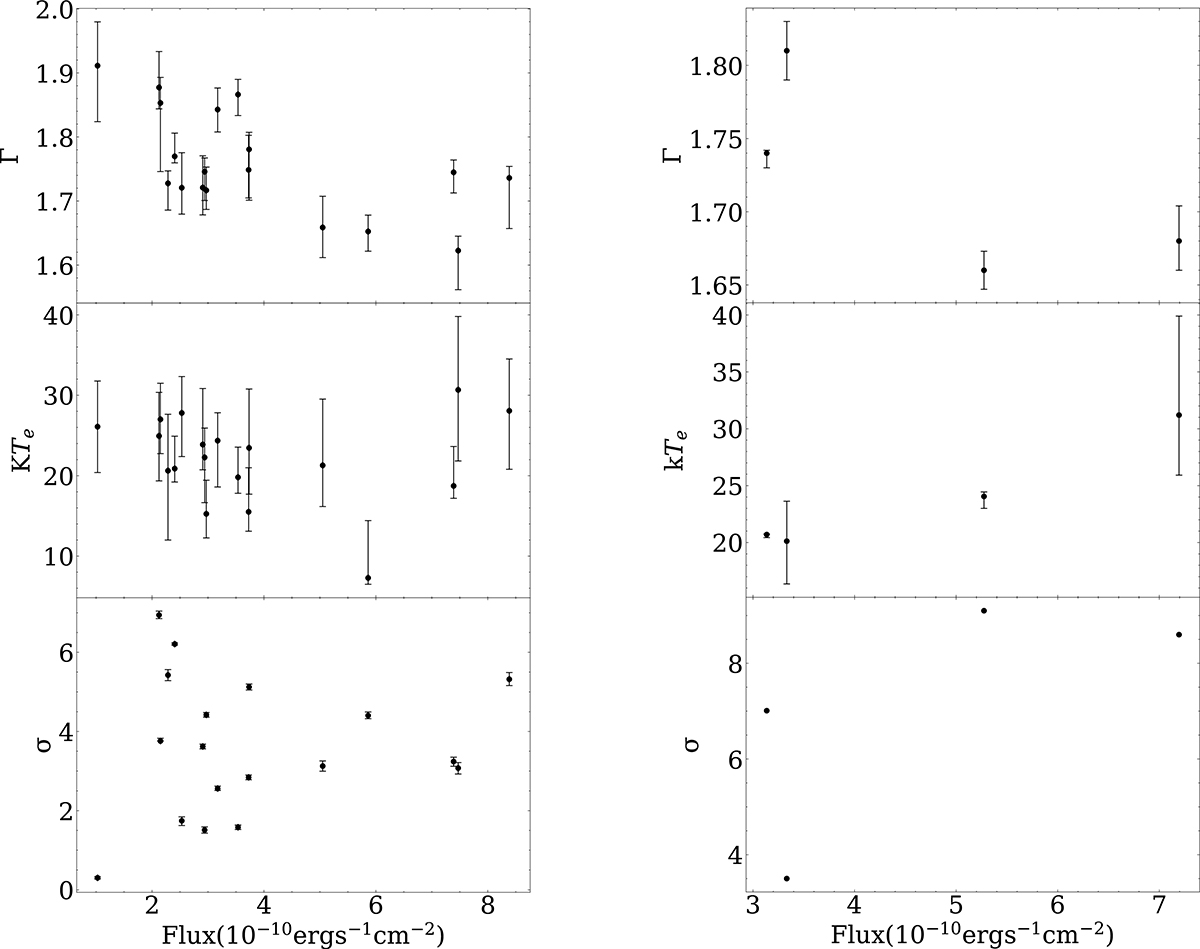
Fig. 5.
Download original image
Correlation of flux and persistent spectral parameters for 4U 1636–536. On the y-axis, σ is the significance of hard X-ray shortage, kTe the electron temperature, and Γ the photon index; on the x-axis Flux is the persistent emission flux of 40–70 keV. Left panel: points corresponding to the pre-burst continuum spectrum of the observation in which each burst of 4U 1636–536 is located. Right panel: bursts stacked in the hard state. The points (from left to right) correspond to the stacking of the bursts in the four regions 1, 2, 3, and 4 in Fig. 2. The spectral parameters are the result of the fit after combining the pre-burst continuum spectra of the observations where these bursts are located.
Current usage metrics show cumulative count of Article Views (full-text article views including HTML views, PDF and ePub downloads, according to the available data) and Abstracts Views on Vision4Press platform.
Data correspond to usage on the plateform after 2015. The current usage metrics is available 48-96 hours after online publication and is updated daily on week days.
Initial download of the metrics may take a while.