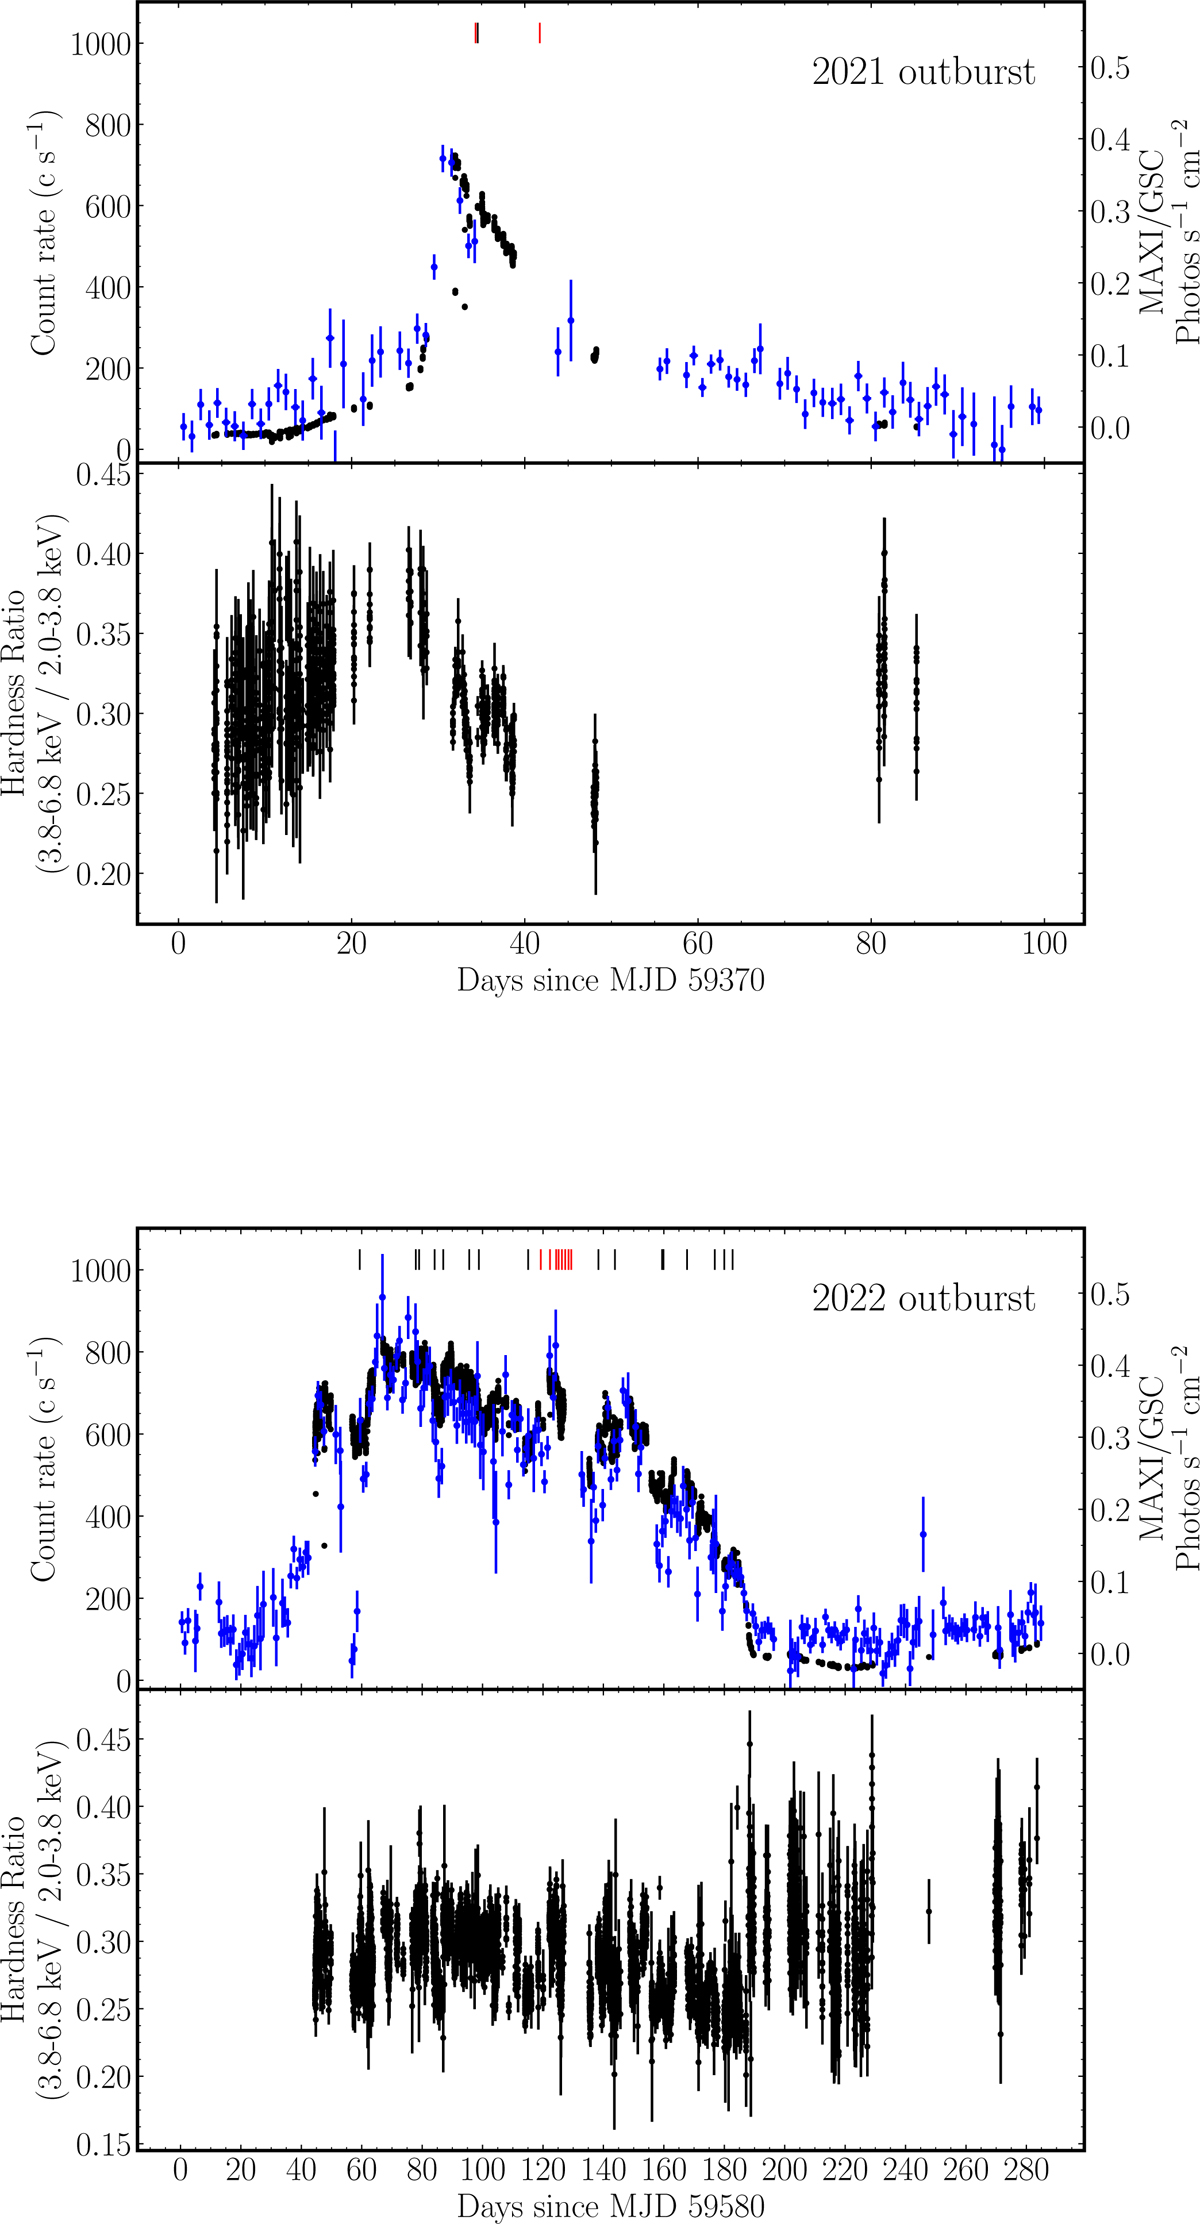
Fig. 1.
Download original image
Light curves and hardness ratio of 2021 (top panel) and 2022 (bottom panel) outbursts. In the top of each panel, we show the light curves in the 0.5–10 keV and 2.0–20.0 keV bands from NICER and MAXI observations, respectively. In the bottom, we show the NICER hardness ratio between 3.8–6.8 keV and 2.0–3.8 keV. Each black point means 64 s data of NICER and all bursts have been removed. The blue points represent the MAXI data. We marked the onset of all bursts observed by NICER and Insight-HXMT as black and red bars, respectively.
Current usage metrics show cumulative count of Article Views (full-text article views including HTML views, PDF and ePub downloads, according to the available data) and Abstracts Views on Vision4Press platform.
Data correspond to usage on the plateform after 2015. The current usage metrics is available 48-96 hours after online publication and is updated daily on week days.
Initial download of the metrics may take a while.