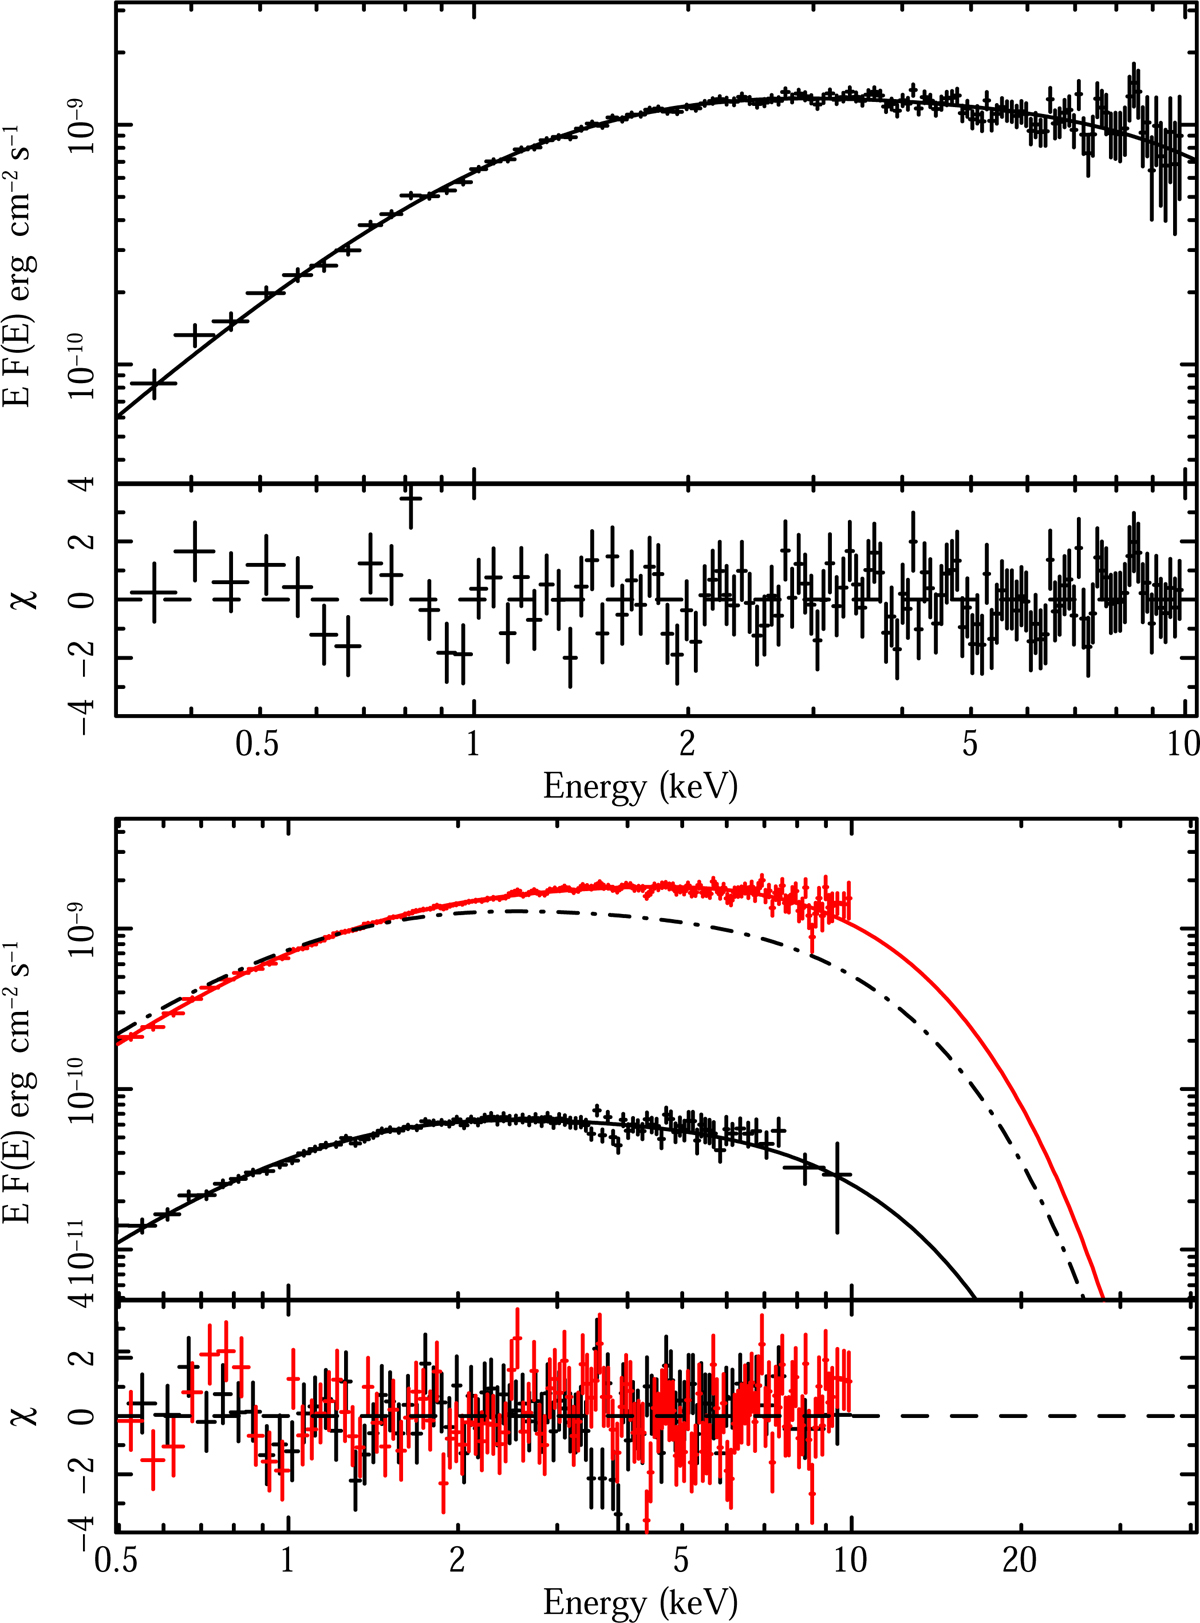
Fig. 4.
Download original image
Persistent spectra of 4U 1730–22. Top panel: preburst persistent spectrum in the energy range 0.3–10 keV and the best-fit models, Tbabs × nthcomp, for burst #5. Bottom panel: red points are the persistent spectrum produced from the observations on top right of HID with the exposure of 256 s, while the black points are from the bottom of HID with the exposure of 800 s. The solid lines are the best-fit models for each spectrum. The same models were used. The black dash-dotted line is the black solid model multiplied by 20. The residuals of the best-fit model to the data are plotted.
Current usage metrics show cumulative count of Article Views (full-text article views including HTML views, PDF and ePub downloads, according to the available data) and Abstracts Views on Vision4Press platform.
Data correspond to usage on the plateform after 2015. The current usage metrics is available 48-96 hours after online publication and is updated daily on week days.
Initial download of the metrics may take a while.