Fig. 5.
Download original image
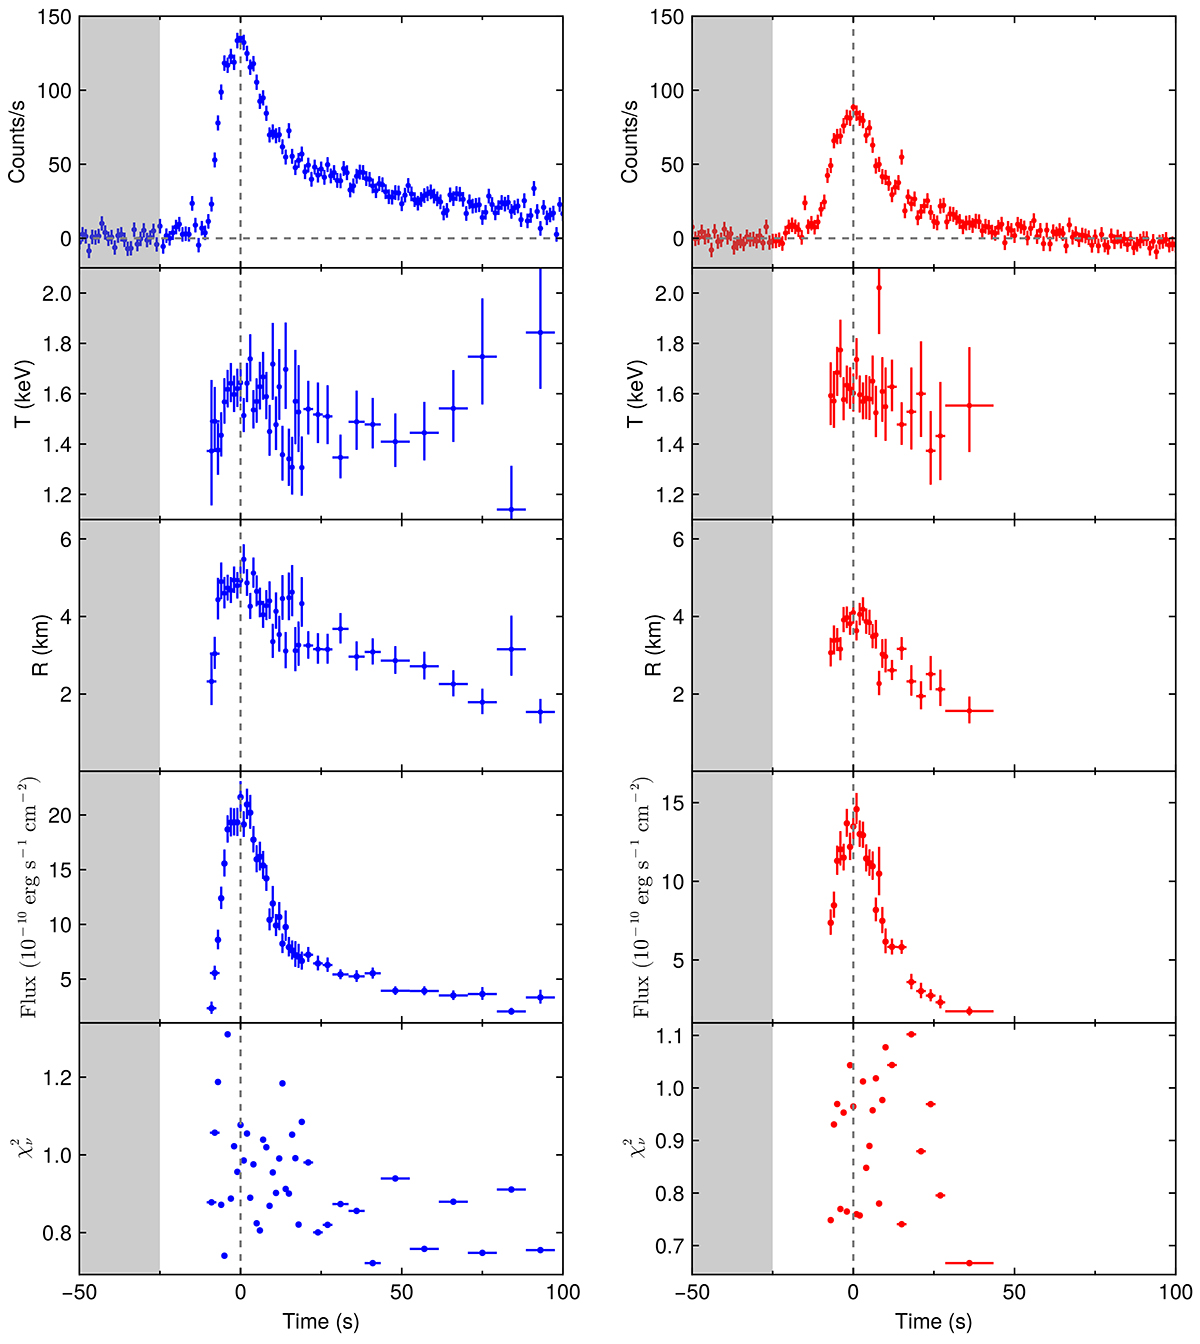
Results from the time-resolved spectroscopy. Class A and B are marked in blue and red, respectively. The background intervals adopted in the spectral fitting are marked in gray. Each panel shows the net count rate, the blackbody temperature, the blackbody radius, the blackbody flux, and the reduced chi-square from the top to the bottom.
Current usage metrics show cumulative count of Article Views (full-text article views including HTML views, PDF and ePub downloads, according to the available data) and Abstracts Views on Vision4Press platform.
Data correspond to usage on the plateform after 2015. The current usage metrics is available 48-96 hours after online publication and is updated daily on week days.
Initial download of the metrics may take a while.