Open Access
Fig. 8.
Download original image
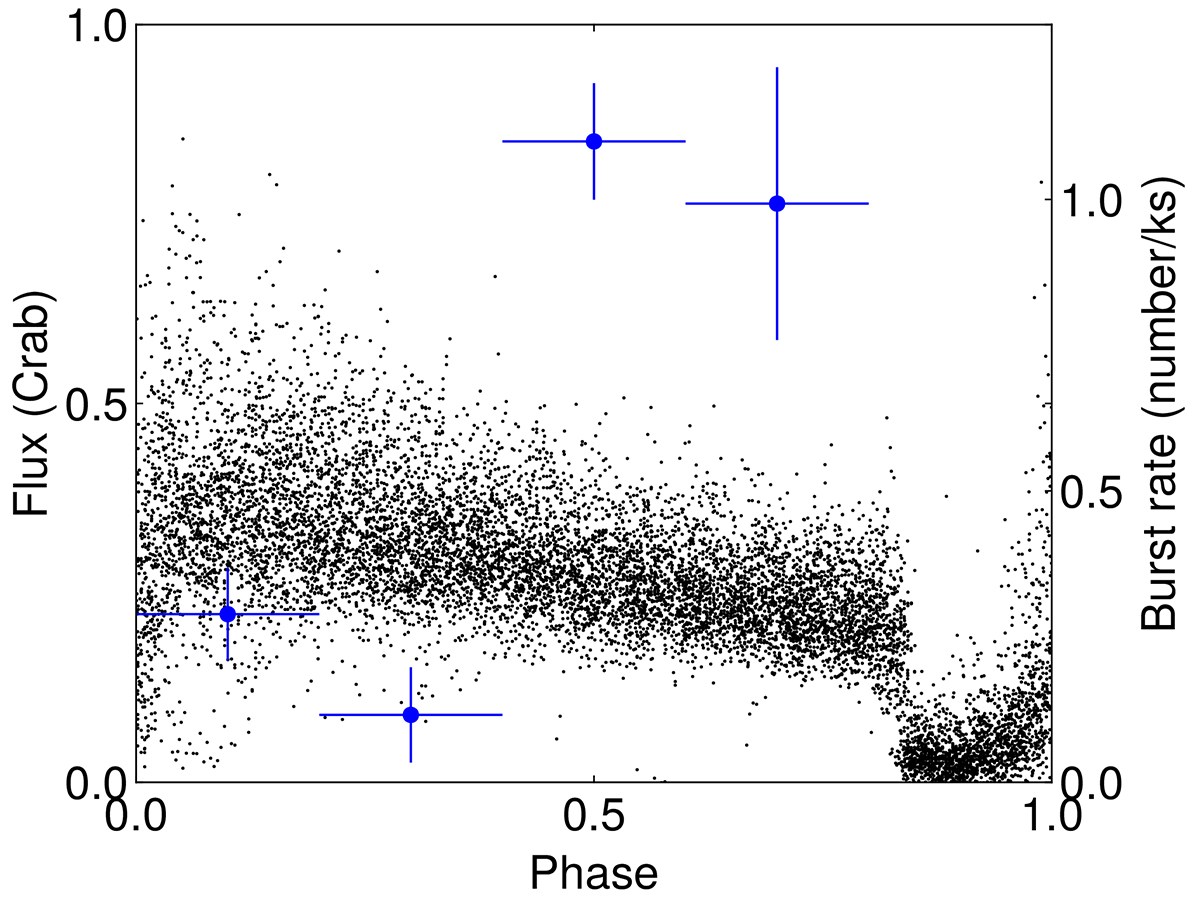
Blue points represent the burst rate with respect to orbital phase. Poisson errors are adopted here. The burst rates are derived from 155 X-ray bursts observed by NICER. The folded light curves obtained from the MAXI light curve from MJD 58933 to 60200, where orbital phases are derived from the Nicolson (2007)’s ephemeris.
Current usage metrics show cumulative count of Article Views (full-text article views including HTML views, PDF and ePub downloads, according to the available data) and Abstracts Views on Vision4Press platform.
Data correspond to usage on the plateform after 2015. The current usage metrics is available 48-96 hours after online publication and is updated daily on week days.
Initial download of the metrics may take a while.