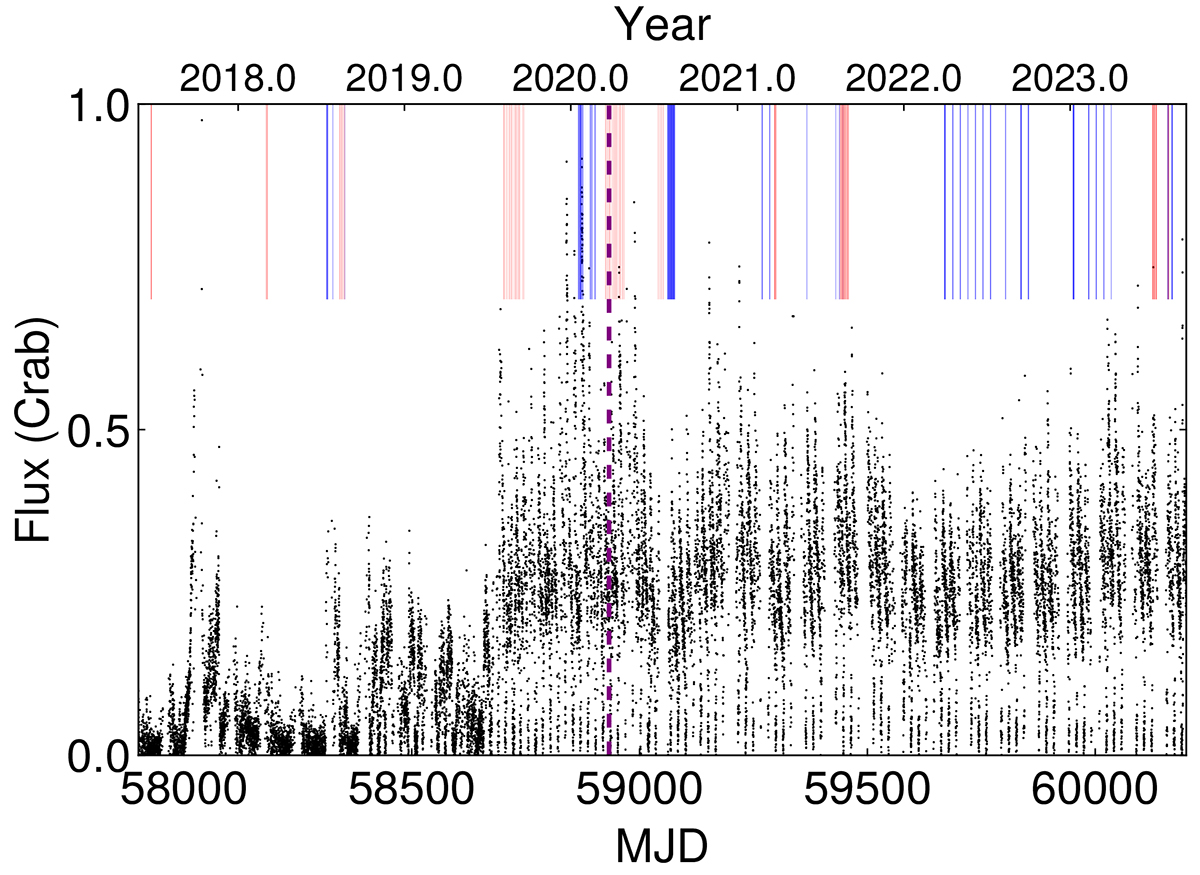
Fig. 1.
Download original image
Long-term light curves of Cir X-1 with MAXI from MJD 57900 to 60200. The vertical blue and red lines represent the observations with NICER and Insight-HXMT, respectively. The date of the vertical dashed purple line is MJD 58933. All found bursts in this work are posterior to this date. The low flux (∼0 Crab) observed in certain data points represents the dip in every orbit.
Current usage metrics show cumulative count of Article Views (full-text article views including HTML views, PDF and ePub downloads, according to the available data) and Abstracts Views on Vision4Press platform.
Data correspond to usage on the plateform after 2015. The current usage metrics is available 48-96 hours after online publication and is updated daily on week days.
Initial download of the metrics may take a while.