| Issue |
A&A
Volume 698, June 2025
|
|
|---|---|---|
| Article Number | L7 | |
| Number of page(s) | 5 | |
| Section | Letters to the Editor | |
| DOI | https://doi.org/10.1051/0004-6361/202555019 | |
| Published online | 28 May 2025 | |
Letter to the Editor
Tidal interaction can stop galactic bars: On the LMC non-rotating bar
Lund Observatory, Division of Astrophysics, Department of Physics, Lund University, Box 43 SE-22100 Lund, Sweden
⋆ Corresponding author.
Received:
3
April
2025
Accepted:
5
May
2025
Abstract
Context. The bar pattern speed of the LMC has been computed based on data from Gaia DR3 using three different methods. One method suggested that the LMC might be hosting a bar that barely rotates, and is slightly counter-rotating with respect to the disc of the LMC, with a pattern speed of Ωp = −1.0 ± 0.5 km s−1 kpc−1.
Aims. We aim to confirm that tidal interactions might prevent the bar hosted by the LMC from rotating as a result of its interaction with the SMC. This might cause the bar in the LMC to slow down significantly until it (momentarily) stops.
Methods. We analysed a subset of models (K9 and K21) from the KRATOS suite in which we detected non-rotating bars. We used two different methods to track the evolution of the bar pattern speed: the program patternSpeed.py and temporal finite-differences of the change in the rate in the major axis of the phase angle of the bar.
Results. In the second LMC–SMC-like pericenter passage of K9, the bar of the LMC-like galaxy weakens so much as to almost disappear and regenerates with a pattern speed that slows down from Ωp ∼ 20 km s−1 kpc−1 to Ωp ∼ 0 km s−1 kpc−1 in less than 75 Myr. Then, the bar rotates at less than Ωp ∼ 3 − 5 km s−1 kpc−1 for about 100 Myr, until it recovers the initial (before the interaction) pattern speed of Ωp ∼ 10 km s−1 kpc−1. The results for the K21 simulation are similar.
Conclusions. We show that galactic bars can be slowed down or even stopped by tidal interaction. This strengthens the hypothesis that the LMC hosts a non-rotating bar, and it can be an alternative formation scenario for other observed slowly rotating bars.
Key words: Galaxy: kinematics and dynamics / galaxies: interactions / Magellanic Clouds
© The Authors 2025
 Open Access article, published by EDP Sciences, under the terms of the Creative Commons Attribution License (https://creativecommons.org/licenses/by/4.0), which permits unrestricted use, distribution, and reproduction in any medium, provided the original work is properly cited.
This article is published in open access under the Subscribe to Open model. This email address is being protected from spambots. You need JavaScript enabled to view it. to support open access publication.
1. Introduction
Galactic bars are ubiquitous. About two-thirds of spiral galaxies in the local Universe host them (e.g. Erwin 2018). Because bars can serve as sources and sinks of angular momentum and redistribute stars, gas, and dark matter within galaxies, they are thought to be key drivers of secular evolution (e.g. Sellwood 2014). Galactic bars rotate almost rigidly, the rotation is parametrised by their angular frequency (or pattern speed), and they are formed through global disc instabilities. In isolation, this instability can be produced by the transfer of angular momentum from the bar to the dark matter halo (e.g. Sellwood 1980, 2014). Simulations showed that the bar pattern speed gradually decreases over time as a result of dynamical friction (e.g. Sellwood 1980) or through the trapping of disc stars onto elongated orbits (e.g. Athanassoula 2003).
Simulations have also shown that the tidal interaction of a disc galaxy with a massive companion is another way of boosting global disc instabilities and, consequently, of the formation of galactic bars (e.g. Gerin et al. 1990). In the interaction, the evolution of the barred galaxy is then controlled by the subsequent pericenter passages, and the effects depend on the orientation of the bar with respect to the tidal torque from the host at the pericenter. Some studies have shown that bars can be both delayed or destroyed (and later regenerated) by the interaction between galaxies (e.g. Lang et al. 2014; Jiménez-Arranz et al. 2024b; Zheng & Shen 2025; Zheng et al. 2025). In a recent paper, we also showed that the tidal torque can speed the bar up or slow it down, changing its pattern speed and strength (Jiménez-Arranz et al. 2024b).
From an observational point of view, the analysis of the LMC, which is the barred galaxy closest to the Milky Way (MW), allows for detailed studies with unprecedentedly high resolution, which provide key insights into the formation and evolution of barred galaxies in general (e.g. Gaia Collaboration 2021; Jiménez-Arranz et al. 2023; Kacharov et al. 2024; Jiménez-Arranz et al. 2025). The LMC bar is quite peculiar because it is off-centred and tilted with respect to the plane of the LMC (e.g. Choi et al. 2018; Jiménez-Arranz et al. 2025). Simulations suggested that this rare setup may be produced by the recent interaction with one of its satellite galaxies, the SMC (e.g. Besla et al. 2012; Jiménez-Arranz et al. 2024b), which occurred about 150–200 Myr ago (e.g. Diaz & Bekki 2012).
Recently, Jiménez-Arranz et al. (2024a) determined the pattern speed of the LMC using data from Gaia DR3. Surprisingly, one of the methods they employed suggested that the LMC might be hosting a bar that rotates barely and even counter-rotates slightly with respect to the disc of the LMC with a pattern speed of Ωp = −1.0 ± 0.5 km s−1 kpc−1.
Our goal in this work is to evaluate whether the tidal interaction between the LMC and SMC might cause the LMC bar to abruptly slow down until it (momentarily) stops. We test this scenario with suitable numerical simulations, such as the KRATOS suite of simulations (Jiménez-Arranz et al. 2024b) of LMC-SMC-MW-like galaxies.
2. KRATOS simulations
We analysed the K9 simulation of the KRATOS suite (Jiménez-Arranz et al. 2024b). KRATOS consists of a suite of 28 pure N-body simulations that model the evolution of an LMC-like galaxy with varying parameters. The suite includes models in which the LMC-like galaxy is in isolation, in interaction with an SMC-mass galaxy, or in interaction with both an SMC-mass galaxy and an MW-mass galaxy. We used the notation presented by Jiménez-Arranz et al. (2024b), where the LMC-like galaxy is denoted as GLMC and the SMC- and MW-mass systems as GSMC and GMW, respectively. K9 is one of the KRATOS suite simulations that includes all three galaxies (GLMC, GSMC, and GMW).
Originally, every KRATOS simulation consisted of 61 snapshots (δt ∼ 78 Myr). Some models, however, were re-run to save snapshots with a higher temporal cadence, which increased the number of snapshots per simulation to 2003 (δt ∼ 2 Myr)1. We employed the high-cadence version of the K9 simulation. The high temporal cadence enabled us to have a detailed evolution of the GLMC bar pattern speed and to determine the bar pattern speed with finite differences with a high precision (see Sect. 3). Additionally, the snapshot cadence is sufficiently high to examine the dynamics of the bar structure. The Nyquist theorem (Shannon 1949) guarantees that we can track and recover frequencies up to 0.245 km s−1 kpc−1.
Our study focused on the second GLMC − GSMC pericenter passage, which occurred at t = −0.136 Gyr and had an impact parameter of 1.68 kpc; that is, the GSMC crossed the GLMC disc. The GMW was at least ≳150 kpc from the GLMC − GSMC system during the simulation time we analysed. Therefore, its impact on the internal kinematics of the GLMC, and specifically, its bar pattern speed, is minimal.
3. Measurement of the bar pattern speed
To examine the bar features of the GLMC disc, we used the same centring and alignment process as Jiménez-Arranz et al. (2024b). Then, we used two different methods to track the evolution of the bar pattern speed, and our analysis and results are therefore robust. First, we used the program patternSpeed.py (Dehnen et al. 2023). This method is an unbiased, precise, and consistent method that simultaneously measures the bar pattern speed Ωp and the orientation angle ϕb of the bar from single snapshots of simulated barred galaxies. These parameters are found assuming that 1) the continuity equation applies; 2) the centre of rotation is known; 3) the rotation is around the z′-axis, and 4) that the density is stationary in the rotating frame. The pattern speed of bars has already been estimated using this method extensively in simulations (e.g. Bland-Hawthorn et al. 2023; Jiménez-Arranz et al. 2024b; Semczuk et al. 2024) and 6D data of real galaxies (Jiménez-Arranz et al. 2024a; Zhang et al. 2024).
The program patternSpeed.py determines the pattern speed in the bar region. The method allows us to either automatically find the bar region by searching for the large amplitude of the second-order bisymmetric density perturbation and a roughly constant phase angle (for details, see the Appendix B of Dehnen et al. 2023) or that the user inputs the bar region directly. We chose the second option and fixed the bar region to be [R0, R1]=[0.2, 1.0] kpc throughout the entire time evolution. Because the pattern speed was taken to be constant throughout the entire bar, we are confident that through this cautious selection of the bar length R1, we obtained reliable and comparable results between snapshots. On the other hand, an overestimation of the bar length R1 would imply contamination by different pattern speeds, such as the spiral arms. This might bias our results.
Second, taking advantage of the high temporal cadence of the re-run KRATOS suite of simulations (δt ∼ 2 Myr), we were also able to compute the bar pattern speed by means of the finite differences of the change rate in the major axis phase angle ϕb of the bar. We averaged the rate in the change of the phase angle of the major axis ϕb of the bar in three consecutive snapshots over the radial range of the bar to determine the bar pattern speed. For this method and throughout the entire time evolution, we also defined the same bar region as for the program patternSpeed.py, which is [R0, R1]=[0.2, 1.0] kpc.
4. Results
We start by analysing the pattern speed of the GLMC bar using a qualitative visual approach. Figure 1 shows the evolution of the stellar density structures in the GLMC disc2 in a period of 220 Myr in a face-on view of the disc. This figure shows snapshots that are close to the second pericenter passage between the GLMC and GSMC, which occurred shortly before the image shown in the first panel, at t = −0.136 Gyr in simulation units. All the panels are shown in the simulated box reference frame, which is by construction inertial (no bulk velocity or rotation). Although most structures evolve and rotate around the centre, the major axis of the bar remains aligned with the x′-axis for about 100 Myr (third to sixth panel), which is just after the pericenter of the GSMC. Before and after this event (first and last panels), the bar also rotates around the centre like all other structures.
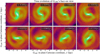 |
Fig. 1. Time evolution of the stellar density map of the GLMC disc seen face-on. The panels have a constant time difference of 31 Myr, and the total time evolution is 220 Myr (from t = −0.10 Gyr to t = 0.12 Gyr). All maps are shown in the GLMC in-plane (x′,y′) Cartesian coordinate system. A video version of this figure is available online. |
The former qualitative evaluation requires a quantification using the analysis techniques introduced in Sect. 3. Figure 2 shows the time evolution of the relative m = 2 Fourier amplitude A2/A0 (top panel) and the bar pattern speed Ωp (bottom panel) in the bar region of the GLMC, which is defined by [R0, R1]=[0.2, 1.0] kpc (see Sect. 3). In the bottom panel, we only show the bar pattern speed Ωp when the GLMC disc has a bar (A2/A0 > 0.2). We note that both methods provide consistent bar pattern speeds. The time interval shown in Fig. 2 is longer than that in Fig. 1 (horizontal red line) for context of what is shown in the latter.
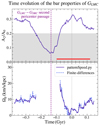 |
Fig. 2. Top: time evolution of the relative m = 2 Fourier amplitude A2/A0 in the bar region of the GLMC, which is defined by [R0, R1]=[0.2, 1.0] kpc. Bottom: Bar pattern speed Ωp determined by the program patternSpeed.py (solid blue) and by means of finite differences (dashed blue). The grey area in top panel corresponds to A2/A0 < 0.2, which is the threshold we used to consider whether the GLMC disc has a bar. The horizontal red line corresponds to the time interval shown in Fig. 1 (from t = −0.10 Gyr to t = 0.12 Gyr). In the bottom panel, we only show the bar pattern speed Ωp when the GLMC disc has a bar (A2/A0 > 0.2). The vertical dashed purple line corresponds to the GLMC − GSMC pericenter. |
Figure 2 shows that before the GLMC − GSMC interaction, the GLMC has a bar with a strength A2/A0 ∼ 0.3 and a pattern speed Ωp ∼ 10 km s−1 kpc−1. Then, the GLMC looses the bar about 100 Myr before the GLMC − GSMC second pericenter passage, and it recovers the bar about 50 Myr after the interaction. The new GLMC bar grows into a similar strength as before (A2/A0 ∼ 0.25 − 0.3). However, its pattern speed slows down from Ωp ∼ 20 km s−1 kpc−1 to Ωp ∼ 0 km s−1 kpc−1 in less than 75 Myr. Then, the GLMC bar rotates at less than Ωp ∼ 3 − 5 km s−1 kpc−1 for about 100 Myr, until it recovers the initial pattern speed of Ωp ∼ 10 km s−1 kpc−1. Remarkably, the non-rotating bar appears near t = 0 (dashed vertical grey line), which would be consistent with the observations (Jiménez-Arranz et al. 2024a).
5. Discussion
Using Gaia DR3 data, Jiménez-Arranz et al. (2024b) used three distinct methods to determine the LMC bar pattern speed. This study worked with a dataset of ∼12 million LMC stars with full astrometric information, which was cleaned for MW foreground contamination (Jiménez-Arranz et al. 2023). Of these, ∼30 000 stars had also line-of-sight velocity information. The quality and richness of the Gaia data allowed for the evaluation of the pattern speed of the LMC bar using the Tremaine–Weinberg (TW, Tremaine & Weinberg 1984) method, a bisymmetric velocity (BV, Gaia Collaboration 2023) model, and the program patternSpeed.py (referred as the “Dehnen method”, Dehnen et al. 2023). Significant frame orientation variation limited the ability of the TW method to constrain a global pattern speed of the LMC bar, whereas the BV method recovered  km s−1 kpc−1.
Surprisingly, the third method suggested that the LMC might be hosting a bar that barely rotates, and is slightly counter-rotating with respect to the disc of the LMC, with a pattern speed of Ωp = −1.0 ± 0.5 km s−1 kpc−1. The viability of this result was discussed by Jiménez-Arranz et al. (2024a). Examples of situations in which the result for the LMC non-rotating bar might be biased and non-physical are 1) a possible strong and counter-rotating m = 1 disc component, which could balance the bar pattern speed and would not be taken into account by the method, and 2) the method may be sensitive to dust extinction and completeness effects in the inner LMC region, perhaps more strongly than the other methods. The authors also suggested, however, that the pattern speed recovered by patternSpeed.py might be the real pattern speed of the LMC bar and that the bar deceleration and slight counter-rotation might be the result of its interaction with the SMC and/or the MW. This paper is one of the natural follow-up projects of Jiménez-Arranz et al. (2024a).
The subject of galaxies with bars with a nearly zero pattern speed has been covered in only a few articles. Some numerical simulations contained bars with this odd property, but only for extremely particular and challenging configurations. For example, Collier & Madigan (2023) ran a numerical experiment of an N-body galaxy embedded in a counter-rotating (retrograde) live dark matter halo that acted as a reservoir of negative angular momentum. A bar embedded in a counter-rotating dark matter halo can decelerate, then flip its pattern speed, and finally, decouple its rotation from the disc. This Letter provides an alternative formation scenario for the observed slowly rotating (e.g. Chemin & Hernandez 2009; Buttitta et al. 2022) or even non-rotating bars (e.g. Jiménez-Arranz et al. 2024a), that is, a tidal interaction with a companion galaxy (in agreement to what hinted by Łokas et al. 2014; Gajda et al. 2017, 2018).
We focused on the K9 simulation of the KRATOS suite. However, this is not the only GLMC − GSMC interacting simulation inside the suite in which we can observe slow or almost stopped bars (see Fig. 10 of Jiménez-Arranz et al. 2024b). For instance, in the K21 simulation, the GLMC bar also stops to be nearly non-rotating (see Appendix A). It differs from K9 in terms of the baryonic and total mass of GLMC and its Toomre Q parameter, owing to a less massive and more stable GLMC. We highlight that the orbits in K21 differ from those in K9 due to the change in total mass, which affects their direct comparability to current orbit estimates. However, this difference provides a valuable opportunity to explore the impact of mass variations on orbital dynamics, which makes it a worthwhile subject of investigation (for the details of K21 we refer to Jiménez-Arranz et al. 2024b).
That there are multiple models with stopped bars suggests that this process is not just a unique case in a specific simulation of a particular galaxy. Instead, it may represent a more general phenomenon in the Universe, highlighting the need for further research to understand its broader implications. Attempts have been made to identify and characterize the factors that cause the GLMC bar to stop. Although some efforts have been made to determine the radial migration (Hebrail, in prep.), tidal torque maps, and the phase space, the primary causes of the extreme bar slowdown remain unknown and elusive.
Overall, we provided direct evidence that tidal interaction can stop galactic bars. More specifically, we provided support for the idea that the LMC may be hosting a non-rotating bar that was produced by the most recent interaction with the SMC, which occurred ∼150–200 Myr ago (e.g. Diaz & Bekki 2012). However, a more thorough project is needed to provide a detailed characterization and theoretical framework for this phenomenon, which is beyond the scope of this work.
6. Conclusions
We analysed the K9 (and K21; see Appendix A) simulation of the KRATOS suite (Jiménez-Arranz et al. 2024b) to assess whether the LMC might host a non-rotating bar (Jiménez-Arranz et al. 2024a) as a result of its interaction with the SMC. Our study focused on the most recent interaction of the LMC with the SMC, which occurred about 150–200 Myr ago (e.g. Diaz & Bekki 2012).
In K9, the GLMC bar weakens so much as to almost disappear through the interaction with the GSMC and then recombines to form a new bar. After the interaction, the pattern speed of this newly formed bar slows down from Ωp ∼ 20 km s−1 kpc−1 to Ωp ∼ 0 km s−1 kpc−1 in less than 75 Myr. Then, the GLMC bar rotates at less than Ωp ∼ 3 − 5 km s−1 kpc−1 for about 100 Myr, until it recovers the initial pattern speed of Ωp ∼ 10 km s−1 kpc−1.
While previous studies (e.g. Łokas et al. 2014; Gajda et al. 2017, 2018) have hinted at the possibility, to the best of our knowledge, this work provides the first direct evidence that galactic bars can be stopped by tidal interactions. This result strengthens the hypothesis that the LMC might host a non-rotating bar (Jiménez-Arranz et al. 2024a), and it adds an alternative formation scenario for the observed slow-rotating bars (e.g. Fragkoudi et al. 2021). Notably, the non-rotating bar in K9 appears ∼150 Myr after the last GLMC − GSMC interaction, which would be consistent with the estimates of the last LMC–SMC interaction (150–200 Myr ago, e.g. Diaz & Bekki 2012).
Finally, we would like to emphasize that the purpose of this work was to report that tidal interactions can stop rotating galactic bars. We did not aim to provide a detailed characterisation of or theoretical frame for this phenomenon, which is left for a more detailed project3.
Data availability
Movies associated to Figs. 1 and A.1 are available at https://www.aanda.org
With 61 snapshots per simulation, the original KRATOS suite is open-data and available online. On reasonable request, the high temporal cadence version (2003 snapshots) of the KRATOS suite can be provided.
A video of the time evolution of the stellar density map of the GLMC disc is made available online at https://www.oscarjimenezarranz.com/visualizations/tidal-interaction-can-stop-galactic-bars
If other research groups are interested in carrying on with this work, we emphasize that the simulation(s) we used are available upon request.
Acknowledgments
We thank the anonymous referee for a critical review and constructive suggestions that helped improving the manuscript. OJA acknowledges funding from “Swedish National Space Agency 2023-00154 David Hobbs The GaiaNIR Mission” and “Swedish National Space Agency 2023-00137 David Hobbs The Extended Gaia Mission”. SRF acknowledge financial support from the Spanish Ministry of Science and Innovation through the research grant PID2021-123417OB-I00, funded by MCIN/AEI/10.13039/501100011033/FEDER, EU.
References
- Athanassoula, E. 2003, MNRAS, 341, 1179 [Google Scholar]
- Besla, G., Kallivayalil, N., Hernquist, L., et al. 2012, MNRAS, 421, 2109 [Google Scholar]
- Bland-Hawthorn, J., Tepper-Garcia, T., Agertz, O., & Freeman, K. 2023, ApJ, 947, 80 [NASA ADS] [CrossRef] [Google Scholar]
- Buttitta, C., Corsini, E. M., Cuomo, V., et al. 2022, A&A, 664, L10 [NASA ADS] [CrossRef] [EDP Sciences] [Google Scholar]
- Chemin, L., & Hernandez, O. 2009, A&A, 499, L25 [NASA ADS] [CrossRef] [EDP Sciences] [Google Scholar]
- Choi, Y., Nidever, D. L., Olsen, K., et al. 2018, ApJ, 866, 90 [Google Scholar]
- Collier, A., & Madigan, A. M. 2023, ArXiv e-prints [arXiv:2305.06383] [Google Scholar]
- Dehnen, W., Semczuk, M., & Schönrich, R. 2023, MNRAS, 518, 2712 [Google Scholar]
- Diaz, J. D., & Bekki, K. 2012, ApJ, 750, 36 [Google Scholar]
- Erwin, P. 2018, MNRAS, 474, 5372 [Google Scholar]
- Fragkoudi, F., Grand, R. J. J., Pakmor, R., et al. 2021, A&A, 650, L16 [NASA ADS] [CrossRef] [EDP Sciences] [Google Scholar]
- Gaia Collaboration (Luri, X., et al.) 2021, A&A, 649, A7 [EDP Sciences] [Google Scholar]
- Gaia Collaboration (Drimmel, R., et al.) 2023, A&A, 674, A37 [CrossRef] [EDP Sciences] [Google Scholar]
- Gajda, G., Łokas, E. L., & Athanassoula, E. 2017, ApJ, 842, 56 [Google Scholar]
- Gajda, G., Łokas, E. L., & Athanassoula, E. 2018, ApJ, 868, 100 [NASA ADS] [CrossRef] [Google Scholar]
- Gerin, M., Combes, F., & Athanassoula, E. 1990, A&A, 230, 37 [NASA ADS] [Google Scholar]
- Jiménez-Arranz, Ó., Romero-Gómez, M., Luri, X., et al. 2023, A&A, 669, A91 [NASA ADS] [CrossRef] [EDP Sciences] [Google Scholar]
- Jiménez-Arranz, Ó., Chemin, L., Romero-Gómez, M., et al. 2024a, A&A, 683, A102 [NASA ADS] [CrossRef] [EDP Sciences] [Google Scholar]
- Jiménez-Arranz, Ó., Roca-Fàbrega, S., Romero-Gómez, M., et al. 2024b, A&A, 688, A51 [NASA ADS] [CrossRef] [EDP Sciences] [Google Scholar]
- Jiménez-Arranz, Ó., Horta, D., van der Marel, R. P., et al. 2025, A&A, in press, https://doi.org/10.1051/0004-6361/202553705 [Google Scholar]
- Kacharov, N., Tahmasebzadeh, B., Cioni, M.-R. L., et al. 2024, A&A, 692, A40 [NASA ADS] [CrossRef] [EDP Sciences] [Google Scholar]
- Lang, M., Holley-Bockelmann, K., & Sinha, M. 2014, ApJ, 790, L33 [Google Scholar]
- Łokas, E. L., Athanassoula, E., Debattista, V. P., et al. 2014, MNRAS, 445, 1339 [Google Scholar]
- Sellwood, J. A. 1980, A&A, 89, 296 [NASA ADS] [Google Scholar]
- Sellwood, J. A. 2014, Rev. Mod. Phys., 86, 1 [Google Scholar]
- Semczuk, M., Dehnen, W., Schönrich, R., & Athanassoula, E. 2024, A&A, 692, A159 [NASA ADS] [CrossRef] [EDP Sciences] [Google Scholar]
- Shannon, C. E. 1949, IEEE Proceedings, 37, 10 [Google Scholar]
- Tremaine, S., & Weinberg, M. D. 1984, ApJ, 282, L5 [Google Scholar]
- Zhang, H., Belokurov, V., Evans, N. W., et al. 2024, MNRAS, 535, 2873 [Google Scholar]
- Zheng, Y., & Shen, J. 2025, ApJ, 979, 60 [Google Scholar]
- Zheng, Y., Shen, J., Wu, X., & Chen, B. H. 2025, ApJ, accepted [arXiv:2503.10014] [Google Scholar]
Appendix A: K21 simulation
The results of the evolution of the K21’s bar pattern speed over time are displayed in this Appendix. Figure A.1 shows the evolution of the GLMC disc’s stellar density structures in a period of 350 Myr, in a face-on view (see Sect. 3 for the definition of the disc plane). In this Figure, we show snapshots that are after the first pericenter passage between the GLMC and GSMC – notice that the orbits in K21 differ from those in K9 due to the change in total mass – which occurs at t = −0.303 Gyr, and far away from the GLMC disc, at a minimum distance of d = 12.9 kpc. The arrangement of Fig. A.1 is the same to that of Fig. 1. All the panels are shown from the simulated box reference frame, which is by construction inertial (no bulk velocity or rotation). This illustrates how, for roughly 170 Myr, the bar major-axis stays nearly aligned with the x′-axis, despite the fact that most structures change and revolve around the center (third to seventh panel). Like all other structures, the bar rotates around the center before and after this event (the two first and last panels).
Figure A.2 shows the time evolution of the relative m = 2 Fourier amplitude A2/A0 (top panel) and the bar pattern speed Ωp (bottom panel) in the K21 GLMC’s bar region – defined by [R0, R1]=[0.2, 1.0] kpc (see Sect. 3). Fig. A.2 follows the same layout as Fig. 2. We can observe that prior t = 0, there is a weak bar (A2/A0 ≳ 0.2) with a roughly constant pattern speed around Ωp ∼ 15 km s−1 kpc−1. The bar then becomes weaker and reconvenes at t = 0.05 Gyr, experiencing a severe slowdown in pattern speed to Ωp ∼ 0 km s−1 kpc−1, and for a while even to negative values. After reaching Ωp ∼ 5 km s−1 kpc−1, it subsequently slows down to negative bar pattern speed values, peaking at A2/A0 ∼ 0.4 for bar strength. Finally, the bar recovers a pattern speed of Ωp ∼ 5 km s−1 kpc−1.
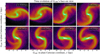 |
Fig. A.1. Same as Fig. 1 but for the K21 simulation. The panels have a constant time difference of 50 Myr, and the total time evolution is 350 Myr (from t = −0.02 Gyr to t = 0.33 Gyr). A video version of this figure is available online. |
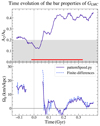 |
Fig. A.2. Same as Fig. 2 but for the K21 simulation. In the top panel, the horizontal red line corresponds to the time interval shown in Fig. A.1 (from t = −0.02 Gyr to t = 0.3 Gyr). Outside of the displayed temporal range, at t = −0.303 Gyr, the first (and previous) pericenter passage between the GLMC and GSMC takes place. |
All Figures
|
Fig. 1. Time evolution of the stellar density map of the GLMC disc seen face-on. The panels have a constant time difference of 31 Myr, and the total time evolution is 220 Myr (from t = −0.10 Gyr to t = 0.12 Gyr). All maps are shown in the GLMC in-plane (x′,y′) Cartesian coordinate system. A video version of this figure is available online. |
| In the text | |
|
Fig. 2. Top: time evolution of the relative m = 2 Fourier amplitude A2/A0 in the bar region of the GLMC, which is defined by [R0, R1]=[0.2, 1.0] kpc. Bottom: Bar pattern speed Ωp determined by the program patternSpeed.py (solid blue) and by means of finite differences (dashed blue). The grey area in top panel corresponds to A2/A0 < 0.2, which is the threshold we used to consider whether the GLMC disc has a bar. The horizontal red line corresponds to the time interval shown in Fig. 1 (from t = −0.10 Gyr to t = 0.12 Gyr). In the bottom panel, we only show the bar pattern speed Ωp when the GLMC disc has a bar (A2/A0 > 0.2). The vertical dashed purple line corresponds to the GLMC − GSMC pericenter. |
| In the text | |
|
Fig. A.1. Same as Fig. 1 but for the K21 simulation. The panels have a constant time difference of 50 Myr, and the total time evolution is 350 Myr (from t = −0.02 Gyr to t = 0.33 Gyr). A video version of this figure is available online. |
| In the text | |
|
Fig. A.2. Same as Fig. 2 but for the K21 simulation. In the top panel, the horizontal red line corresponds to the time interval shown in Fig. A.1 (from t = −0.02 Gyr to t = 0.3 Gyr). Outside of the displayed temporal range, at t = −0.303 Gyr, the first (and previous) pericenter passage between the GLMC and GSMC takes place. |
| In the text | |
Current usage metrics show cumulative count of Article Views (full-text article views including HTML views, PDF and ePub downloads, according to the available data) and Abstracts Views on Vision4Press platform.
Data correspond to usage on the plateform after 2015. The current usage metrics is available 48-96 hours after online publication and is updated daily on week days.
Initial download of the metrics may take a while.