Open Access
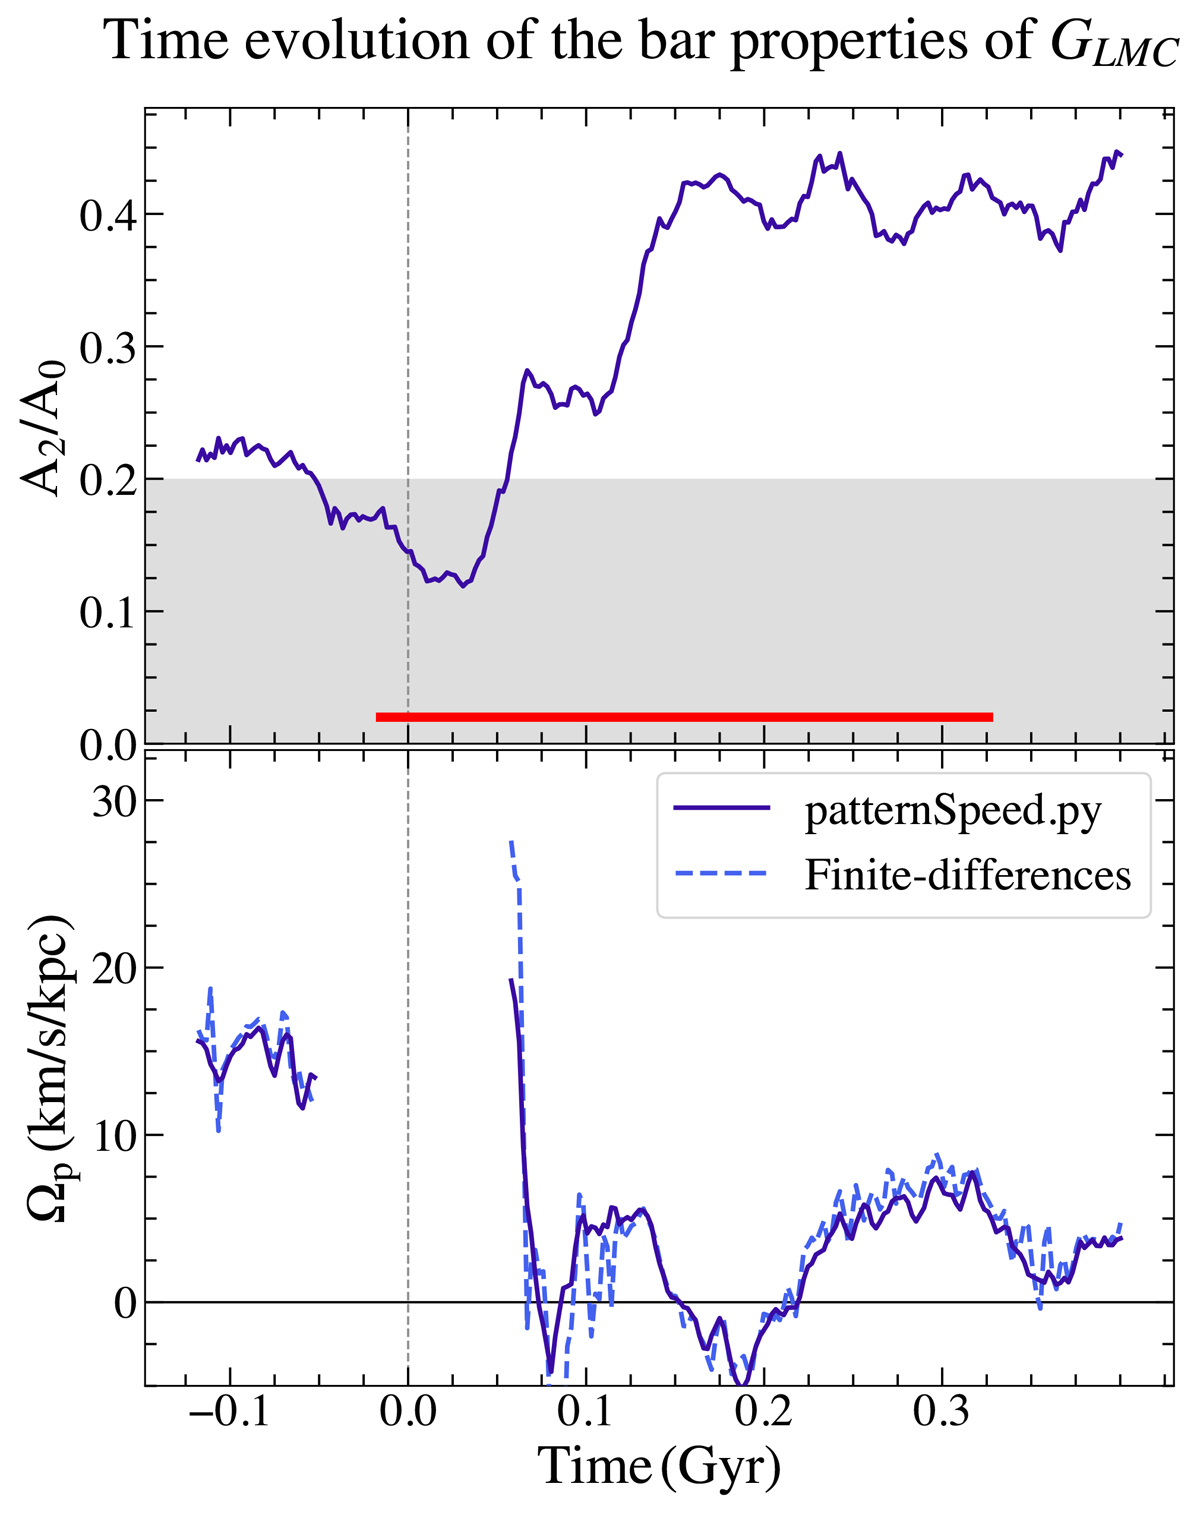
Fig. A.2.
Download original image
Same as Fig. 2 but for the K21 simulation. In the top panel, the horizontal red line corresponds to the time interval shown in Fig. A.1 (from t = −0.02 Gyr to t = 0.3 Gyr). Outside of the displayed temporal range, at t = −0.303 Gyr, the first (and previous) pericenter passage between the GLMC and GSMC takes place.
Current usage metrics show cumulative count of Article Views (full-text article views including HTML views, PDF and ePub downloads, according to the available data) and Abstracts Views on Vision4Press platform.
Data correspond to usage on the plateform after 2015. The current usage metrics is available 48-96 hours after online publication and is updated daily on week days.
Initial download of the metrics may take a while.