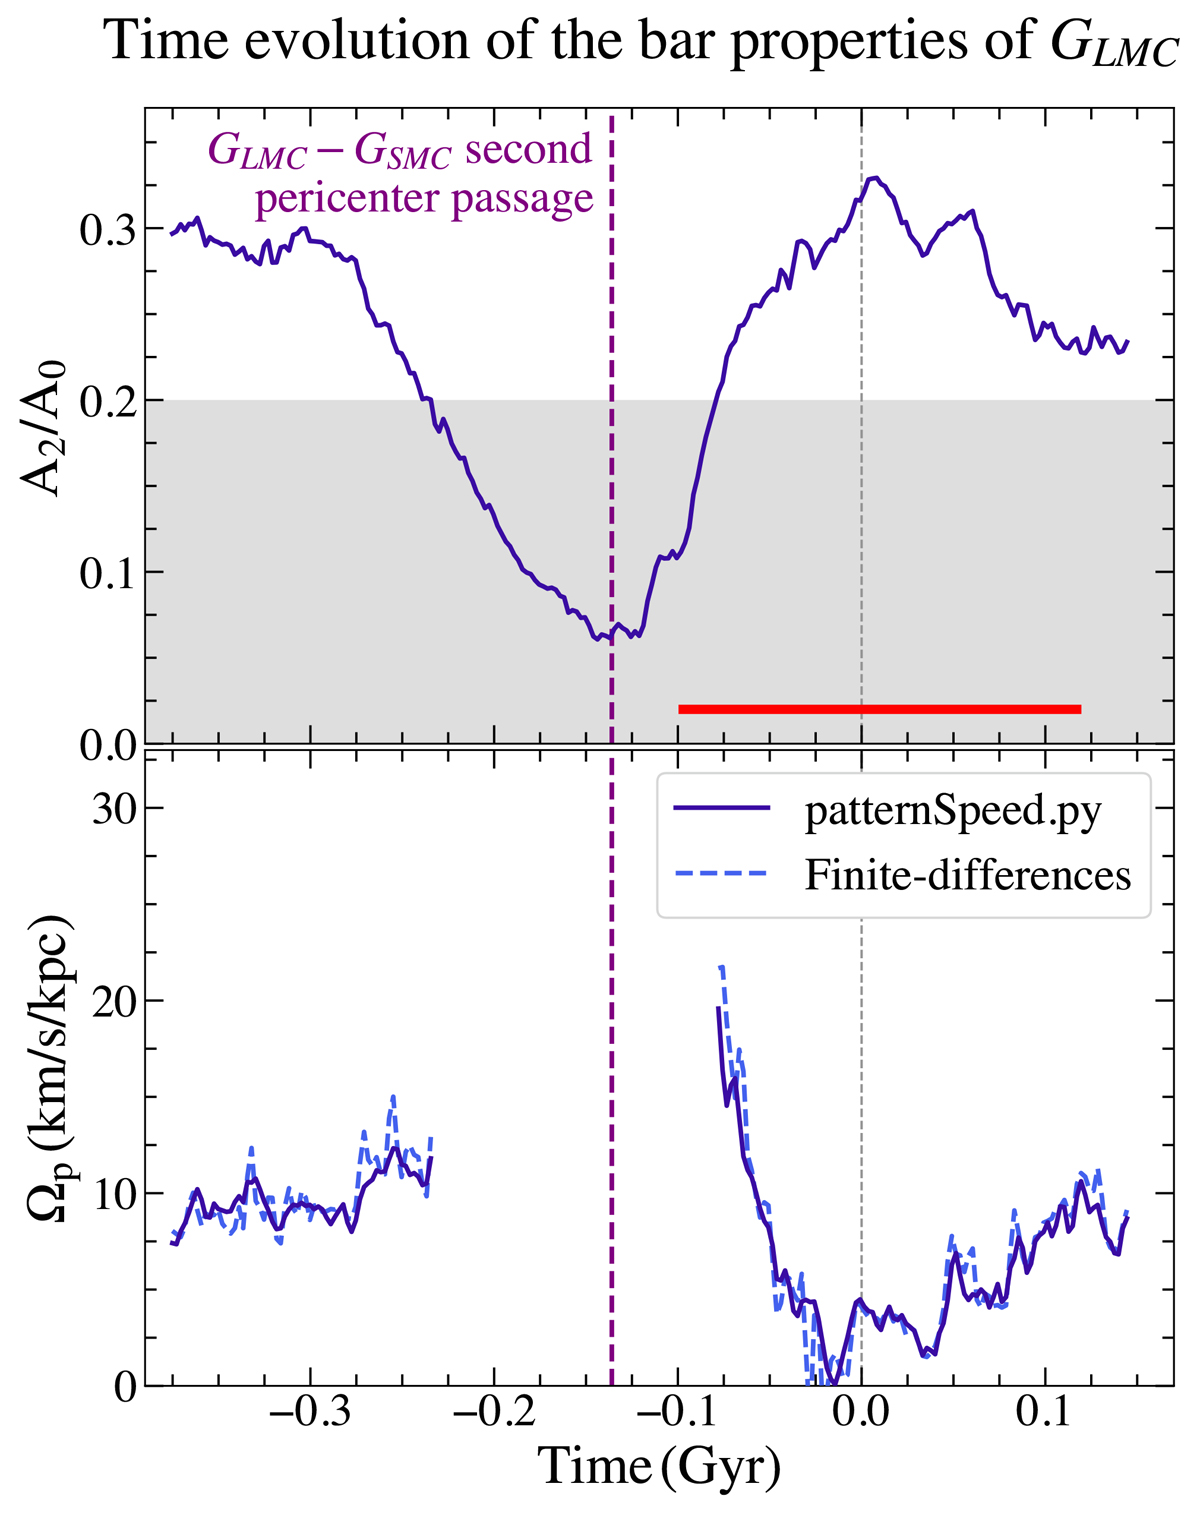
Fig. 2.
Download original image
Top: time evolution of the relative m = 2 Fourier amplitude A2/A0 in the bar region of the GLMC, which is defined by [R0, R1]=[0.2, 1.0] kpc. Bottom: Bar pattern speed Ωp determined by the program patternSpeed.py (solid blue) and by means of finite differences (dashed blue). The grey area in top panel corresponds to A2/A0 < 0.2, which is the threshold we used to consider whether the GLMC disc has a bar. The horizontal red line corresponds to the time interval shown in Fig. 1 (from t = −0.10 Gyr to t = 0.12 Gyr). In the bottom panel, we only show the bar pattern speed Ωp when the GLMC disc has a bar (A2/A0 > 0.2). The vertical dashed purple line corresponds to the GLMC − GSMC pericenter.
Current usage metrics show cumulative count of Article Views (full-text article views including HTML views, PDF and ePub downloads, according to the available data) and Abstracts Views on Vision4Press platform.
Data correspond to usage on the plateform after 2015. The current usage metrics is available 48-96 hours after online publication and is updated daily on week days.
Initial download of the metrics may take a while.