| Issue |
A&A
Volume 692, December 2024
|
|
|---|---|---|
| Article Number | A159 | |
| Number of page(s) | 13 | |
| Section | Extragalactic astronomy | |
| DOI | https://doi.org/10.1051/0004-6361/202451521 | |
| Published online | 09 December 2024 | |
Pattern speed evolution of barred galaxies in TNG50
1
Departament de Física Quàntica i Astrofísica (FQA), Universitat de Barcelona (UB), c. Martí i Franquès, 1, 08028 Barcelona, Spain
2
Institut de Ciències del Cosmos (ICCUB), Universitat de Barcelona (UB), c. Martí i Franquès, 1, 08028 Barcelona, Spain
3
Institut d’Estudis Espacials de Catalunya (IEEC), c. Gran Capità, 2-4, 08034 Barcelona, Spain
4
Astronomisches Rechen-Institut, Zentrum für Astronomie der Universität Heidelberg, Mönchhofstraße 12-14, 69120 Heidelberg, Germany
5
Mullard Space Science Laboratory, University College London, Holmbury St. Mary, Dorking, Surrey, RH5 6NT, UK
6
Aix Marseille Univ, CNRS, CNES, LAM, Marseille, France
⋆ Corresponding author; This email address is being protected from spambots. You need JavaScript enabled to view it.
Received:
15
July
2024
Accepted:
29
October
2024
Abstract
Context. Galactic bars are found in the majority of disc galaxies. They rotate nearly rigidly with an angular frequency called pattern speed. In idealised simulations, the bar pattern speed generally decreases with time due to dynamical friction exerted by the dark-matter halo, while cold gas can reduce or even reverse this trend.
Aims. We want to understand how different galaxy properties affect the evolution of the bar pattern speed in more realistic situations, including ongoing star formation, mass infall, active galactic nucleus (AGN) feedback, and galaxy interactions.
Methods. We traced the pattern-speed evolution of simulated bars in the TNG50-1 cosmological simulations.
Results. Simulated bars with an initially high pattern speed and a subsequent rapid slowdown are more likely found in more massive galaxies. Lower mass galaxies, on the other hand, preferentially host bars that start at relatively low pattern speeds and retain the same value until the end of the simulation. More massive simulated barred galaxies are also more affected by the AGN-feedback model, which very efficiently removes the cold gas that could have prevented the slowdown.
Conclusions. We find that bars grow and strengthen with slowdown, in agreement with higher resolution simulations. We find that strong correlations between the bar slowdown rate and galaxy mass weaken considerably when we use dimensionless measures to quantify the slowdown. In TNG50, the AGN-feedback prescription amplifies the mass dependence. Turned around, this provides an interesting statistic to constrain sub-grid physics by bar growth and slowdown.
Key words: galaxies: bulges / galaxies: evolution / galaxies: kinematics and dynamics / galaxies: spiral / galaxies: structure
© The Authors 2024
 Open Access article, published by EDP Sciences, under the terms of the Creative Commons Attribution License (https://creativecommons.org/licenses/by/4.0), which permits unrestricted use, distribution, and reproduction in any medium, provided the original work is properly cited.
This article is published in open access under the Subscribe to Open model. This email address is being protected from spambots. You need JavaScript enabled to view it. to support open access publication.
1. Introduction
Bars are ubiquitous in spiral galaxies in the local Universe, with roughly two-thirds of them hosting a bar in their inner disc (Eskridge et al. 2000; Menéndez-Delmestre et al. 2007; Sheth et al. 2008; Masters et al. 2011; Cheung et al. 2013; Erwin 2018). Recent discoveries by the JWST show that bars are also frequent at higher redshifts (Guo et al. 2023; Costantin et al. 2023; Le Conte et al. 2024).
The rotation rate or ‘pattern speed’ Ωp of bars was initially believed to stay constant with time, but numerical simulations of isolated galaxies have shown that Ωp can decrease owing to the dynamical friction of the bar against the dark-matter halo (Sellwood 1980; Weinberg 1985; Little & Carlberg 1991; Debattista & Sellwood 1998; Athanassoula 2003), in agreement with findings for the Milky Way bar (Chiba et al. 2021). Cold gas, on the other hand, loses its angular momentum to the bar as it is driven into the nuclear region, which reduces and may even reverse the bar slowdown, which in turn tends to diminish the bar strength (Friedli & Benz 1993; Villa-Vargas et al. 2009, 2010; Athanassoula et al. 2013; Athanassoula 2014; Beane et al. 2023).
A dimensionless measure for the bar rotation rate is the ratio ℛ = RCR/Lbar of the corotation radius RCR (where the circular frequency of stars rotating in the disc equals Ωp) and the bar length is Lbar. Theoretical arguments based on the extent of bar-supporting orbits require ℛ ≳ 1 (Contopoulos 1980). Bars with ℛ ≤ 1.4 are conventionally regarded as ‘fast’, and those with ℛ > 1.4 as ‘slow’ (Debattista & Sellwood 2000). While observational estimates of ℛ are plagued by various difficulties, which may lead to spurious findings of ‘ultra-fast’ bars (ℛ < 1, Cuomo et al. 2021), most observed bars appear to be fast (Corsini 2011; Aguerri et al. 2015; Guo et al. 2019). This seems to be at odds with emerging cosmological simulations, which produce slow (Algorry et al. 2017; Peschken & Łokas 2019; Roshan et al. 2021) or short bars (Frankel et al. 2022). The findings of Fragkoudi et al. (2021) suggest that this tension lessens with increasing resolution of the simulated barred galaxies.
In this study, we trace the pattern speeds of a sample of simulated barred galaxies from the TNG50-1 run of the IllustrisTNG suite of simulations (Pillepich et al. 2019; Nelson et al. 2019b,a). We aim to identify factors that affect the time evolution of Ωp and to relate them to the knowledge acquired from isolated idealised N-body experiments. One goal of this work is to understand how the astrophysics implemented in TNG50 via sub-grid models affects the pattern speeds of bars and their time evolution.
The paper is structured as follows. Section 2 briefly introduces the simulations and the sample of simulated barred galaxies that we considered in our analysis. Section 3 details how we measure Ωp. In Sect. 4, we correlate averaged properties of bar slowdown and host galaxies and identify the most relevant ones. Section 5 describes the relation between bars simulated in TNG50 and AGN feedback that we found to occur in the simulation. In Sect. 6, we discuss our findings in a broader context and summarise them.
2. Sample selection
IllustrisTNG is a suite of magnetohydrodynamical cosmological simulations that tracks the formation and evolution of galaxies. Besides gravity and magnetohydrodynamics, it also numerically approximates, via so-called sub-grid models, many other physical processes that are relevant to galaxy evolution (such as star formation), the growth of supermassive black holes (SMBHs), and feedback from both AGNs and stars. The run TNG50-1 has the highest resolution, with a typical stellar particle mass of 8.5 × 10⁴ M⊙ and a gravitational softening length of 288 pc. Different aspects of bars in TNG50-1 were previously studied by Rosas-Guevara et al. (2022), Frankel et al. (2022), Izquierdo-Villalba et al. (2022), Zana et al. (2022), Ansar & Das (2024), López et al. (2024), Rosas-Guevara et al. (2024), Anderson et al. (2024).
First, we used a list of 105 galaxies with bars at z = 0 compiled by Rosas-Guevara et al. (2022). We measured the azimuthal Fourier transform  of the surface density of these galaxies at snapshot 86 (which is z = 0.17; i.e. ∼2.1 Gyr before the end of the simulation), obtaining the relative m = 2 amplitude
  . To ensure sufficient signal, we cut the sample to those 79 simulated galaxies for which the maximum is A2 > 0.2 and for which the number of star particles inside the radius of this maximum exceeds 5 × 10⁴. This excludes objects in the original sample that only form a bar later on, such that their bar history is too short to meaningfully study bar evolution.
After this initial selection, several simulated galaxies still have several snapshots where our method did not work. A visual inspection revealed that the measurements were affected by various factors substantially disturbing the bar shape. These factors were strong interactions with external galaxies passing through the bar (minor mergers), very strong m = 2 spiral arms, and double bars (see Semczuk et al. 2024). Additionally, a few other cases have very weak, round bars that marginally pass A2 > 0.2 in some snapshots, but are too weak to allow the tracing of the continuous evolution of the pattern speed in others. After rejecting these cases, we are left with a final sample of 62 simulated galaxies with stellar masses in the range of 1010 − 1011.2 M⊙ at z = 0.
3. Measurements of the bar pattern speeds
To track the evolution of the bar pattern speeds, Ωp, we employed the program patternSpeed.py (Dehnen et al. 2023), version 0.5.3. The program uses the instantaneous method derived and described by Dehnen et al. (2023), which obtains the pattern speed as the time derivative,
 (1)
(1)
of the m = 2 Fourier phase ψ, which is widely used to track the bar orientation. Particles can enter and leave the radial range (bar region) over which ψ and Ωp are measured, which can lead to systematic errors of 5–25% (Dehnen et al. 2023) if not correctly accounted for. In order to take this radial flux into account, the bar region must have smooth radial boundaries, such that ∂ψ/∂R is finite and the effect of particles entering and leaving is fully incorporated by their radial velocity. patternSpeed.py has already been widely used to estimate the pattern speed of bars in simulations (e.g. Bland-Hawthorn et al. 2023; Hey et al. 2023; Machado et al. 2024) and also in 6D data of real galaxies (Jiménez-Arranz et al. 2024; Zhang et al. 2024).
The new method used to identify the bar region (from which Ωp is measured) that is in version 0.5.3 is somewhat different from that described by Dehnen et al. (2023). In particular, we measure, for a range of overlapping annuli, the relative azimuthal Fourier amplitudes,  , of the surface density and define, for each annulus, the bar strength as
![Mathematical equation: $$ \begin{aligned} S = \left[A_2^2+A_4^2+A_6^2\right]^{1/2} - \left[A_1^2+A_3^2+A_5^2\right]^{1/2}. \end{aligned} $$](/articles/aa/full_html/2024/12/aa51521-24/aa51521-24-eq5.gif) (2)
(2)
Where S > 0.1 at any radius, the bar region is identified as the range of annuli for which S > 0.025, and the Fourier phases ψm = 2 are within a 15° interval. An example bar region derived with this new method is compared with the density distribution of one of the simulated galaxies in Fig. 1, where it successfully separates the bar from the extended spiral.
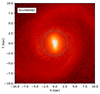 |
Fig. 1. Example barred galaxy at z = 0 with marked boundaries of the bar region derived as outlined in Sect. 3. The maximum of A2 amplitude for this snapshot is 0.38. |
Figures 2 and 3 show typical pattern-speed evolutions for bars from the considered sample (dots). Also shown (vertical red dashed lines) is the time, tAGN, at which the cumulative amount of kinetic AGN-feedback energy injected into surrounding gas reaches the threshold of 1015 M⊙/h(ckpc/h)2/(0.978 Gyr/h)2. We find that this coincides well with the carving out of the gas hole in the simulated discs, caused by the kinetic feedback (in conjunction with the fact that the cold gas phase is not realistically modelled at the resolution of these simulations). A larger bar slowdown occurs preferentially after tAGN, as we discuss in Sects. 4 and 5. In the top row of Fig. 2, we show four cases where the bar starts rotating at high absolute values of Ωp ≥ 100 Gyr−1 and then drastically slows down to ∼50 Gyr−1. Interestingly, Guo et al. (2019) found a few observed galaxies with Ωpsini > 80 Gyr−1 that would match the values of these simulated bars in the rapid slowdown phase. In the bottom panel, bars exhibit a different behaviour; their Ωp ≃ 40 − 60 Gyr−1 remains approximately constant throughout the evolution.
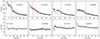 |
Fig. 2. Eight examples of bar-pattern-speed evolution (the IDs given are for z = 0) with significant slowdown (top) or little evolution (bottom). The time axis begins with the first snapshot where a bar is detected. Dashed vertical red lines indicate the time tAGN when kinetic feedback from the AGN reaches a threshold that coincides with the appearance of a hole in the simulated gas discs. |
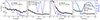 |
Fig. 3. Same as Fig. 2, but for four cases with somewhat irregular pattern-speed evolution. Blue and cyan lines show the relative distance between the host barred galaxies and an impacting interacting galaxy, whose total maximal masses Mpert prior to the interaction and distance of closest approach are indicated. |
Four examples with more irregular behaviour are shown in Fig. 3, where we also plot (blue) the time evolution of the distances to the interacting or merging companion galaxies. The first and third cases experience a minor merger (that ends at ∼13 and ∼10 Gyr, respectively), while the second and fourth are subject to fly-bys. The result of these interactions may vary from a wiggle pattern in case one, through small jumps in cases two and three, to a step-like jump in case four. We note that case four is the most extreme jump within our sample. These irregularities increase the noise when one attempts to find the main determinants for the secular evolution of bar pattern speed.
Figure A.1 shows the time evolution of the pattern speed of the remaining cases from our sample of simulated bars. It demonstrates the spectrum of behaviours, together with the frequency of fluctuations.
4. Bar slowdown and properties of galaxies
Previous studies of the slowdown of bars often used idealised numerical experiments where the total amount of dark matter and baryons is conserved or some components are injected artificially in order to understand its influence. While these are instructive, they are also unrealistic, since galaxies accrete mass, form stars, and interact with other galaxies throughout their history. The evolution is typically strongest in the earlier phases, which often coincide with the bar formation. Cosmological simulations therefore offer a more realistic view on the combination of these effects on the bar evolution, albeit at a somewhat reduced numerical resolution.
4.1. Absolute slowdown
From a quick look at the examples in Fig. 2, a simple conclusion can be drawn that simulated bars that form with high absolute values of Ωp slow down by a lot over their evolution, while those that start from lower values retain a similar speed over its course. To verify this conclusion, a correct determination of the bar formation time is needed, since, if this is mistakenly derived by some automatic method at later times in cases from the top row of Fig. 2, it may appear similar to the cases for the bottom row. For this reason, we determined the bar formation time by visual inspection of the surface density of stars in three projections (to make sure that the existence or not of the bar is not affected by the wrong inclination), a map of the average radial velocity vR, and the radial profiles of m = 2 Fourier analysis. Three examples of main plots used to determine the bar formation times are provided in Appendix B. In several cases, bars formed at high redshifts were destroyed, and later a new bar emerged. When this happened, we took the last bar formation time, which lasted until z = 0, to consider in our analysis. In Fig. 4, we show the dependence of the initial pattern speed of bars Ωp, init (measured by averaging the values of the first six snapshots after bar formation in order to reduce noise) on the bar formation time tform defined as above, colour-coded according to the total stellar mass (also averaged in the first six snapshots after bar formation). Bars that start with larger values of Ωp tend to form earlier. The figure also shows that our sample covers a continuous range of Ωp, init and tform values.
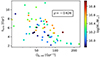 |
Fig. 4. Correlation between initial bar pattern speed Ωp, init and bar formation time tform. Colour indicates the total stellar masses of the simulated galaxies, averaged over the first six snapshots after bar formation. Spearman’s correlation coefficient ρ is indicated. |
In the top section of Fig. 5, we plot the initial bar pattern speeds against the final-to-initial ratios of the pattern speeds. We stress that the final and initial values used for this and the following plots Xfinal, initial = ⟨X⟩Navg were averaged in the first (or last) Navg = 6 snapshots to smooth out any small deviations, such as those discernible in Figs. 2 and 3. Changing the length of this averaging interval did not affect the general conclusions drawn from this and other plots. As inferred earlier from the examples in Figs. 2 and 3, Ωp, init strongly determines the amount of slowdown of bars. This can be understood based on findings of Athanassoula (2003). Bars that have high values of Ωp have their resonances embedded at smaller angular momentum and energy in dark matter haloes, where density is higher and so more material is present that can take the angular momentum. While the statistics of this correlation can be increased by correlating A versus B/A, this way of quantifying it does not determine its slope. If there had been no slowdown, it would have been a straight line at Ωp, final/Ωp, init ∼ 0.
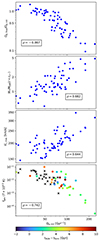 |
Fig. 5. Correlations between initial bar pattern speeds of Ωp, init and its ratio with the final value Ωp, final (top panel), the stellar-to-dark-mass ratio measured within the stellar half-mass radius M*/MDM(r < rh*) (second top panel), the maximum circular velocity Vc, max (second bottom panel), and the cold gas fraction fgas (T < 104.5 K) also measured inside r < rh* (bottom panel). The values are averaged from six consecutive snapshots at the bar formation. The colour in the bottom panel marks the difference between the times when AGN-feedback prescription switched from thermal to kinetic and the bar formation times (or black crosses if this switch never occurred). In each panel, Spearman’s correlation coefficients ρ are provided. |
Having established that Ωp, init is a crucial parameter in the evolution of Ωp, we looked for additional correlations between Ωp, init and various galaxy properties. Galaxy properties that we checked were the masses of stars, gas (‘cold’; i.e. T < 104.5 K, star-forming, and total), and dark matter measured within the stellar half-mass radius rh*; the ratios of stars to dark matter; the gas fractions; the half mass radii of stars and dark matter; rh* and rh, DM; the initial values of ℛ and the maximum circular velocities Vc, max. To find the rotation curve and its maximum we calculated the accelerations of stellar particles using the Griffin code that employs the fast multipole method as force solver (Dehnen 2000, 2014).
We looked for correlations of the initial pattern Ωp, init with various global properties of the simulated galaxies. In the bottom three panels of Fig. 5, we show those with Spearman correlation coefficient |ρ|> 0.6. We confirmed with the permutation test that the coefficients |ρ|> 0.6 were statistically significant by finding their P-values ≲0.0001. We found that Ωp, init correlates with stellar-to-dark-mass ratios M*/MDM and the maximum circular speed Vc, max, but anti-correlates with the cold gas fraction. We think that M*/MDM and cold gas fractions are affected by an artificial correlation between bar slowdown and AGN feedback (more details in the following section). In the bottom panel (plotting fgas vs. Ωp, init), we use colour to indicate the difference between tAGN, which coincides with the kinetic-feedback-driven central gas holes (defined in Sect. 3), and the bar formation time. Galaxies that reached the kinetic feedback threshold at tAGN are also more likely to have their gas heated by the AGN during the thermal feedback mode (since thermal energy emitted is proportional to the accretion rate, which at the same increases SMBH mass – a determining parameter of the switch between the two modes), which reduces the amount of cold gas.
There are two possible explanations for the correlation between Vc, max and Ωp, init. First, in more massive haloes everything rotates faster, and this might transfer to newly formed bars. Another explanation is that, since the particle resolution is fixed in this simulation, more massive galaxies are better resolved; therefore, they can experience this initial phase of very high absolute pattern speed, while for the less massive objects the low resolution prevents this from happening.
4.2. Relative slowdown
As shown in the previous subsection, the initial absolute pattern speed and therefore the absolute slowdown of bars scales with the Vc, max of galaxies. This scaling means that comparing the absolute values may be a bit misleading. To look at the problem in a more dimensionless manner, following Chiba et al. (2021) we adopted the slowing rate parameter  and define an averaged slowing rate more suited to our numerical study,
![Mathematical equation: $$ \begin{aligned} \langle \eta \rangle =-\frac{\Delta \Omega _{\mathrm{p} }/ \Delta t}{\Omega _{\mathrm{p,init} }\,\Omega _{\mathrm{p,final} }} = \frac{1}{\Delta t} \left[\frac{1}{\Omega _{\mathrm{p,final} }}-\frac{1}{\Omega _{\mathrm{p,init} }}\right], \end{aligned} $$](/articles/aa/full_html/2024/12/aa51521-24/aa51521-24-eq7.gif) (3)
(3)
where Δt is the time between measuring Ωp, final and Ωp, initial.
The top two panels of Fig. 6 show the correlations between ⟨η⟩ and Ωp, init and Vc, max. Mean slowing rate scales with these two values, just as Ωp, final/Ωp, init. However, when we normalise the Ωp, init with a characteristic frequency defined as Ωchar = Ωc(rh*), the correlation is no longer there (middle panel of Fig. 6). This is unsurprising since Ωchar approximately scales with Vc, max, which, as we found, correlates with Ωp, init. The lack of correlation in this space reinforces the notion that the galaxy mass (and therefore resolution) scaling may be the dominant factor determining Ωp, init. The weakening of the correlations is also seen in the two bottom panels of Fig. 6, where we look into the initial stellar-to-dark-mass ratio and cold gas fractions (already dimensionless).
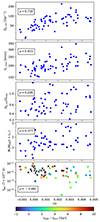 |
Fig. 6. Correlations between mean slowdown parameter ⟨η⟩ and initial pattern speeds of bars Ωp, init (top), the maximum circular velocity Vc, max (second top), normalised initial pattern speeds of bars Ωp, init/Ωchar (middle), the stellar-to-dark-mass ratio measured within the stellar half-mass radius M*/MDM(r < rh*) (second bottom), and the cold gas fraction fgas (T < 104.5 K) also measured inside r < rh* (bottom). The colour-scale for the bottom panel is the same as for Fig. 5. |
4.3. Slowdown and the evolution of bars
When bars slow down, the position of the bar resonances moves outwards, thus enabling the trapping of new stars and an increase in bar size. It is still under debate at what rate both things occur, which influences the evolution of ℛ. It has long been known that ℛ is a problematic parameter for calculating in observations and simulations. Because it is a ratio, a small deviation in the denominator can change significantly its value and physical interpretation. Simulations have shown (e.g. Michel-Dansac & Wozniak 2006; Ghosh & Di Matteo 2024) that the bar length, that is, the denominator in ℛ, is a very problematic parameter to measure. It is also true for the methods we used for the analysis of this simulation, and an example is shown in Fig. 7. In the top panel, we show the time evolution of the bar length Lbar assumed to be the outer radius of the bar region, as calculated by patternSpeed.py (Dehnen et al. 2023), and the corotation radius RCR, which was calculated using the pattern speed measurements and the rotation curves as described in Sect. 4.1. We note that the primary purpose of the outer bar region given by patternSpeed.py is to estimate Ωp and that using it as an Lbar is a rough proxy. The bottom panel shows the time evolution of the ratio of these two parameters (i.e. ℛ with the marked boundary separating the slow and fast bars). We see that while the average time evolution of the Lbar and RCR shows a stable increasing trend, its ratio has a very noisy pattern, where the classification from the slow-to-fast bar changes multiple times. RCR fluctuates in this example galaxy because of its strong spiral structure, as described by Wu et al. (2016). Because of the difficulties presented in this example, we abstain from analysing the time evolution of ℛ as the noise combined with a sharp numerical limit of ℛ may lead to false conclusions. Instead, we focus on looking directly at the co-evolution of bar slowdown and growth of the bar.
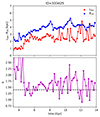 |
Fig. 7. Example of time evolution of bar length Lbar and corotation radius RCR (top) and their ratio ℛ = RCR/Lbar (bottom) for a barred galaxy of ID=333 425 at z = 0. A black dashed horizontal line marks the customary boundary of ℛ = 1.4 between relatively fast and slow bars. While the average evolution of the bar length and the corotation radius is stable, small deviations in both of them make the ratio noisy, which complicates the interpretation of the values of this parameter. |
Figure 8 shows the correlations between the ratios of the final-to-initial values of bar lengths Lbar and pattern speeds Ωp (top) and corotation radii RCR (bottom). Both figures confirm that when bars slow and the corotation radii grow, they also increase in size. The growth of the corotation radius is greater than the growth of the bar size for the galaxies that slow down more and reside in more massive galaxies. In the bottom panel of Fig. 8, we plot a line of ℛfinal/ℛinit = 1 and colour the points with values of the mean slowing rate ⟨η⟩. Bars that slow down more lie over the plotted line; therefore, their ℛ would increase and they would also slow down in terms of this parameter. Bars with low values of ⟨η⟩ lay below the dashed line, which would imply that they speed up in terms of ℛ. While their Ωp remains, on average, constant throughout their evolution, the decrease in ℛ is caused by the noise, as in the example in Fig. 7. While the bar length is already a noisy parameter, its initial values suffer more from noise, since bars are usually weak in their early evolutionary stages and strengthen with time.
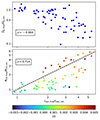 |
Fig. 8. Correlations between final-to-initial ratios of pattern speeds Ωp and bar lengths Lbar (top) and corotation radii RCR (bottom). The dashed black line in the bottom panel marks where ℛ would not change; i.e. ℛfinal/ℛinit = 1. The colour of points in the top panel indicates the mean slowing rate ⟨η⟩. The bars that slow down more lie above the ℛfinal/ℛinit = 1, which means their ℛ goes up and they also slow down in terms of ℛ. |
Besides looking at the growth of the bars in their sizes, we also looked at how their final properties are related to the slowdown. Figure 9 shows the correlation between Ωp, final/Ωp, init and the final bar pattern speed, length, and strength. The bar strength here is defined as the maximum of the m = 2 Fourier amplitude. We find that bars that slowed down significantly end up stronger, longer, and with lower absolute pattern speeds than those that retain an approximately constant pattern speed. Bars that do not slow down do not reach amplitudes higher than 0.4–0.5. This correlation is in agreement with the findings of Athanassoula (2003) from the simulations of isolated galaxies. Bars growing stronger and longer is also exacerbated by their low gas fractions, since gas has long been known to hamper the bar evolution (e.g. Athanassoula et al. 2013). Low gas fractions are linked to AGN feedback (see the bottom of Fig. 5 and Sect. 5), which in TNG100 was also linked to the growth of stronger bars (Rosas-Guevara et al. 2020; Łokas 2022a,b).
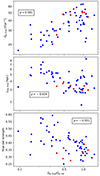 |
Fig. 9. Correlations between final-to-initial pattern-speed ratio and the final pattern speed (top), bar length, and bar strength, measured as the maximum of the m = 2 Fourier amplitude. Red points mark cases with more irregular evolution of Ωp. Bars that have slowed down significantly tend to grow stronger and longer and have lower absolute pattern speed. |
5. Bar slowdown and AGN-feedback relation
The AGN feedback in the IllustrisTNG suite is constructed with two modes: thermal and kinetic (Weinberger et al. 2017, 2018). The SMBH is first seeded with an initial mass of 1.2 × 10⁶ M⊙, at which point the mass of the galaxy exceeds 7.4 × 10¹⁰ M⊙ and thereafter grows through mergers and gas accretion. AGN feedback is modelled initially in a thermal model, where energy is transferred to the surrounding gas. Once the SMBH reaches a mass of 108 M⊙, the feedback prescription is switched from thermal to kinetic mode, where both energy and momentum are transferred to the gas. Shortly afterwards, at around tAGN, the feedback quickly creates a large central hole in the gas distribution, reaching 2–8 kpc in radius.
We noticed a correlation between the time evolutions of bar pattern speeds and stellar half-mass radii: cases of decreasing Ωp have growing rh*, while for near-constant Ωp also rh* stayed constant. This behaviour is summarised in Fig. 10. The explanation is that bars that slow down more reside in galaxies whose SMBHs grow earlier and faster. For these galaxies, the simulation prescriptions switch feedback earlier to kinetic mode, which clears the gas from the inner parts of the galaxy. The formation of these holes and the distribution of gas, which is a star formation fuel, can be seen in the top row of Fig. 11, where the examples are the same as in Fig. 2. This gas removal has two effects. First, it limits star formation to the outer parts, which results in enhanced increase of rh*. Second, removing cold gas from the vicinity of the bar prevents gas inflow and the associated angular momentum gain by and weakening of the bar; that is, it shifts the balance towards bar slowdown and strengthening. Thus, we expect that the correlation between rh* and the amount of slowdown of simulated bars is created or at least exacerbated by the specific way AGN feedback is implemented in IllustrisTNG. Another consequence of this relation is that average galaxy properties measured at or within rh* are affected by the AGN-feedback-driven evolution of rh*, confusing the interpretation of any correlations.
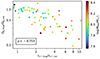 |
Fig. 10. Correlation between final-to-initial ratios of the stellar half-mass radii of the barred galaxies and the bar pattern speeds. The colour bar marks the final mass of the SMBH of those galaxies. Those galaxies where the SMBH lies above the threshold of 108 M⊙ had their AGN feedback switch to kinetic mode. We argue in the text that this correlation is at least partly a result of the AGN-feedback prescription of IllustrisTNG. |
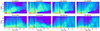 |
Fig. 11. Time evolution of gas density profiles for eight example simulated barred galaxies from TNG50-1. The IDs given in the plots are for z = 0. Vertical black dashed lines mark the bar formation times. The examples correspond to the cases from Fig. 2, where those in the top panel experienced a significant slowdown and those in the bottom panel had smaller changes in Ωp. |
After the publication of our paper, Frosst et al. (2024) confirmed our findings on the connection between bars and AGN feedback in TNG50.
6. Discussion and summary
6.1. Discussion
We found a continuous distribution of pattern speed evolutions in the considered sample. In terms of the evolution of the absolute values, the behaviour ranges from those starting at very high pattern speed, Ωp, and later slowing down drastically, to those for which Ωp starts at a lower value and remains roughly constant. We found that the change in this behaviour correlates with the galaxy mass (quantified by Vc, max). Since the stellar particle masses in TNG simulations do not vary much, the more massive galaxies are better resolved than the less massive ones. This suggests that evolution differences in Ωp in this simulation suite are affected by resolution. Indeed, Frankel et al. (2022) found that Ωp of bars simulated at an eight times lower mass resolution (TNG50-2 vs. TNG50-1 with otherwise identical initial conditions) is on average more than two times smaller. Similarly, the (initial) Ωp of bars formed in isolated idealised simulations without gas decreases with resolution (e.g. Sellwood & Debattista 2009), though much less so than found by Frankel et al. (2022).
This resolution effect exacerbates the effect shown in Fig. 10 and discussed in Sect. 5 of enhanced bar slowdown as a consequence of gas removal due to stronger AGN feedback in more massive galaxies. As the latter is at least to some degree unrealistic, it appears that simulated bar slowdown is plagued by numerical artefacts in several ways.
The AGN-feedback prescription is another factor that is tied to galaxy mass (and resolution) and shapes the bar pattern speed evolution, as discussed in Sect. 5. For more massive galaxies, the AGN switches to kinetic feedback earlier, removing the cold gas from their inner parts and preventing gas inflow that would otherwise oppose the slowdown. Therefore, it is not yet clear to what extent the mechanism of the bar gaining angular momentum from the gas and losing it to the halo (which was confirmed in idealised isolated simulations by Friedli & Benz 1993; Villa-Vargas et al. 2009, 2010; Athanassoula et al. 2013; Athanassoula 2014; Beane et al. 2023) applies in more realistic simulations or even real galaxies.
A natural next step in the investigation of physics behind bar slowdown in cosmological setups, with ever-changing galaxy components, is to use higher resolution, but also a range of ideally more realistic sub-grid prescriptions of all unresolved processes, but in particular AGN feedback. This would show the extent to which the simulations converge and the results reported here are artefacts of the simulation prescriptions or are general laws ruling the bar pattern speed evolution. While higher resolution cosmological runs are very expensive, zoomed-in simulations such as Auriga (Grand et al. 2016) are more affordable and can give some partial answers. The changes in terms of ℛ (Fragkoudi et al. 2021) suggest that the evolution of Ωp is also different from TNG50. Another possibility for future explorations of the bar slowdown could be a more detailed analysis of this sample of galaxies by, for example, looking into dark-matter distribution during the bar slowdown for those bars that have their gas removed.
6.2. Summary
In this work, we studied the pattern speed evolution of a sample of 62 simulated barred galaxies from the TNG50-1 run of the magnetohydrodynamical cosmological suite IllustrisTNG (Pillepich et al. 2019; Nelson et al. 2019b, 2019a). We used our recent code (Dehnen et al. 2023) to measure the bar pattern speeds from individual snapshots. We found bars that start their evolution with high absolute values of Ωp and quickly slow down. We also found bars whose Ωp start at lower values and remain approximately constant until the end of the simulation. The transition between the two behaviours seems to be smooth, without any apparent gaps. We find the former behaviour more frequently in more massive, and thus more resolved, galaxies, while the latter happens more often in the low-resolution cases. The prescription for AGN feedback in the TNG simulations results in the more massive galaxies having more intense feedback, which leads to a coincidence between the bar slowdown and the removal of the cold gas from the inner parts of the disc. Most of the simulated bars that did slow down are found in galactic discs with inner holes in their gas discs. Had this gas not been removed, it could potentially prevent the slowdown, according to previous experiments on isolated galaxies.
A central point arising from our analysis is the connection between the specific AGN-feedback model and bar slowdown. This differs from common arguments targeting how bars feed the AGN or drive quenching. Here, we outline how the excavation of the inner galaxy ISM by AGN feedback drives accelerated bar slowdown, which strongly depends on how long and to what extent the cold ISM persists. This dynamical behaviour thus provides an independent way to distinguish AGN-driven quenching by removing the star-forming gas or by starving it via the removal of the coronal gas from which the star-forming gas is replenished.
Acknowledgments
We thank the anonymous referee for a helpful report. We are grateful to the IllustrisTNG team for making their simulations publicly available. We appreciate insightful discussions with T. Antoja, E. L. Łokas, V. P. Debattista, M. Bernet, P. Ramos, J. Ardèvol, F. Figueras, F. Anders, M. Romero Gómez. This work was partially supported by the Spanish MICIN/AEI/10.13039/501100011033 and by “ERDF A way of making Europe” by the “European Union” and the European Union ≪ Next Generation EU≫/PRTR, through grants PID2021-125451NA-I00 and CNS2022-135232, and the Institute of Cosmos Sciences University of Barcelona (ICCUB, Unidad de Excelencia ‘María de Maeztu’) through grant CEX2019-000918-M. RS gratefully acknowledges the generous support of a Royal Society University Research Fellowship. This work was performed using the DiRAC Data Intensive service at Leicester, operated by the University of Leicester IT Services, which forms part of the STFC DiRAC HPC Facility (www.dirac.ac.uk). The equipment was funded by BEIS capital funding via STFC capital grants ST/K000373/1 and ST/R002363/1 and STFC DiRAC Operations grant ST/R001014/1. DiRAC is part of the National e-Infrastructure. This work made use of the following software packages: matplotlib (Hunter 2007), numpy (Harris et al. 2020), python (Van Rossum & Drake 2009), scipy (Virtanen et al. 2020; Gommers et al. 2024), Cython (Behnel et al. 2011), h5py (Collette 2013; Collette et al. 2023) and Numba (Lam et al. 2015, 2024).
References
- Aguerri, J. A. L., Méndez-Abreu, J., Falcón-Barroso, J., et al. 2015, A&A, 576, A102 [NASA ADS] [CrossRef] [EDP Sciences] [Google Scholar]
- Algorry, D. G., Navarro, J. F., Abadi, M. G., et al. 2017, MNRAS, 469, 1054 [Google Scholar]
- Anderson, S. R., Gough-Kelly, S., Debattista, V. P., et al. 2024, MNRAS, 527, 2919 [Google Scholar]
- Ansar, S., & Das, M. 2024, ApJ, 975, 243 [CrossRef] [Google Scholar]
- Athanassoula, E. 2003, MNRAS, 341, 1179 [Google Scholar]
- Athanassoula, E. 2014, MNRAS, 438, L81 [Google Scholar]
- Athanassoula, E., Machado, R. E. G., & Rodionov, S. A. 2013, MNRAS, 429, 1949 [Google Scholar]
- Beane, A., Hernquist, L., D’Onghia, E., et al. 2023, ApJ, 953, 173 [NASA ADS] [CrossRef] [Google Scholar]
- Behnel, S., Bradshaw, R., Citro, C., et al. 2011, Comput. Sci. Eng., 13, 31 [Google Scholar]
- Bland-Hawthorn, J., Tepper-Garcia, T., Agertz, O., & Freeman, K. 2023, ApJ, 947, 80 [NASA ADS] [CrossRef] [Google Scholar]
- Cheung, E., Athanassoula, E., Masters, K. L., et al. 2013, ApJ, 779, 162 [NASA ADS] [CrossRef] [Google Scholar]
- Chiba, R., Friske, J. K. S., & Schönrich, R. 2021, MNRAS, 500, 4710 [Google Scholar]
- Collette, A. 2013, Python and HDF5 (O’Reilly) [Google Scholar]
- Collette, A., Kluyver, T., Caswell, T. A., et al. 2023, h5py/h5py: 3.8.0, https://doi.org/10.5281/zenodo.7560547 [Google Scholar]
- Contopoulos, G. 1980, A&A, 81, 198 [NASA ADS] [Google Scholar]
- Corsini, E. M. 2011, Mem. Soc. Astron. It. Suppl., 18, 23 [Google Scholar]
- Costantin, L., Pérez-González, P. G., Guo, Y., et al. 2023, Nature, 623, 499 [NASA ADS] [CrossRef] [Google Scholar]
- Cuomo, V., Lee, Y. H., Buttitta, C., et al. 2021, A&A, 649, A30 [NASA ADS] [CrossRef] [EDP Sciences] [Google Scholar]
- Debattista, V. P., & Sellwood, J. A. 1998, ApJ, 493, L5 [Google Scholar]
- Debattista, V. P., & Sellwood, J. A. 2000, ApJ, 543, 704 [Google Scholar]
- Dehnen, W. 2000, ApJ, 536, L39 [NASA ADS] [CrossRef] [Google Scholar]
- Dehnen, W. 2014, Comput. Astrophys. Cosmol., 1, 1 [NASA ADS] [CrossRef] [Google Scholar]
- Dehnen, W., Semczuk, M., & Schönrich, R. 2023, MNRAS, 518, 2712 [Google Scholar]
- Erwin, P. 2018, MNRAS, 474, 5372 [Google Scholar]
- Eskridge, P. B., Frogel, J. A., Pogge, R. W., et al. 2000, AJ, 119, 536 [NASA ADS] [CrossRef] [Google Scholar]
- Fragkoudi, F., Grand, R. J. J., Pakmor, R., et al. 2021, A&A, 650, L16 [NASA ADS] [CrossRef] [EDP Sciences] [Google Scholar]
- Frankel, N., Pillepich, A., Rix, H.-W., et al. 2022, ApJ, 940, 61 [CrossRef] [Google Scholar]
- Friedli, D., & Benz, W. 1993, A&A, 268, 65 [NASA ADS] [Google Scholar]
- Frosst, M., Obreschkow, D., Ludlow, A., Bottrell, C., & Genel, S. 2024, Supermassive black hole feedback quenches disc galaxies and suppresses bar formation in TNG50 [Google Scholar]
- Ghosh, S., & Di Matteo, P. 2024, A&A, 683, A100 [NASA ADS] [CrossRef] [EDP Sciences] [Google Scholar]
- Gommers, R., Virtanen, P., Haberland, M., et al. 2024, scipy/scipy: SciPy 1.13.1, https://doi.org/10.5281/zenodo.11255513 [Google Scholar]
- Grand, R. J. J., Springel, V., Gómez, F. A., et al. 2016, MNRAS, 459, 199 [Google Scholar]
- Guo, R., Mao, S., Athanassoula, E., et al. 2019, MNRAS, 482, 1733 [Google Scholar]
- Guo, Y., Jogee, S., Finkelstein, S. L., et al. 2023, ApJ, 945, L10 [NASA ADS] [CrossRef] [Google Scholar]
- Harris, C. R., Millman, K. J., van der Walt, S. J., et al. 2020, Nature, 585, 357 [NASA ADS] [CrossRef] [Google Scholar]
- Hey, D. R., Huber, D., Shappee, B. J., et al. 2023, AJ, 166, 249 [NASA ADS] [CrossRef] [Google Scholar]
- Hunter, J. D. 2007, Comput. Sci. Eng., 9, 90 [NASA ADS] [CrossRef] [Google Scholar]
- Izquierdo-Villalba, D., Bonoli, S., Rosas-Guevara, Y., et al. 2022, MNRAS, 514, 1006 [NASA ADS] [CrossRef] [Google Scholar]
- Jiménez-Arranz, Ó., Chemin, L., Romero-Gómez, M., et al. 2024, A&A, 683, A102 [NASA ADS] [CrossRef] [EDP Sciences] [Google Scholar]
- Lam, S. K., Pitrou, A., & Seibert, S. 2015, Proc. Second Workshop on the LLVM Compiler Infrastructure in HPC, 1 [Google Scholar]
- Lam, S. K., stuartarchibald, , Pitrou, A., et al. 2024, numba/numba: 0.60.0, https://doi.org/10.5281/zenodo.11642058 [Google Scholar]
- Le Conte, Z. A., Gadotti, D. A., Ferreira, L., et al. 2024, MNRAS, 530, 1984 [NASA ADS] [CrossRef] [Google Scholar]
- Little, B., & Carlberg, R. G. 1991, MNRAS, 250, 161 [Google Scholar]
- Łokas, E. L. 2022a, A&A, 668, L3 [NASA ADS] [CrossRef] [EDP Sciences] [Google Scholar]
- Łokas, E. L. 2022b, A&A, 667, A27 [NASA ADS] [CrossRef] [EDP Sciences] [Google Scholar]
- López, P. D., Scannapieco, C., Cora, S. A., & Gargiulo, I. D. 2024, MNRAS, 529, 979 [CrossRef] [Google Scholar]
- Machado, R. E. G., Sakamoto, K. R., Wille, A., & Gonçalves, G. F. 2024, Universe, 10, 223 [NASA ADS] [CrossRef] [Google Scholar]
- Masters, K. L., Nichol, R. C., Hoyle, B., et al. 2011, MNRAS, 411, 2026 [Google Scholar]
- Menéndez-Delmestre, K., Sheth, K., Schinnerer, E., Jarrett, T. H., & Scoville, N. Z. 2007, ApJ, 657, 790 [Google Scholar]
- Michel-Dansac, L., & Wozniak, H. 2006, A&A, 452, 97 [NASA ADS] [CrossRef] [EDP Sciences] [Google Scholar]
- Nelson, D., Pillepich, A., Springel, V., et al. 2019a, MNRAS, 490, 3234 [Google Scholar]
- Nelson, D., Springel, V., Pillepich, A., et al. 2019b, Comput. Astrophys. Cosmol., 6, 2 [Google Scholar]
- Peschken, N., & Łokas, E. L. 2019, MNRAS, 483, 2721 [Google Scholar]
- Pillepich, A., Nelson, D., Springel, V., et al. 2019, MNRAS, 490, 3196 [Google Scholar]
- Rosas-Guevara, Y., Bonoli, S., Dotti, M., et al. 2020, MNRAS, 491, 2547 [NASA ADS] [Google Scholar]
- Rosas-Guevara, Y., Bonoli, S., Dotti, M., et al. 2022, MNRAS, 512, 5339 [NASA ADS] [CrossRef] [Google Scholar]
- Rosas-Guevara, Y., Bonoli, S., Misa Moreira, C., & Izquierdo-Villalba, D. 2024, A&A, 684, A179 [NASA ADS] [CrossRef] [EDP Sciences] [Google Scholar]
- Roshan, M., Ghafourian, N., Kashfi, T., et al. 2021, MNRAS, 508, 926 [NASA ADS] [CrossRef] [Google Scholar]
- Sellwood, J. A. 1980, A&A, 89, 296 [NASA ADS] [Google Scholar]
- Sellwood, J. A., & Debattista, V. P. 2009, MNRAS, 398, 1279 [Google Scholar]
- Semczuk, M., Łokas, E. L., de Lorenzo-Cáceres, A., & Athanassoula, E. 2024, MNRAS, 528, L83 [Google Scholar]
- Sheth, K., Elmegreen, D. M., Elmegreen, B. G., et al. 2008, ApJ, 675, 1141 [Google Scholar]
- Van Rossum, G., & Drake, F. L. 2009, Python 3 Reference Manual (Scotts Valley, CA: CreateSpace) [Google Scholar]
- Villa-Vargas, J., Shlosman, I., & Heller, C. 2009, ApJ, 707, 218 [NASA ADS] [CrossRef] [Google Scholar]
- Villa-Vargas, J., Shlosman, I., & Heller, C. 2010, ApJ, 719, 1470 [Google Scholar]
- Virtanen, P., Gommers, R., Oliphant, T. E., et al. 2020, Nat. Methods, 17, 261 [Google Scholar]
- Weinberg, M. D. 1985, MNRAS, 213, 451 [Google Scholar]
- Weinberger, R., Springel, V., Hernquist, L., et al. 2017, MNRAS, 465, 3291 [Google Scholar]
- Weinberger, R., Springel, V., Pakmor, R., et al. 2018, MNRAS, 479, 4056 [Google Scholar]
- Wu, Y.-T., Pfenniger, D., & Taam, R. E. 2016, ApJ, 830, 111 [NASA ADS] [CrossRef] [Google Scholar]
- Zana, T., Lupi, A., Bonetti, M., et al. 2022, MNRAS, 515, 1524 [NASA ADS] [CrossRef] [Google Scholar]
- Zhang, H., Belokurov, V., Evans, N. W., Kane, S. G., & Sanders, J. L. 2024, MNRAS, 533, 3395 [CrossRef] [Google Scholar]
Appendix A: Evolution of the pattern speed of the remaining cases
Figure A.1 shows the pattern speed evolution of the remaining 50 cases from our sample, that were not shown in the main body of the paper. It demonstrates different behaviours of the pattern speed that bars in TNG50 exhibit.
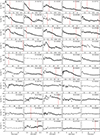 |
Fig. A.1. Time evolution of the pattern speed for remaining cases from our sample of barred galaxies from TNG50-1. Dashed vertical red lines indicate tAGN, as in Fig. 2 and ig. 3. |
Appendix B: Determination of the bar formation time
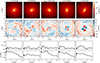 |
Fig. B.1. Plots used to determine the bar formation time for the simulated galaxy with ID=371127 at z = 0. Top row: face-on surface-density maps for five consecutive snapshots around that identified as bar-formation time (center column). Second row: face-on v̄R maps for the same snapshots. Third and fourth rows: radial profiles of the m = 2 Fourier amplitudes and phases. |
As mentioned in Sect. 4.1 we determined the bar formation time by the visual inspection of the surface density maps, the face-on v̄R maps, and radial profiles of m = 2 Fourier amplitudes and phases. Figures B.1 and B.2 show the most important plots (without the vertical projections) for this analysis for three example galaxies. The central column in those figures shows the snapshot we identified as the bar formation time.
All Figures
|
Fig. 1. Example barred galaxy at z = 0 with marked boundaries of the bar region derived as outlined in Sect. 3. The maximum of A2 amplitude for this snapshot is 0.38. |
| In the text | |
|
Fig. 2. Eight examples of bar-pattern-speed evolution (the IDs given are for z = 0) with significant slowdown (top) or little evolution (bottom). The time axis begins with the first snapshot where a bar is detected. Dashed vertical red lines indicate the time tAGN when kinetic feedback from the AGN reaches a threshold that coincides with the appearance of a hole in the simulated gas discs. |
| In the text | |
|
Fig. 3. Same as Fig. 2, but for four cases with somewhat irregular pattern-speed evolution. Blue and cyan lines show the relative distance between the host barred galaxies and an impacting interacting galaxy, whose total maximal masses Mpert prior to the interaction and distance of closest approach are indicated. |
| In the text | |
|
Fig. 4. Correlation between initial bar pattern speed Ωp, init and bar formation time tform. Colour indicates the total stellar masses of the simulated galaxies, averaged over the first six snapshots after bar formation. Spearman’s correlation coefficient ρ is indicated. |
| In the text | |
|
Fig. 5. Correlations between initial bar pattern speeds of Ωp, init and its ratio with the final value Ωp, final (top panel), the stellar-to-dark-mass ratio measured within the stellar half-mass radius M*/MDM(r < rh*) (second top panel), the maximum circular velocity Vc, max (second bottom panel), and the cold gas fraction fgas (T < 104.5 K) also measured inside r < rh* (bottom panel). The values are averaged from six consecutive snapshots at the bar formation. The colour in the bottom panel marks the difference between the times when AGN-feedback prescription switched from thermal to kinetic and the bar formation times (or black crosses if this switch never occurred). In each panel, Spearman’s correlation coefficients ρ are provided. |
| In the text | |
|
Fig. 6. Correlations between mean slowdown parameter ⟨η⟩ and initial pattern speeds of bars Ωp, init (top), the maximum circular velocity Vc, max (second top), normalised initial pattern speeds of bars Ωp, init/Ωchar (middle), the stellar-to-dark-mass ratio measured within the stellar half-mass radius M*/MDM(r < rh*) (second bottom), and the cold gas fraction fgas (T < 104.5 K) also measured inside r < rh* (bottom). The colour-scale for the bottom panel is the same as for Fig. 5. |
| In the text | |
|
Fig. 7. Example of time evolution of bar length Lbar and corotation radius RCR (top) and their ratio ℛ = RCR/Lbar (bottom) for a barred galaxy of ID=333 425 at z = 0. A black dashed horizontal line marks the customary boundary of ℛ = 1.4 between relatively fast and slow bars. While the average evolution of the bar length and the corotation radius is stable, small deviations in both of them make the ratio noisy, which complicates the interpretation of the values of this parameter. |
| In the text | |
|
Fig. 8. Correlations between final-to-initial ratios of pattern speeds Ωp and bar lengths Lbar (top) and corotation radii RCR (bottom). The dashed black line in the bottom panel marks where ℛ would not change; i.e. ℛfinal/ℛinit = 1. The colour of points in the top panel indicates the mean slowing rate ⟨η⟩. The bars that slow down more lie above the ℛfinal/ℛinit = 1, which means their ℛ goes up and they also slow down in terms of ℛ. |
| In the text | |
|
Fig. 9. Correlations between final-to-initial pattern-speed ratio and the final pattern speed (top), bar length, and bar strength, measured as the maximum of the m = 2 Fourier amplitude. Red points mark cases with more irregular evolution of Ωp. Bars that have slowed down significantly tend to grow stronger and longer and have lower absolute pattern speed. |
| In the text | |
|
Fig. 10. Correlation between final-to-initial ratios of the stellar half-mass radii of the barred galaxies and the bar pattern speeds. The colour bar marks the final mass of the SMBH of those galaxies. Those galaxies where the SMBH lies above the threshold of 108 M⊙ had their AGN feedback switch to kinetic mode. We argue in the text that this correlation is at least partly a result of the AGN-feedback prescription of IllustrisTNG. |
| In the text | |
|
Fig. 11. Time evolution of gas density profiles for eight example simulated barred galaxies from TNG50-1. The IDs given in the plots are for z = 0. Vertical black dashed lines mark the bar formation times. The examples correspond to the cases from Fig. 2, where those in the top panel experienced a significant slowdown and those in the bottom panel had smaller changes in Ωp. |
| In the text | |
|
Fig. A.1. Time evolution of the pattern speed for remaining cases from our sample of barred galaxies from TNG50-1. Dashed vertical red lines indicate tAGN, as in Fig. 2 and ig. 3. |
| In the text | |
|
Fig. B.1. Plots used to determine the bar formation time for the simulated galaxy with ID=371127 at z = 0. Top row: face-on surface-density maps for five consecutive snapshots around that identified as bar-formation time (center column). Second row: face-on v̄R maps for the same snapshots. Third and fourth rows: radial profiles of the m = 2 Fourier amplitudes and phases. |
| In the text | |
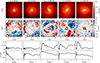 |
Fig. B.2. Same as Fig. B.1 but for the simulated galaxy with ID=494709. |
| In the text | |
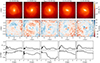 |
Fig. B.3. Same as Figs. B.1 and B.2 but for the simulated galaxy with ID=598112. |
| In the text | |
Current usage metrics show cumulative count of Article Views (full-text article views including HTML views, PDF and ePub downloads, according to the available data) and Abstracts Views on Vision4Press platform.
Data correspond to usage on the plateform after 2015. The current usage metrics is available 48-96 hours after online publication and is updated daily on week days.
Initial download of the metrics may take a while.