Open Access
Fig. 3.
Download original image
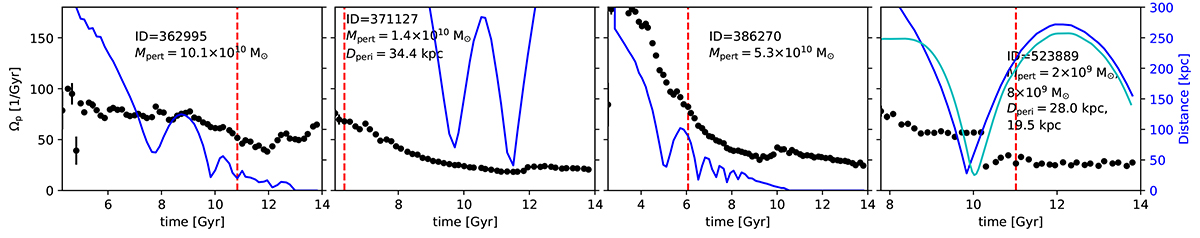
Same as Fig. 2, but for four cases with somewhat irregular pattern-speed evolution. Blue and cyan lines show the relative distance between the host barred galaxies and an impacting interacting galaxy, whose total maximal masses Mpert prior to the interaction and distance of closest approach are indicated.
Current usage metrics show cumulative count of Article Views (full-text article views including HTML views, PDF and ePub downloads, according to the available data) and Abstracts Views on Vision4Press platform.
Data correspond to usage on the plateform after 2015. The current usage metrics is available 48-96 hours after online publication and is updated daily on week days.
Initial download of the metrics may take a while.