| Issue |
A&A
Volume 691, November 2024
|
|
|---|---|---|
| Article Number | A122 | |
| Number of page(s) | 12 | |
| Section | Galactic structure, stellar clusters and populations | |
| DOI | https://doi.org/10.1051/0004-6361/202451028 | |
| Published online | 05 November 2024 | |
The redshift evolution of galactic bar pattern speed in TNG50
1
Department of Physics, Faculty of Science, Ferdowsi University of Mashhad,
PO Box 1436,
Mashhad,
Iran
2
School of Astronomy, Institute for Research in Fundamental Sciences (IPM),
19395-5531
Tehran,
Iran
3
Instituto de Astrofísica de Canarias,
Calle Vía Láctea s/n,
38205
La Laguna,
Tenerife,
Spain
4
Departamento de Astrofísica de la Universidad de La Laguna,
Av Astrofisíco Francisco Sánchez s/n,
38205
La Laguna,
Tenerife,
Spain
5
Instituto de Astronomía y Ciencias Planetarias, Universidad de Atacama,
Avenida Copayapu 485,
1350000
Copiapó,
Chile
6
Department of Physics and Astronomy, University of Western Ontario,
London,
Ontario
N6A 3K7,
Canada
★ Corresponding author; This email address is being protected from spambots. You need JavaScript enabled to view it.
Received:
7
June
2024
Accepted:
3
September
2024
Abstract
In this paper, the redshift evolution of the galactic bar properties, like the bar length, pattern speed, and bar fraction, has been investigated for simulated galaxies at stellar masses of M* > 1010 M⊙ in the cosmological magnetohydrodynamical simulation TNG50. We focus on the redshift evolution of the bar pattern speeds and the fast bar tension. We show that the median value of the pattern speed of the bars increases as the redshift grows. On the other hand, although the median value of the bar length increases with time, the ratio between the corotation radius and the bar radius - namely, the 𝓡 = RCR/Rbar parameter - increases as well. In other words, the corotation radius increases with a higher rate than the bar length. This directly means that galactic bars slow down with time, or equivalently as the redshift declines. We discuss the possible mechanisms that reduce the pattern speeds in TNG50. We demonstrate that while mergers can have a significant impact on a galaxy’s pattern speed, they do not play a crucial role in the overall evolution of mean pattern speed within the redshift range ɀ ≤ 1.0. Furthermore, we show that the 𝓡 parameter does not correlate with the gas fraction. Consequently, the existence of gas in TNG50 does not alleviate the fast bar tension. We show that the mean value of the pattern speed, computed for all the galaxies irrespective of their mass, at ɀ = 1.0 is Ωp = 70.98 ± 2.34 km s−1 kpc−1 and reduces to Ωp = 33.65 ± 1.07 km s−1 kpc−1 at ɀ = 0.0. This is a direct prediction by TNG50 that bars at ɀ = 1.0 rotate faster by a factor of ~2 compared to bars at ɀ = 0.0.
Key words: galaxies: evolution / galaxies: kinematics and dynamics / galaxies: spiral / galaxies: structure
© The Authors 2024
 Open Access article, published by EDP Sciences, under the terms of the Creative Commons Attribution License (https://creativecommons.org/licenses/by/4.0), which permits unrestricted use, distribution, and reproduction in any medium, provided the original work is properly cited.
This article is published in open access under the Subscribe to Open model. This email address is being protected from spambots. You need JavaScript enabled to view it. to support open access publication.
1 Introduction
The appearance of galactic stellar bars is directly related to the collective motion of stars on x1 orbits in the inner parts of the galactic disk (Contopoulos 1980; Athanassoula 1992; Sellwood 2014b). This could happen during the bar instability when the propagation of density waves within the surface of the disk undergoes swing amplification. It is well understood that the formation and evolution of the bars are directly influenced by the dark matter halo. Whereas the dark matter halo, in the first place, was introduced to suppress bar instability (Ostriker & Peebles 1973), it is still true that the live dark matter halo stabilizes the submaximal disks and prevents bar formation by reducing the relative strength of the disk’s self-gravity. Recently, in Kashfi et al. (2023), it has been shown that even in the cosmological hydrodynamic simulation TNG50, in which several baryonic feedbacks are included, the submaximal subhalos suppress the bar formation. This seems to conflict with the barred galaxies in the SPARC database (Lelli et al. 2016). Interestingly, in maximal and marginally submaximal disks the situation is completely different, and the existence of a spherical live halo can even trigger the bar instability by exchanging angular momentum with the disk (Athanassoula 2002). The bar formation is a complex galactic process, anyway, that depends not only on the dark matter halo but on the gas fraction of the disk, and how hot or cold the disk is (Athanassoula et al. 2013).
The pattern speed is affected by the dark matter halo as well. The dynamical friction caused by the dark matter particles slows down the pattern speed of the bar. This fact has been reported in both theoretical investigations (Weinberg 1985) and N-body galactic simulations (Debattista & Sellwood 2000). On the other hand, cosmological simulations are the best place to investigate this issue in the sense that they provide a more realistic situation for galaxy formation and evolution. On the other hand, since there are usually many galaxies formed within these simulations, a more reliable statistical description can be provided. The majority of bars in EAGLE and Illustris cosmological simulations are “slow” (Algorry et al. 2017; Peschken & Łokas 2019). By a slow bar, we conventionally mean that the ratio between the corotation radius and the bar radius - namely, the 𝓡 = RCR/Rbar parameter - is larger than 1.4 (𝓡 > 1.4). Similarly, “fast” bars are defined as bars with 𝓡 < 1.4.
In addition, the direct comparison between cosmological simulations like EAGLE and IllustrisTNG and the bar pattern speed observations has quantified a serious tension for the standard cosmological ΛCDM model (Roshan et al. 2021b). To be specific, galactic bars at a redshift of ɀ = 0.0 in the cosmological simulations EAGLE and IllustrisTNG are mostly slow, whereas almost all the observed galactic bars are fast (Cuomo et al. 2020). The tension exceeds 5σ. However, it is necessary to mention that the pattern speed of 225 barred galaxies has recently been measured by Géron et al. (2023). They found that 62% of the bars in their sample are slow. Although this decreases the fast bar tension with ΛCDM, the 𝓡 parameter appears with large errors (see Table 3 in Géron et al. (2023)).
It is interesting to mention that although there are differences in physics implementations in the FIRE2 (Feedback in Realistic Environments) cosmological simulation compared to EAGLE and IllustrisTNG, the same tension appears in FIRE2 as well. In Ansar et al. (2022), the pattern speed of the 13 high-resolution Milky-Way-mass galaxies from the zoomed-in simulation FIRE2 has been studied. There are six galaxies with a well-measured 𝓡 parameter. They are all slow in the sense that 𝓡 > 1.4. Although the fact that bars are slow in large-box ΛCDM cosmological simulations remains challenging, the situation with the Auriga zoom-in simulation (Grand et al. 2017) seems to be different. Using this simulation, Fragkoudi et al. (2021) finds bars that remain fast. However, the cost is that bars should grow in galaxies that have higher stellar-to-dark matter ratios. In other words, host galaxies violate the commonly used abundance matching relation in the sense that they are more baryonic-dominated systems.
The fast bar tension may put strict constraints on the properties of dark matter particles. For example, to alleviate this tension, it might be better to postulate dark matter particles that do not lead to a substantial amount of dynamical friction. From this perspective, the ultra-light axion seems to be a good candidate (Hui et al. 2017). However, there are other observational problems with this candidate (see Rogers & Peiris (2021) for further details).
The dynamical friction has been introduced as the origin of the discrepancy (Roshan et al. 2021b). If so, then the pattern speed of the galaxies must increase as redshift grows. There is another possibility, that the bars are slow at higher redshifts as well and remain slow until the present time. In this case, the dynamical friction originating from dark matter particles is not responsible for the slowness of the bars at ɀ = 0.0. To better understand this issue, it is necessary to study the simulated galactic bars at higher redshifts. This is the main purpose of this paper. To do so, we study barred galaxies at stellar masses of M* > 1010.0 M⊙ in TNG50 (Nelson et al. 2019b,a; Pillepich et al. 2019) at redshifts of ɀ = 0, 0.5, and 1. We restrict ourselves to ɀ ≤ 1 because the median bar formation redshift is ≲1 in TNG50 (Izquierdo-Villalba et al. 2022). It might be useful to mention that the age of the Universe at ɀ = 1.0 (ɀ = 0.5) is ≈5.9 Gyr (~8.6 Gyr). From an observational standpoint, it should be mentioned that the only attempt so far to measure the pattern speed as a function of time is Pérez et al. (2012). In this paper, the stellar rings are used as tracers of resonances. Doing this, the bars appear to be fast up to redshift about 0.5.
The outline of the paper is as follows. In Sect. 2, we first discuss our galaxy sample selection rules, then we briefly discuss all the methods used to measure the bar length, strength, pattern speed, and corotation radius. In Sect. 3, we present the results and discuss the redshift evolution of the pattern speed. Furthermore, we discuss the possible mechanisms that slow down the bars. Finally, our conclusions are presented in Sect. 4.
2 Methods
In this section, we describe the methods implemented to select the galaxy sample, to measure the bar length, strength, and pattern speed. The methods are similar to those in Roshan et al. (2021b), to which we refer the reader to more details and references.
2.1 Selecting the galaxy sample
Our sample includes galaxies with a stellar mass of M* > 1010 M⊙ . To select the barred galactic disks, we need to use an explicit definition for the disk. First, we computed the direction of the total angular momentum vector for the stellar particles within the stellar half-mass radius. We set the ɀ axis in this direction, and applied two additional widely used criteria to select the disks: i) krot ≥ 0.5 and ii) F ≤ 0.7, where krot is a measure of the fraction of rotational kinetic energy to the total kinetic energy. To be specific, it is defined as the mass-weighted mean value of  within 30 kpc, where v is the total velocity and vφ is the azimuthal velocity for each stellar particle. On the other hand, the morphological flatness parameter, F , is defined as
  , where Mi are the eigenvalues of the moment of inertia tensor sorted as M1 ≤ M2 ≤ M3.
2.2 Bar strength measurement
To identify the barred galaxies, we computed the m = 2 azimuthal Fourier component of the mass distribution of the disk. We considered all the disk particles with |ɀ| < 1 kpc and projected all of them on the x − y plane. We divided the projected disk into annuli with a fixed width of δr = 0.1 kpc and computed the following Fourier coefficients:
 (1)
(1)
 (2)
(2)
where N is the number of particles in the annulus, R is the mean cylindrical radius of the annulus, and M is the total mass of the particles inside the annulus. Each particle is labeled by the index, k, with mass, mk, and azimuthal angle, ψk. In this way, the Fourier amplitude for the mode, m, at the radius, R, is defined as
 (3)
(3)
On the other hand, A0 = 0.5 (Ohta et al. 1990; Aguerri et al. 2000). When an m = 2 symmetric-feature-like bar exists in the disk, this function normally has an evident maximum (see the upper left panel in Fig. 1 for Galaxy ID 21 in TNG50 at ɀ = 1.0). This maximum value is taken to define the bar strength,
![Mathematical equation: $A_2^{\max } \equiv \max \left[ {{A_2}(R)} \right].$](/articles/aa/full_html/2024/11/aa51028-24/aa51028-24-eq6.png) (4)
(4)
Bars are commonly divided into two categories: strong bars with  , and weak bars with
  . On the other hand, disks with
  are unbarred.
2.3 Bar length measurement
To measure the bar length, we used the Fourier decomposition of the surface density (Aguerri et al. 2000). We first computed the intensity in the bar (Ib) and inter-bar (Iib) zones, and found the following ratio as a function of the radius, R:
 (5)
(5)
Finally, the semi-major axis of the bar is the outer radius beyond which ℑ (R) < (ℑmax + ℑmin) /2, where ℑmax and ℑmin are the maximum and minimum values of ℑ (R), respectively. The bar length is twice the semi-major axis (see the upper right panel in Fig. 1). We take δr = 0.1 kpc as the error of the bar length.
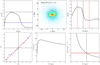 |
Fig. 1 Properties of Galaxy ID 21 in TNG50 at ɀ = 1.0 as a representative. The upper left panel shows A2(R). The dashed horizontal line indicates |

2.4 Pattern speed measurement
In the isolated simulations in which the full-time evolution of the disk is accessible, one can easily measure the pattern speed by finding the bar position angle in terms of time. However, here we have a single snapshot of the galaxies. Therefore, we need to treat them like real galaxies, for which the Tremaine–Weinberg method (TW) (Tremaine & Weinberg 1984) is widely used to measure the pattern speed. To use this method in simulations, we need the surface density, Σ, the line-of-sight velocity, VLOS, and the positions of the particles or stars, and the inclination angle, i, of the galaxy. The pattern speed, Ωp, is then Ωp sin i = 〈V〉/〈X〉, where
 (6)
(6)
 (7)
(7)
〈V〉 and 〈X〉 are the so-called kinematic and photometric integrals, defined as the luminosity-weighted average LOS velocity, VLOS, and position, X, parallel to the major axis of the particles or stars, respectively. The integrals are taken along slits parallel to the disk’s major axis. We take Ns evenly spaced slits with length, ls, and width, Δs. Slits are distributed only in the bar region specified with the height, hs . More specifically, hs is identical to the projection of the bar length along the minor axis of the disk. We started with the face-on view of the galaxy and set the position angle of the bar at 60° relative to the major axis of the disk. Then we rotated the galaxy and fixed it at an inclination angle of i = 45°. Finally, we started with a fixed set of (Ns, Δs, hs) and varied the slit length, ls, until the pattern speed converges on a unique value.
Linear regression on 〈V〉 and 〈X〉 was used to find the slope, Ωp (see the lower left panel in Fig. 1). The standard error of the regression is defined as the error on Ωp . We then repeated the process, taking different sets of (Ns , Δs , hs). In this way, we were able to make several estimates of the pattern speed. Finally, the mean value of the pattern speed is our final Ωp. On the other hand, the largest deviation from the mean is taken as the error of Ωp. In some cases, the error exceeds 20%. We removed those cases to achieve reliable values for the pattern speeds. The reliability of our TW code has already been tested in Roshan et al. (2021b). To be specific, a galaxy was simulated using the GALAXY code (Sellwood 2014a) for which the pattern speed evolution is accurately known, then our TW code was used to compute the time evolution of the pattern speed. A full comparison has been presented in Roshan et al. (2021b) and implies that the code works reliably.
It is worth noting that a more accurate method of measuring pattern speeds in simulations has recently been introduced in Dehnen et al. (2023). This method utilizes all the position and velocity information of the particles, not just the line-of-sight velocity. Applying this new method to measure pattern speeds in cosmological simulations would be the subject of another study. Here, we adhere to the TW method, since we treat simulated galaxies as real galaxies, for which we only have the line-of-sight velocity.
2.5 Corotation radius measurement
To find the corotation radius, RCR, where Ωp = Ω(RCR), we need the rotation curve, vc(R), of the galaxy. Ω(R) is the angular velocity of the disk defined as vc(R) = RΩ(R). One of the widely used methods to obtain the rotation curve in cosmological simulations is to measure the total mass within the radius, R; namely, M(R). This mass contains all the mass contributions from baryonic matter and dark matter. Then the rotation curve is simply estimated as
 (8)
(8)
In this way, the radius at which the bar pattern speed intersects with vc/R indicates the corotation radius. It should be noted that the error in the pattern speed leads to an error in the corotation radius. One may use the particle accelerations to find a more accurate circular velocity,  , obtained by computing the particle accelerations. However, Eq. (8) recovers
  at R > 2 kpc with an accuracy better than 4% (Roshan et al. 2021b). Since most of the galaxies in TNG50 have RCR > 2 kpc, vc given by Eq. (8) is a suitable choice to locate the corotation radius.
3 Results
Before discussing the results, it is important to emphasize that while we have attempted to apply techniques used in observations, there are significant differences in their application to simulated and real galaxies. For instance, in simulated galaxies, we were able to accurately measure the disc position and inclination angles, which is not the case in observations, introducing unavoidable sources of errors there.
We summarise the bar statistics in Table 1. Our selection method shows that the number of disk galaxies grows with time. This is consistent with the results of Rosas-Guevara et al. (2022), while different selection methods are used. The number of barred disks increases from ɀ = 1.0 to ɀ = 0.5. On the other hand, from ɀ = 0.5 to ɀ = 0.0, the number of barred disks decreases by about 10%. This higher-rate reduction is also reported in Rosas-Guevara et al. (2022). Accordingly, the total bar fraction – namely, the ratio of the number of barred disks to the total number of the disk galaxies - is almost constant in 0.5 < ɀ < 1.0. At this redshift interval, 50% of the disks are barred. However, this fraction reduces to 42% at ɀ = 0.0. Anyway, we see that the bar fraction increases with redshift. The same trend has been reported in Rosas-Guevara et al. (2022) for TNG50.
It should be noted that in isolated simulations there is a common feature almost always seen in maximal disks: after the bar instability, the buckling of the disk reduces the strength of the bar. However, at longer evolution times, the interaction between the halo and the disk increases the strength of the bar. Therefore, we do not expect the bar to gradually fade away in the isolated simulations. Consequently, the reduction in the number of barred galaxies in TNG50 must be related to cosmological features like the interaction between galaxies, mass accretion, and implemented baryonic feedback.
Bar statistics in TNG50 at different redshifts.
3.1 Bar fraction in TNG50
The redshift evolution of the bars in galaxies provides information about the time at which the rotation dominates the dynamics of the galaxies (Sheth et al. 2012). Moreover, it would be interesting to measure the bar fraction, fbar, in terms of the stellar mass of the galaxies. In this way, it would be easier to compare TNG50 with the results of other simulations and with the relevant observations. We performed the bar analysis for ɀ = 0.0, ɀ = 0.5, and ɀ = 1.0 for galaxies in the stellar mass range M* ≳ 1010 M⊙. It can be seen in Fig. 2 that the bar fraction is strongly correlated with the stellar mass of the galaxy.
On the other hand, for galaxies with masses of M* ≲ 1010.6 M⊙, the bar fraction dramatically decreases with time. In contrast, for galaxies with M* ≳ 1010.6 M⊙, there is no smooth behavior in terms of redshift. As an example, for M* ≃1010.7 M⊙ the bar fraction reaches from about 60% at ɀ = 1.0 to about 75% at ɀ = 0.0.
From an observational standpoint, all of the observations agree that the fraction of bar galaxies in our local Universe must be high (Eskridge et al. 2000; Whyte et al. 2002; Laurikainen et al. 2004; Menéndez-Delmestre et al. 2007; Marinova & Jogee 2007; Barazza et al. 2008; Sheth et al. 2008; Aguerri et al. 2009; Nair & Abraham 2010; Masters et al. 2012; Melvin et al. 2014; Díaz-García et al. 2016). Meanwhile, there is always a debate about the dependence of the fraction of barred galaxies on the stellar mass. Most SDSS-based studies suggest that the bar fraction increases strongly for M∗ ≳ 1010 M⊙ (Masters et al. 2012; Oh et al. 2011; Melvin et al. 2014). Contrary to these results, Erwin (2018) reports that for a sample of nearby galaxies (ɀ ≲ 0.01) in the S 4G survey, the bar fraction reaches a maximum of about 76% for M* = 109.7 M⊙ from 20% for galaxies with low stellar mass (M* = 108 M⊙) and then in M* = 1011 M⊙ decreases again to 40%. Erwin (2018) explains the inconsistency between the S 4G survey results and the SDSS studies by saying that it is probably caused by the inefficiency of the SDSS studies in identifying small bars at low stellar masses ≲1010 M⊙.
In contrast to the nearby Universe, measuring the bar fraction at higher redshifts is more difficult due to the lack of sufficient resolution and band-shifting (Sheth et al. 2003). But today, thanks to high-resolution observations of the deep visible and near-infrared regions, we know that the fraction of barred galaxies decreases with redshift (Sheth et al. 2008; Cameron et al. 2010; Melvin et al. 2014; Simmons et al. 2014). It should be noted that these studies were carried out at higher redshifts on galaxies with stellar masses higher than 1010 M⊙. However, we see in Fig. 2 that for a wide mass interval of 1010 M⊙ ≲ M* ≲ 1010.6 M⊙ the bar fraction increases with redshift.
It is necessary to mention that our results are in relatively good agreement with that of Rosas-Guevara et al. (2020), Zhou et al. (2020), Zhao et al. (2020), Rosas-Guevara et al. (2022) and Reddish et al. (2022). In the first three works, the bar evolution is investigated in TNG100 simulation. The results by Rosas-Guevara et al. (2020) show that the bar fraction at ɀ = 0.0 with a mass range of 1010.4–11 M⊙ increases with increasing stellar mass. Also, Zhou et al. (2020) made a comparison between the evolution of the bars in Illustris and TNG100 simulations. They found that in both of these simulations, the bar fraction increases with stellar mass for M* ≳ 1010.5 M⊙. In the same line, Zhao et al. (2020) investigated TNG100 galaxies with stellar masses of M∗ ≳ 1010 M⊙ and found the bar fraction increases with stellar mass.
All of these simulations seem to be in conflict with observations reported in Erwin (2018). Zhou et al. (2020) argue that this discrepancy between simulations and observations is due to the low resolution of TNG100 and its inability to identify bars with smaller radii, and also that observations have difficulty in identifying such short bars at high redshifts. However, we see that the same disagreement exists in TNG50, where the resolution is much higher.
To conclude this section, we shall mention that the bar fraction discrepancy appears to exist in all of the cosmological simulations (in the case of EAGLE simulations, see Roshan et al. (2021a), and for the NewHorizon simulation, see Reddish et al. (2022)). It is important to note that the discrepancies between the observed and simulated bar fractions may be attributed to the manner in which the bars are chosen. In observations, bars are selected from non-axisymmetric characteristics in images of disk galaxies. Conversely, in simulations, the selection process is based on dynamical features that take into consideration the galaxy’s rotation. Thus, it is possible that the simulations may be selecting galaxies that are not detectable in observations. As was previously mentioned, the resolution of the SDSS is not sufficient to resolve bars in low-mass galaxies. Therefore, the observational bar fraction is underestimated for such galaxies. This limitation also applies to other surveys. However, recent work with the James Webb Space Telescope (JWST) has shown that bars longer than 1.3 kpc at ɀ ∼ 1–3 can be identified by JWST (Guo et al. 2023) . This implies that future observations by JWST would give significantly higher bar fractions than previous Hubble Space Telescope (HST) studies. Investigating this possibility is beyond the scope of this paper. However, we have conducted a quick test by removing very short bars (Rbar < 2 kpc) that are difficult to classify as bars in observations, and then recalculating the bar fraction. The resulting plot is shown in the inset of Fig. 2. As was expected, the bar fraction decreases for all stellar masses and approaches the observations at ɀ = 0.0, at least for massive galaxies. Furthermore, the bar fraction clearly decreases with ɀ for stellar masses greater than ≈1010.5 M⊙.
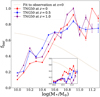 |
Fig. 2 Bar fraction vs. stellar mass at ɀ = 0.0, ɀ = 0.5, and ɀ = 1.0 in TNG50. The dashed curve indicates the fit to observations given in Erwin (2018). We have taken this curve from Zhao et al. (2020). The binomials errors on the bar fractions are defined using the bar fraction and the number of total disks, i.e., ndisk, in each mass interval bin as |

3.2 Bar radius in TNG50
We have measured the bar radius in terms of stellar mass and illustrated it in Fig. 3. The solid lines display the median value and the shaded areas give the 32th- 68th percentile. As we can see, the bar length increases towards ɀ = 0.0. This is also shown in Table 2, where the mean value of the bar radius is given in terms of redshift (the mean bar length increases by ~30% from ɀ = 1.0 to ɀ = 0.0). This is quite consistent with the bar length measurement for TNG50 reported in Rosas-Guevara et al. (2022), where the median bar length grows from ≃1.8 kpc at ɀ = 1.0 to ≃2.6 kpc at ɀ = 0.0. From Fig. 3, we see that the bars are slightly longer in less massive galaxies at redshift ɀ = 1.0. However, for other redshifts, there is no tangible correlation between the bar length and stellar mass. Therefore, there are two main features in our bar length measurement: i) the mean bar length increases towards ɀ = 0.0. This is somehow consistent with the results of Zhao et al. (2020), in which barred galaxies of the cosmological simulation TNG100 were investigated. They found that the bar sizes have grown from ~2 kpc at ɀ = 1.0 to ~3 kpc at ɀ = 0.0. ii) There is no clear correlation between the bar length and the galaxy stellar mass.
Both features seem to conflict with observations. To perform a consistent comparison with observations in the local Universe, we defined a sample of barred galaxies at ɀ < 0.1, with a stellar mass range comparable with our simulations, and for which the bar and galaxy properties (bar length, strength, and pattern speed and general properties) have been derived with the same approaches adopted here and described in Sect. 2. We adopted the results presented by Cuomo et al. (2020), where a sample of 77 barred galaxies were analysed. From their sample, we considered only the subsample of galaxies, also included in the CALIFA (Sánchez et al. 2012) and MaNGA (Bundy et al. 2015) surveys, for which stellar mass estimates are available and provided by Bitsakis et al. (2019) and Sánchez et al. (2022), for the CALIFA and MaNGA surveys, respectively. Therefore, we refer to the CALIFA+MaNGA sample in the following discussions, which include 60 barred galaxies with stellar masses >1010 M⊙that satisfy the condition ΔΩp/Ωp ≤ 0.5. Figure 3 shows the observed bar lengths with respect to the galaxy stellar mass. At ɀ = 0.0, a strong correlation between these two properties is observed. Moreover, observed bars are much larger than the simulated bars studied here at ɀ = 0.0, regardless of the stellar mass.
This problem with bar sizes in TNG50 has also been reported by Frankel et al. (2022). This paper compares the distribution of the bar size in TNG50 at ɀ = 0.0 to those from MaNGA observations. Frankel et al. (2022) found that the galactic bars in TNG50 are on average 35% shorter compared to MaNGA observations. The mean value of the bar radius obtained by Frankel et al. (2022) is consistent with our result.
The comparison with other observational studies reveals further conflicts with the results obtained here. As an example, the redshift evolution of 379 barred galaxies at 0.2 < ɀ ≤ 0.835 with  from the COSMOS survey has been investigated in Kim et al. (2021). The observed bar lengths and strengths do not show any clear trend with ɀ and remain roughly constant for the whole redshift interval. On the other hand, the observed bar lengths are strongly correlated with the stellar mass of the host galaxy. Similarly, Erwin (2019) found that although for less massive galaxies (
 ) the bar length is almost independent of the stellar mass, for massive galaxies (
 ) the bar length strongly depends on the stellar mass.
In conclusion, the scaled bar radius is depicted in Fig. 4 in the case of observations and TNG0 at ɀ = 0.0. We utilized the Petrosian radius, Rp, as a reference for the radial size of galaxies in both simulations and observations, scaling the bar length relative to the Petrosian radius. The Petrosian radius is the radius at which the intensity equals η times the average intensity. Rp is provided by the SDSS in the r band, and has been collected for the CALIFA + MaNGA sample in Cuomo et al. (2020). In TNG50, we find Rp using the following relation:
 (9)
(9)
Here, Σ(R) represents the stellar surface density derived from projecting the disk stellar particles onto the disk plane, M(R) denotes the stellar mass enclosed within the radius, R, and η was set to 0.2. As one may anticipate, Fig. 4 illustrates that this scaled bar radius is greater in observations than in TNG50.
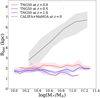 |
Fig. 3 Solid lines displaying the median value of the bar radius in kiloparsecs vs. stellar mass for TNG50 at ɀ = 0.0, ɀ = 0.5, and ɀ = 1.0 and for the observed CALIFA+MaNGA sample at ɀ ≃ 0.0. We have included 20 additional galaxies from CALIFA and MaNGA that do not meet the condition ΔΩp/Ωp ≤ 0.5 but satisfy ΔRbar/Rbar ≤ 0.5. The shaded areas give the 32th– 68th percentile. We only display mass bins that include more than five galaxies. We plot the same regions for other similar figures in this paper. |
Mean bar properties at different redshifts.
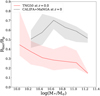 |
Fig. 4 Solid lines displaying the median value of the scaled bar radius, Rbar/Rp, vs. stellar mass for TNG50 at ɀ = 0.0 and for the observed CALIFA+MaNGA sample at ɀ ≃ 0.0. Rp is the Petrosian radius used as an indicator for the radial size of the galaxies. |
3.3 Pattern speed, Ωp, in TNG50
The main purpose of this paper is to investigate the redshift lution of the bar pattern speed. In Roshan et al. (2021b), it has been shown that the bars are slow in IllustrisTNG and EAGLE at ɀ = 0.0 compared to observations. More specifically, the tension between simulations and observations exceeds 5σ. In that work, the origin of this tension is blamed on the existence of dynamical friction caused by dark matter particles. Along the same lines Algorry et al. (2017) and Peschken & Łokas (2019) report bars are slow in EAGLE and Illustris, respectively.
However, by looking only at the single redshift ɀ = 0.0, it is not possible to conclude that the bars were fast in higher reds and got slow due to dynamical friction. In other words, it m be possible that the pattern speed remains constant with t In this case, the meaning of the above-mentioned tension would change. To be specific, the parameter 𝓡 = RCR/Rbar, the ratio of the corotation radius to the bar radius, is widely used to specify the “speed” of the bars. If 𝓡 < 1.4, then the bar is fast; otherwise, it is slow. Now, if the pattern speed remains constant with time and with the restrictive assumption that the rotation curve not evolve with time, then the corotation radius does not change. In this case, having large values for 𝓡 may be directly related to the size of the bars. In other words, the bars can rotate with a normal pattern speed, Ωp, while the bar is too short. Therefore, the 𝓡 parameter would be large, while the dynamical friction plays no role. This is the possibility that has recently been raised by Frankel et al. (2022). This behavior is seen for bars in high-resolution zoom-in cosmological simulations stu Bi et al. (2022). These simulations deal with very gas-rich galaxies. On the other hand, although the 𝓡 parameter is large bars are classified as being slow, there is no monotonic in the bar pattern speed. The bars appear to be too short simulations as well. However, In the case of TNG50, as show, such behavior does not appear and the pattern speeds do not stay constant.
It should be stressed that it is essential to understand gin of the tension. If the bar speed tension were relate dynamical friction of the dark matter halo, then this would be a serious challenge to the viability of the current dar paradigm. This means that either different types of dar particles should be postulated (Hui et al. 2017) or new physics is required to address the tension (Roshan et al. 2021a).
Now, we shall discuss our result. The median value of the pattern speed in terms of stellar mass at different red illustrated in Fig. 5. On the other hand, the mean value of the pattern speed for all the barred galaxies is given in Table 2. It is remarkable that the TW method works for 84%, 88%, a of barred galaxies at ɀ = 1.0, ɀ = 0.5, and ɀ = 0.0, respectively (see Table 1). The TW method does not lead to reliable results for galaxies that host extra features like rings, spirals, or tidal companions. In some cases, we have elongated bulges instead of rotating bars. Therefore, the TW method does not work for them.
We see that at ɀ = 1.0, the mean pattern speed is around  km s−1 kpc−1. It decreases by a factor of more than 50% and reaches
  km s−1 kpc−1 at redshift ɀ = 0.0. We can see from Fig. 5 that at redshift ɀ = 1.0, the pattern speed is strongly correlated with the stellar mass in the sense that for M* ≲ 1011 M⊙ more massive galaxies have higher pattern speeds. The same behavior is more or less seen in the middle redshift, ɀ = 0.5. However, at ɀ = 0.0 there is no specific trend. This is interesting in the sense that regardless of how fast the bars were in the past, and irrespective of the stellar mass of the host galaxy, they reach almost the same mean value at ɀ = 0.0. On the other hand, observed galaxies in the local Universe seems to show a weak trend, where low-mass galaxies have higher values of Ωp (but a slight increase in Ωp is observed in the high-mass regime). This is not observed in the simulated galaxies at ɀ = 0.0, while the opposite trend is observed in simulated galaxies at ɀ = 1.0.
It is also interesting to see the behavior of the 𝓡 parameter in terms of stellar mass. The dashed blue line in Fig. 6 indicates the border between fast and slow bars; that is, 𝓡 = 1.4. For ɀ = 1.0 and ɀ = 0.5, there is no specific correlation between 𝓡 and the stellar mass. However, at ɀ = 0.0, massive galaxies seem to have higher values of 𝓡. The mean value of the 𝓡 parameter for all the barred galaxies with a reliable pattern speed in each redshift is given in Table 2. We can see that the mean value increases with time. From this perspective, we confirm the results of Algorry et al. (2017) for the EAGLE simulation. We reiterate that although in TNG50 the bar size increases with time, the corotation radius increases at a higher rate. On the other hand, most of the observed bars at ɀ = 0.0 are slow.
In Fig. 7, we have shown the corotation radius in terms of the bar radius. The color bar indicates the strength of the bars. Each data point corresponds to a barred galaxy. Although at ɀ = 1.0 all the points are concentrated in the lower left corner of the plot, they expand in the horizontal and vertical directions at lower redshifts. We can see that the strong bars are longer and also slower at lower redshifts. This is natural in the sense that strong bars distribute angular momentum more effectively, and consequently experience higher dynamical friction torque. It is clear that bars increase their length and strength with time, while they decrease their bar pattern speed.
From an observational standpoint, Fig. 7 confirms that bars observed in the local Universe are slow. The distribution of TNG bars differs from observed bars in the RCR-Rbar plane. While TNG bars cover the same range of values in the RCR axis as observed bars, they do not replicate the observed bars in the Rbar axis. The TNG bars are much smaller in size.
However, the high-redshift bar pattern speed observations are poor, so at the moment it is not possible to compare TNG50’s prediction, that bars have much higher Ωp at higher redshifts, to the observations. In particular, no TW measurements of Ωp have been performed for galaxies at z > 0.1 (Cuomo et al. 2020).
However, Pérez et al. (2012) derived the bar rotation rate from the location of the bar resonances in a sample of 44 low-inclination ringed galaxies from the SDSS and COSMOS surveys covering the redshift range 0 < ɀ < 0.8. Their results imply that there is no evolution of the bar rotation rate with redshift. From this perspective, the redshift evolution of the bar pattern speeds in TNG50 seems to conflict with the current observation. However, acquiring more precise observational data is essential to support the discrepancy between observations and simulations regarding the evolution of the bar pattern speed.
Finally, the fast bar tension in ΛCDM is not just because bars are too short in TNG50, as is argued in Frankel et al. (2022). The problem is twofold in the sense that the corotation radius increases with time as well. We mean that the corotation radius is smaller at higher redshift. Equivalently, the pattern speeds strongly evolve with time in TNG50. This is not consistent with the current observations.
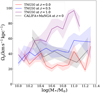 |
Fig. 5 Solid lines displaying the median value of the bar pattern speed vs. stellar mass for TNG50 at different redshifts, ɀ = 0.0, ɀ = 0.5, and ɀ = 1.0, and for the observed CALIFA + MaNGA sample at ɀ ≃ 0.0. There are 60 galaxies in this sample with ΔΩp/Ωp ≤ 0.5 that are included in this figure. |
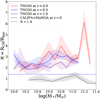 |
Fig. 6 Solid lines displaying the median value of the 𝓡 parameter vs. stellar mass for TNG50 at different redshifts, ɀ = 0.0, ɀ = 0.5, and ɀ = 1.0, and for the observed 60 galaxies with ΔΩp/Ωp ≤ 0.5 in the CALIFA + MaNGA sample at ɀ ≃ 0.0. |
3.4 The impact of the gas fraction on pattern speeds
It would be interesting to discuss the role of the gas fraction in the evolution of the pattern speed. In simulations without gas, the bar length and strength increases and 𝓡 goes in the slow regime because of the dynamical friction. In this case, the corotation radius is expected to increase faster than the bar length (Debattista & Sellwood 2000). When gas is present, the situation can be much complex. Since gas is dynamically highly responsive, it can readily alter the matter distribution across the disk and influence the evolution of the bar. Several studies have utilized smoothed hydrodynamics simulations to investigate the impact of gas on stellar bars in isolated galaxies (Fux 1999; Bournaud et al. 2005; Berentzen et al. 2007; Athanassoula et al. 2013; Seo et al. 2019). It is well established that the presence of gas weakens the bar, influencing its secular evolution. The gas component may affect the angular momentum transfer by the bar as well. By performing a simulation of a Milky-Way-like galactic disk hosting a strong bar, it has been shown by Beane et al. (2023) that a small fraction of gas can stabilize the pattern speed and prevent it from slowing down. However, the 𝓡 parameter remains constant throughout the simulation at approximately 𝓡 ≃ 1.6. This indicates that the bar is marginally situated within the slow bar regime1. Therefore, it is not possible to infer if the problem is addressed. As was already mentioned, Bi et al. (2022) also deal with some gas-rich galactic simulations and find fluctuating pattern speeds that do not slow down with time. However, the 𝓡 parameter is high, implying that bars are slow.
To see the impact of the gas fraction on the bar rotation rate in TNG50, we have plotted the 𝓡 parameter in terms of the gas fraction, fg = Mg/M*, in Fig. 8 for different redshifts. This fraction was computed within twice the half-mass radius of the stellar disk (Kauffmann et al. 2019). If the gas fraction is important, then the 𝓡 parameter should be smaller for higher gas fractions. We do not find such a trend in any of the redshifts. In fact, we even observe a rising trend in 𝓡 at higher gas fractions at ɀ = 0.0 and ɀ = 1.0. As is shown in Table 2, 93% of the barred galaxies are slow at ɀ = 0.0. This implies that the presence of gas in the TNG50 simulation does not alleviate the fast bar tension.
As a final remark in this subsection, we shall mention that Garma-Oehmichen et al. (2020) found that the 𝓡 parameter is positively correlated with the gas fraction. In other words, galaxies with a higher gas fraction host bars with higher 𝓡 in a small sample of galaxies chosen from MaNGA SDSS-IV and CALIFA. A weaker correlation is reported in Garma-Oehmichen et al. (2022) for a larger sample of Milky Way analog galaxies. Anyway, we do not see such a correlation in TNG50.
3.5 The impact of merging on pattern speeds
As was already mentioned, although the main reason for decreasing pattern speeds would be the dynamical friction of the dark matter halos, it is necessary to explore the impact of other potential players like merging between the galaxies. Of course, it should be noted that the merging rate between galaxies is influenced by the amount of dynamical friction between them. Anyway, the merger tree of the TNG50 simulation constructed with the SUBLINK algorithm (Rodriguez-Gomez et al. 2015) can be used to shed light on the significance of the merging. For this purpose, one can walk back in time through the available tree for each galaxy to find when and how many times it has experienced a merger event. As is usually done, mergers can be classified according to the stellar mass ratio of the two interacting galaxies at the time of merging. This time is defined as when the secondary galaxy reaches its maximum stellar mass. Here, we have divided the barred galaxies at ɀ = 0.0 that have reliable pattern speed into two groups. The members of the first group have a rich merging history with the stellar mass ratio >1/10 in the redshift interval ɀ ≤ 1. The members of the second group have no significant merging with the stellar mass ratio >1/10 in redshifts ɀ ≤ 1. This was done using the catalog provided by Sotillo-Ramos et al. (2022) and Eisert et al. (2023), in which they applied additional checks to clean the trees from non-cosmological cases or spurious flyby and re-merger events. We should also add that we used a version of this catalog in which merging with very small galaxies of no more than 50 stellar particles is ignored.
There are 17 galaxies in the first group. Interestingly, all these galaxies have a single merger with a mass ratio between 1/10 and 1/4 and one more powerful merger with a mass ratio >1/4. Of course, there are several mergers with a mass ratio <1/10 for these galaxies. At ɀ = 0.5, 11 of them are barred, and at ɀ = 1.0, five galaxies are barred. It is important to note that the presence of bars in these galaxies at ɀ = 0.5 and ɀ = 1.0 does not guarantee reliable pattern speeds. Specifically, the number of galaxies with a reliable pattern speed is 17, eight, and four, respectively. The second group, which includes galaxies with a minor merging history, has 183 members. Tracing these galaxies to higher redshifts2 reveals that they are not necessarily barred at higher redshifts. At ɀ = 0.5, 139 members are barred, and at ɀ = 1.0, only 86 members are. The number of galaxies with a reliable pattern speed is 183, 116, and 55, respectively. Identifying galaxies that exhibit bars at all three redshifts and possess reliable pattern speeds would be beneficial. In this case, there are three galaxies within the first group that meet these criteria. Table 3 displays the pattern speeds of these galaxies at various redshifts. Interestingly, the pattern speed of the first two galaxies has notably accelerated from ɀ = 1.0 to ɀ = 0.0, contrary to the typical trend whereby bar pattern speeds tend to decrease over time. By checking the merger tree of these galaxies in more details, we find that the galaxy with ID 96765 has undergone a major merger with the stellar mass ratio —0.26 at ɀ ≃ 0.18. Similarly, the second one with ID 476266 has experienced a major merger with the stellar mass ratio -0.39 but at ɀ ≃ 0.64. The third galaxy with ID 371126 have a complex merger tree. This galaxy has undergone a major merger with the stellar mass ratio ≃0.38 at ɀ = 0.33 and a significant one with the stellar mass ratio ≃1 at ɀ = 0.15. A more detailed study is needed to investigate the effect of such mergers. To be specific, we shall consider the galaxies within the second group (that have undergone no major mergers) that exhibit bars at all redshifts and have reliable pattern speeds. This subset comprises 52 galaxies. The median pattern speeds for these galaxies are  km s−1 kpc−1 for ɀ = 1.0,0.5, and 0.0, respectively. A clear decreasing trend in pattern speeds over time is evident in these galaxies. There is only one galaxy (ID: 229935) in this subset whose pattern speed has significantly increased, from
  km s−1 kpc−1 at ɀ = 1.0 to
  km s−1 kpc−1 at ɀ = 0.0.
The analysis above highlights the impact of galaxy mergers on bar pattern speeds. It is observed that two out of three galaxies involved in major mergers deviate from the typical pattern speed evolution trend. However, it still can be inferred that mergers are not the primary factor contributing to the presence of slow bars in TNG50. This conclusion is supported by two key points: firstly, mergers can lead to an increase in the pattern speeds of galaxies; secondly, the majority of galaxies in our overall sample do not undergo major mergers within the redshift range ɀ ≤ 1. Specifically, within the second group, galaxies tend to exhibit slower patterns at ɀ = 0.0, despite lacking major mergers in their merger history.
It is useful to see the time evolution of a single galaxy from each group. The top row in Fig. 9 shows the redshift evolution of the stellar component of a galaxy with ID 476266 (at ɀ = 0.0), representing the first group characterized by major mergers. The radial expansion of the disk aligns with the findings of Izquierdo-Villalba et al. (2022), demonstrating that the disk galaxies’ scale length increases over time in TNG50 galaxies. As is detailed in Table 3, the pattern speed of this galaxy rises by approximately 319% from ɀ = 1.0 to ɀ = 0.0. This atypical behavior may be directly linked to the significant mergers experienced by the galaxy.
On the other hand, the second row in Fig. 9 shows the redshift evolution of the stellar component of a galaxy with ID 63869 (at ɀ = 0.0). This galaxy has been illustrated as a representative of the second group. In addition to the radial expansion, it is evident that the length of the bar increases over time. The pattern speed of this galaxy is Ωp ≃ 47.48, 43.54, and 25.02 km s−1 kpc−1 at ɀ = 1.0, 0.5, and 0.0, respectively. Therefore, the pattern speed decreases by a factor of 47% from ɀ = 1.0 to ɀ = 0.0, whereas the galaxy does not undergo any significant merging, so the reduction in the pattern speed of the bar is due to the secular evolution of the disk. One may think that the bar speed decreases due to the angular momentum transfer by the bar to the outer parts of the disk. This may seem sensible, since the disk expands in the radial direction. However, it is interesting to mention that, according to Izquierdo-Villalba et al. (2022), the radial scale length of the disks grows with time in TNG50 at almost the same rate for barred and unbarred disks, and this is even slower for barred galaxies (see Fig. 3 in Izquierdo-Villalba et al. (2022)). Furthermore, the paper suggests that unbarred galaxies in TNG50 are radially more extended compared to barred ones. This directly means that the radial expansion is not merely due to the angular momentum loss by the stellar bar. On the other hand, we show that the angular momentum exchange between the bar and dark matter halo is effectively happening and is the main reason for decreasing pattern speed.
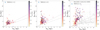 |
Fig. 7 Bar corotation radius vs. bar length for different redshifts. The color bar corresponds to the bar strength, |

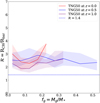 |
Fig. 8 Median value of the 𝓡 parameter illustrated in terms of the gas fraction for ɀ = 0.0, ɀ = 0.5, and ɀ = 1.0. The gas fraction was computed within twice the half-mass radius of the stellar disk. |
Pattern speeds of selected galaxies.
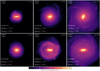 |
Fig. 9 The first row displays the redshift evolution of the stellar component taken from the first group with major mergers. The second row illustrates the evolution of a galaxy from the second group without significant mergers in its history. |
4 Discussion and conclusion
This paper investigates the redshift evolution of the bar fraction, bar length, and pattern speed of TNG50 galaxies. Regarding the bar fraction, we confirm the already-known problem that cosmological simulations lack bars in less massive galaxies. Furthermore, we have shown that the bar fraction increases with redshift for galaxies in the stellar mass range of M* ≳ 1010 M⊙. This also seems inconsistent with the observations, which imply the opposite.
Regarding the bar length, we found two specific features: i) the median value of the bar length decreases with redshift; ii) there is no specific correlation between the bar length and stellar mass at a given redshift. The comparison of both features with relevant observations reveals a conflict with the observations. To assess the second feature, we have utilized a sample of galaxies from the MaNGA and CALIFA surveys, and demonstrated a clear discrepancy between bar lengths in TNG50 and observations. We have also discussed similar results that have previously been reported in the literature.
The pattern speed evolution in TNG50 is the main purpose of this paper. The median value of the pattern speed changes with redshift. To be specific, the mean pattern speed is around  km s−1 kpc−1 at ɀ = 1.0. It decreases by a factor of more than 50% and reaches
  km s−1 kpc−1 at redshift ɀ = 0.0. The distribution of Ωp at different redshifts is illustrated in Fig. 10. It is seen that the median value of Ωp decreases with time. It is worth noting that there are only two galaxies with Ωp < 9.7 km s−1 kpc−1 in the entire sample of galaxies with masses of M* ≥ 1010 M⊙ at all three redshifts.
In this study, we have analyzed three galaxy populations at redshifts of ɀ = 0.0, 0.5, and 1.0 to compare their bar pattern characteristics, mirroring observational practices. Our focus is not on tracking the evolution of individual galaxies. Figure 11 illustrates that these populations exhibit similar mass distributions, indicating no bias in mass across the three groups.
To investigate the impact of galaxy mergers on the deceleration of pattern speed, we categorized TNG50 galaxies into two groups. The first group comprises galaxies that have undergone major mergers in their history, while the second group comprises ones that have not. Among these groups, only three galaxies in the first group exhibit bar structures at all three redshifts and possess reliable pattern speeds. Notably, for two of these galaxies, the pattern speed undergoes a notable increase over time, indicating that major mergers can amplify the rotational speed of galactic bars. Conversely, the second group includes 52 galaxies with barred structures at ɀ ≤ 1 and reliable pattern speeds, in which the average pattern speed decreases over time. This suggests that the majority of the galaxies in our entire sample do not undergo major mergers within the redshift range ɀ ≤ 1, implying that the decline in average pattern speed is not linked to intergalactic mergers. Furthermore, we have studied the role of the gas fraction. We show that the 𝓡 parameter does not correlate with the gas fraction. This means that in TNG50, the existence of gas does not alleviate the fast bar tension.
Our results reveal a clear prediction by the standard cosmological model that the mean pattern speed of barred galaxies must be much higher at high redshifts (ɀ ~ 1). Currently, since the pattern speed observations are limited to nearby galaxies, it is not possible to check the viability of this prediction. Future high-redshift observations would shed light on this issue.
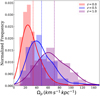 |
Fig. 10 Normalized histogram of the pattern speed at different ɀ: the vertical dashed lines show the median values of the pattern speed for every histogram, while the full lines are kernel density estimates of these histograms at different redshifts. |
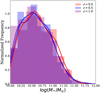 |
Fig. 11 Distribution of the stellar mass at different redshifts. It is seen there is no bias and the same range of masses are considered at different redshifts. |
Acknowledgements
We appreciate Tahere Kashfi for providing us with the gas fraction data in TNG50 galaxies at ɀ = 0.0. The work of Asiyeh Habibi, Mahmood Roshan, and Sharam Abbassi is supported by the Ferdowsi University of Mashhad. The main part of the calculation was conducted at the Sci-HPC center of the Ferdowsi University of Mashhad. The research ofJ. Alfonso L. Aguerri has been supported by the Spanish Ministry of Ciencia e Innovación under the grant PID2020-119342GB-I00. Virginia Cuomo acknowledges the support provided by Chilean ANID through 2022 FONDECYT postdoctoral research grant no. 3220206.
References
- Aguerri, J. A. L., Muñoz-Tuñón, C., Varela, A. M., & Prieto, M. 2000, A&A, 361, 841 [NASA ADS] [Google Scholar]
- Aguerri, J. A. L., Méndez-Abreu, J., & Corsini, E. M. 2009, A&A, 495, 491 [NASA ADS] [CrossRef] [EDP Sciences] [Google Scholar]
- Algorry, D. G., Navarro, J. F., Abadi, M. G., et al. 2017, MNRAS, 469, 1054 [Google Scholar]
- Ansar, S., Sanderson, R., & Pearson, S. 2022, in AAS/Division of Dynamical Astronomy Meeting, 54, 400.02 [NASA ADS] [Google Scholar]
- Athanassoula, E. 1992, MNRAS, 259, 328 [NASA ADS] [CrossRef] [Google Scholar]
- Athanassoula, E. 2002, ApJ, 569, L83 [NASA ADS] [CrossRef] [Google Scholar]
- Athanassoula, E., Machado, R. E. G., & Rodionov, S. A. 2013, MNRAS, 429, 1949 [Google Scholar]
- Barazza, F. D., Jogee, S., & Marinova, I. 2008, ApJ, 675, 1194 [Google Scholar]
- Beane, A., Hernquist, L., D’Onghia, E., et al. 2023, ApJ, 953, 173 [NASA ADS] [CrossRef] [Google Scholar]
- Berentzen, I., Shlosman, I., Martinez-Valpuesta, I., & Heller, C. H. 2007, ApJ, 666, 189 [Google Scholar]
- Bi, D., Shlosman, I., & Romano-Díaz, E. 2022, ApJ, 934, 52 [NASA ADS] [CrossRef] [Google Scholar]
- Bitsakis, T., Sánchez, S. F., Ciesla, L., et al. 2019, MNRAS, 483, 370 [NASA ADS] [CrossRef] [Google Scholar]
- Bournaud, F., Combes, F., & Semelin, B. 2005, MNRAS, 364, L18 [Google Scholar]
- Bundy, K., Bershady, M. A., Law, D. R., et al. 2015, ApJ, 798, 7 [Google Scholar]
- Cameron, E., Carollo, C. M., Oesch, P., et al. 2010, MNRAS, 409, 346 [NASA ADS] [CrossRef] [Google Scholar]
- Contopoulos, G. 1980, A&A, 81, 198 [NASA ADS] [Google Scholar]
- Cuomo, V., Aguerri, J. A. L., Corsini, E. M., & Debattista, V. P. 2020, A&A, 641, A111 [EDP Sciences] [Google Scholar]
- Debattista, V. P., & Sellwood, J. A. 2000, ApJ, 543, 704 [Google Scholar]
- Dehnen, W., Semczuk, M., & Schönrich, R. 2023, MNRAS, 518, 2712 [Google Scholar]
- Díaz-García, S., Salo, H., Laurikainen, E., & Herrera-Endoqui, M. 2016, A&A, 587, A160 [NASA ADS] [CrossRef] [EDP Sciences] [Google Scholar]
- Eisert, L., Pillepich, A., Nelson, D., et al. 2023, MNRAS, 519, 2199 [Google Scholar]
- Erwin, P. 2018, MNRAS, 474, 5372 [Google Scholar]
- Erwin, P. 2019, MNRAS, 489, 3553 [NASA ADS] [CrossRef] [Google Scholar]
- Eskridge, P. B., Frogel, J. A., Pogge, R. W., et al. 2000, AJ, 119, 536 [NASA ADS] [CrossRef] [Google Scholar]
- Fragkoudi, F., Grand, R. J. J., Pakmor, R., et al. 2021, A&A, 650, L16 [NASA ADS] [CrossRef] [EDP Sciences] [Google Scholar]
- Frankel, N., Pillepich, A., Rix, H.-W., et al. 2022, ApJ, 940, 61 [CrossRef] [Google Scholar]
- Fux, R. 1999, A&A, 345, 787 [NASA ADS] [Google Scholar]
- Garma-Oehmichen, L., Cano-Díaz, M., Hernández-Toledo, H., et al. 2020, MNRAS, 491, 3655 [Google Scholar]
- Garma-Oehmichen, L., Hernández-Toledo, H., Aquino-Ortíz, E., et al. 2022, MNRAS, 517, 5660 [NASA ADS] [CrossRef] [Google Scholar]
- Géron, T., Smethurst, R. J., Lintott, C., et al. 2023, arXiv e-prints [arXiv:2302.05464] [Google Scholar]
- Grand, R. J. J., Gómez, F. A., Marinacci, F., et al. 2017, MNRAS, 467, 179 [NASA ADS] [Google Scholar]
- Guo, Y., Jogee, S., Finkelstein, S. L., et al. 2023, ApJ, 945, L10 [NASA ADS] [CrossRef] [Google Scholar]
- Hui, L., Ostriker, J. P., Tremaine, S., & Witten, E. 2017, Phys. Rev. D, 95, 043541 [NASA ADS] [CrossRef] [Google Scholar]
- Izquierdo-Villalba, D., Bonoli, S., Rosas-Guevara, Y., et al. 2022, MNRAS, 514, 1006 [NASA ADS] [CrossRef] [Google Scholar]
- Kashfi, T., Roshan, M., & Famaey, B. 2023, MNRAS, 519, L21 [Google Scholar]
- Kauffmann, G., Nelson, D., Borthakur, S., et al. 2019, MNRAS, 486, 4686 [NASA ADS] [CrossRef] [Google Scholar]
- Kim, T., Athanassoula, E., Sheth, K., et al. 2021, ApJ, 922, 196 [NASA ADS] [CrossRef] [Google Scholar]
- Laurikainen, E., Salo, H., Buta, R., & Vasylyev, S. 2004, MNRAS, 355, 1251 [Google Scholar]
- Lelli, F., McGaugh, S. S., & Schombert, J. M. 2016, AJ, 152, 157 [Google Scholar]
- Marinova, I., & Jogee, S. 2007, ApJ, 659, 1176 [Google Scholar]
- Masters, K. L., Nichol, R. C., Haynes, M. P., et al. 2012, MNRAS, 424, 2180 [Google Scholar]
- Melvin, T., Masters, K., Lintott, C., et al. 2014, MNRAS, 438, 2882 [Google Scholar]
- Menéndez-Delmestre, K., Sheth, K., Schinnerer, E., Jarrett, T. H., & Scoville, N. Z. 2007, ApJ, 657, 790 [Google Scholar]
- Nair, P. B., & Abraham, R. G. 2010, ApJS, 186, 427 [Google Scholar]
- Nelson, D., Pillepich, A., Springel, V., et al. 2019a, MNRAS, 490, 3234 [Google Scholar]
- Nelson, D., Springel, V., Pillepich, A., et al. 2019b, Computat. Astrophys. Cosmol., 6, 2 [NASA ADS] [CrossRef] [Google Scholar]
- Oh, S., Oh, K., & Yi, S. K. 2011, ApJS, 198, 4 [Google Scholar]
- Ohta, K., Hamabe, M., & Wakamatsu, K.-I. 1990, ApJ, 357, 71 [Google Scholar]
- Ostriker, J. P., & Peebles, P. J. E. 1973, ApJ, 186, 467 [Google Scholar]
- Pérez, I., Aguerri, J. A. L., & Méndez-Abreu, J. 2012, A&A, 540, A103 [NASA ADS] [CrossRef] [EDP Sciences] [Google Scholar]
- Peschken, N., & Lokas, E. L. 2019, MNRAS, 483, 2721 [NASA ADS] [CrossRef] [Google Scholar]
- Pillepich, A., Nelson, D., Springel, V., et al. 2019, MNRAS, 490, 3196 [Google Scholar]
- Reddish, J., Kraljic, K., Petersen, M. S., et al. 2022, MNRAS, 512, 160 [NASA ADS] [CrossRef] [Google Scholar]
- Rodriguez-Gomez, V., Genel, S., Vogelsberger, M., et al. 2015, MNRAS, 449, 49 [Google Scholar]
- Rogers, K. K., & Peiris, H. V. 2021, Phys. Rev. Lett., 126, 071302 [NASA ADS] [CrossRef] [Google Scholar]
- Rosas-Guevara, Y., Bonoli, S., Dotti, M., et al. 2020, MNRAS, 491, 2547 [NASA ADS] [Google Scholar]
- Rosas-Guevara, Y., Bonoli, S., Dotti, M., et al. 2022, MNRAS, 512, 5339 [NASA ADS] [CrossRef] [Google Scholar]
- Roshan, M., Banik, I., Ghafourian, N., et al. 2021a, MNRAS, 503, 2833 [NASA ADS] [CrossRef] [Google Scholar]
- Roshan, M., Ghafourian, N., Kashfi, T., et al. 2021b, MNRAS, 508, 926 [NASA ADS] [CrossRef] [Google Scholar]
- Sánchez, S. F., Kennicutt, R. C., Gil de Paz, A., et al. 2012, A&A, 538, A8 [Google Scholar]
- Sánchez, S. F., Barrera-Ballesteros, J. K., Lacerda, E., et al. 2022, ApJS, 262, 36 [CrossRef] [Google Scholar]
- Sellwood, J. A. 2014a, arXiv e-prints [arXiv:1406.6606] [Google Scholar]
- Sellwood, J. A. 2014b, Rev. Mod. Phys., 86, 1 [Google Scholar]
- Seo, W.-Y., Kim, W.-T., Kwak, S., et al. 2019, ApJ, 872, 5 [NASA ADS] [CrossRef] [Google Scholar]
- Sheth, K., Regan, M. W., Scoville, N. Z., & Strubbe, L. E. 2003, ApJ, 592, L13 [NASA ADS] [CrossRef] [Google Scholar]
- Sheth, K., Elmegreen, D. M., Elmegreen, B. G., et al. 2008, ApJ, 675, 1141 [Google Scholar]
- Sheth, K., Melbourne, J., Elmegreen, D. M., et al. 2012, ApJ, 758, 136 [NASA ADS] [CrossRef] [Google Scholar]
- Simmons, B. D., Melvin, T., Lintott, C., et al. 2014, MNRAS, 445, 3466 [NASA ADS] [CrossRef] [Google Scholar]
- Sotillo-Ramos, D., Pillepich, A., Donnari, M., et al. 2022, MNRAS, 516, 5404 [NASA ADS] [CrossRef] [Google Scholar]
- Tremaine, S., & Weinberg, M. D. 1984, ApJ, 282, L5 [Google Scholar]
- Weinberg, M. D. 1985, MNRAS, 213, 451 [Google Scholar]
- Whyte, L. F., Abraham, R. G., Merrifield, M. R., et al. 2002, MNRAS, 336, 1281 [NASA ADS] [CrossRef] [Google Scholar]
- Zhao, D., Du, M., Ho, L. C., Debattista, V. P., & Shi, J. 2020, ApJ, 904, 170 [Google Scholar]
- Zhou, Z.-B., Zhu, W., Wang, Y., & Feng, L.-L. 2020, ApJ, 895, 92 [Google Scholar]
Private communication with Angus Beane.
The IDs of the galaxies change with time. For each galaxy at z = 0.0, we first find its corresponding IDs at higher redshifts and then check its bar properties.
All Tables
All Figures
|
Fig. 1 Properties of Galaxy ID 21 in TNG50 at ɀ = 1.0 as a representative. The upper left panel shows A2(R). The dashed horizontal line indicates |
| In the text | |
|
Fig. 2 Bar fraction vs. stellar mass at ɀ = 0.0, ɀ = 0.5, and ɀ = 1.0 in TNG50. The dashed curve indicates the fit to observations given in Erwin (2018). We have taken this curve from Zhao et al. (2020). The binomials errors on the bar fractions are defined using the bar fraction and the number of total disks, i.e., ndisk, in each mass interval bin as |
| In the text | |
|
Fig. 3 Solid lines displaying the median value of the bar radius in kiloparsecs vs. stellar mass for TNG50 at ɀ = 0.0, ɀ = 0.5, and ɀ = 1.0 and for the observed CALIFA+MaNGA sample at ɀ ≃ 0.0. We have included 20 additional galaxies from CALIFA and MaNGA that do not meet the condition ΔΩp/Ωp ≤ 0.5 but satisfy ΔRbar/Rbar ≤ 0.5. The shaded areas give the 32th– 68th percentile. We only display mass bins that include more than five galaxies. We plot the same regions for other similar figures in this paper. |
| In the text | |
|
Fig. 4 Solid lines displaying the median value of the scaled bar radius, Rbar/Rp, vs. stellar mass for TNG50 at ɀ = 0.0 and for the observed CALIFA+MaNGA sample at ɀ ≃ 0.0. Rp is the Petrosian radius used as an indicator for the radial size of the galaxies. |
| In the text | |
|
Fig. 5 Solid lines displaying the median value of the bar pattern speed vs. stellar mass for TNG50 at different redshifts, ɀ = 0.0, ɀ = 0.5, and ɀ = 1.0, and for the observed CALIFA + MaNGA sample at ɀ ≃ 0.0. There are 60 galaxies in this sample with ΔΩp/Ωp ≤ 0.5 that are included in this figure. |
| In the text | |
|
Fig. 6 Solid lines displaying the median value of the 𝓡 parameter vs. stellar mass for TNG50 at different redshifts, ɀ = 0.0, ɀ = 0.5, and ɀ = 1.0, and for the observed 60 galaxies with ΔΩp/Ωp ≤ 0.5 in the CALIFA + MaNGA sample at ɀ ≃ 0.0. |
| In the text | |
|
Fig. 7 Bar corotation radius vs. bar length for different redshifts. The color bar corresponds to the bar strength, |
| In the text | |
|
Fig. 8 Median value of the 𝓡 parameter illustrated in terms of the gas fraction for ɀ = 0.0, ɀ = 0.5, and ɀ = 1.0. The gas fraction was computed within twice the half-mass radius of the stellar disk. |
| In the text | |
|
Fig. 9 The first row displays the redshift evolution of the stellar component taken from the first group with major mergers. The second row illustrates the evolution of a galaxy from the second group without significant mergers in its history. |
| In the text | |
|
Fig. 10 Normalized histogram of the pattern speed at different ɀ: the vertical dashed lines show the median values of the pattern speed for every histogram, while the full lines are kernel density estimates of these histograms at different redshifts. |
| In the text | |
|
Fig. 11 Distribution of the stellar mass at different redshifts. It is seen there is no bias and the same range of masses are considered at different redshifts. |
| In the text | |
Current usage metrics show cumulative count of Article Views (full-text article views including HTML views, PDF and ePub downloads, according to the available data) and Abstracts Views on Vision4Press platform.
Data correspond to usage on the plateform after 2015. The current usage metrics is available 48-96 hours after online publication and is updated daily on week days.
Initial download of the metrics may take a while.