Fig. 2
Download original image
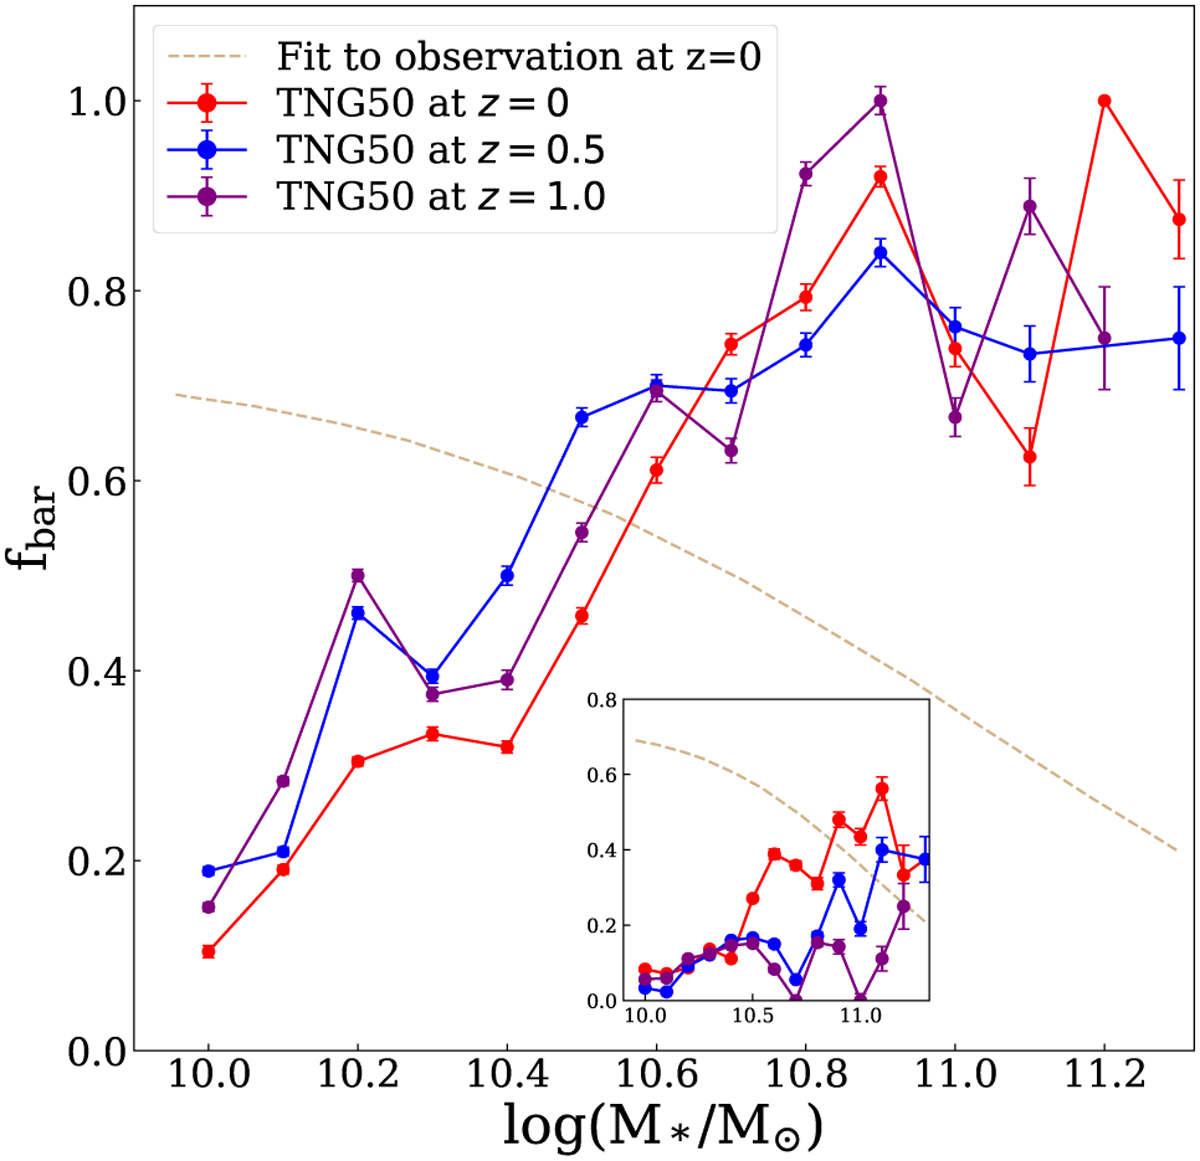
Bar fraction vs. stellar mass at ɀ = 0.0, ɀ = 0.5, and ɀ = 1.0 in TNG50. The dashed curve indicates the fit to observations given in Erwin (2018). We have taken this curve from Zhao et al. (2020). The binomials errors on the bar fractions are defined using the bar fraction and the number of total disks, i.e., ndisk, in each mass interval bin as ![]() (Rosas-Guevara et al. 2022). The curve for ɀ = 0.0 differs slightly from that shown in Fig. 1 of Roshan et al. (2021b), where the condition F ≤ 0.5 was used instead of F ≤ 0.7. The inset plot displays the bar fraction for bars longer than 2 kpc. This plot is useful because very short bars may not be detected in observations.
(Rosas-Guevara et al. 2022). The curve for ɀ = 0.0 differs slightly from that shown in Fig. 1 of Roshan et al. (2021b), where the condition F ≤ 0.5 was used instead of F ≤ 0.7. The inset plot displays the bar fraction for bars longer than 2 kpc. This plot is useful because very short bars may not be detected in observations.
Current usage metrics show cumulative count of Article Views (full-text article views including HTML views, PDF and ePub downloads, according to the available data) and Abstracts Views on Vision4Press platform.
Data correspond to usage on the plateform after 2015. The current usage metrics is available 48-96 hours after online publication and is updated daily on week days.
Initial download of the metrics may take a while.