Fig. 3
Download original image
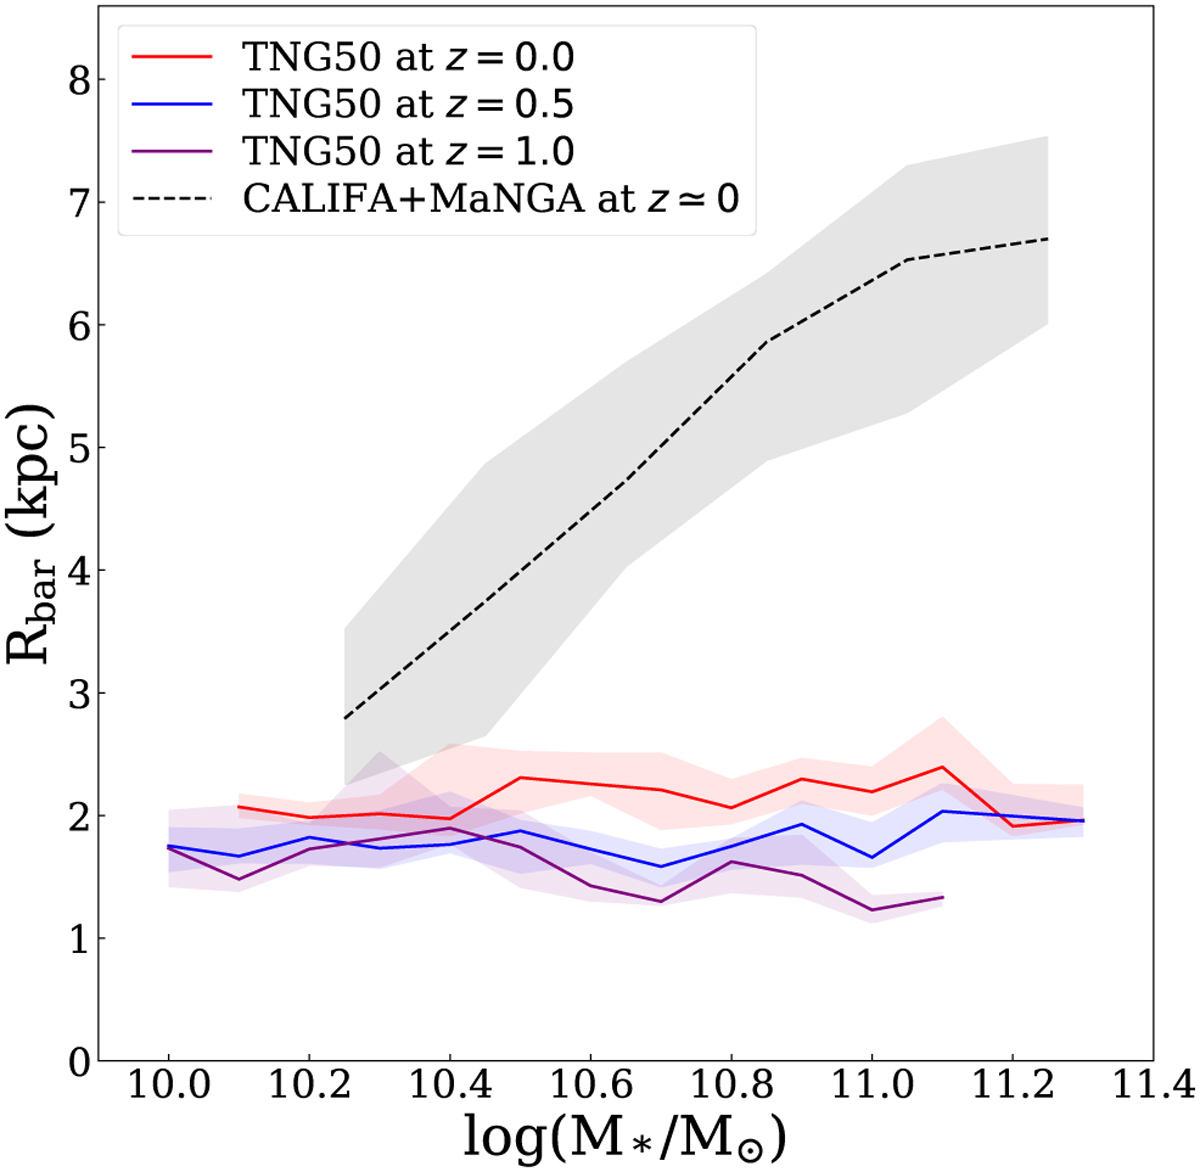
Solid lines displaying the median value of the bar radius in kiloparsecs vs. stellar mass for TNG50 at ɀ = 0.0, ɀ = 0.5, and ɀ = 1.0 and for the observed CALIFA+MaNGA sample at ɀ ≃ 0.0. We have included 20 additional galaxies from CALIFA and MaNGA that do not meet the condition ΔΩp/Ωp ≤ 0.5 but satisfy ΔRbar/Rbar ≤ 0.5. The shaded areas give the 32th– 68th percentile. We only display mass bins that include more than five galaxies. We plot the same regions for other similar figures in this paper.
Current usage metrics show cumulative count of Article Views (full-text article views including HTML views, PDF and ePub downloads, according to the available data) and Abstracts Views on Vision4Press platform.
Data correspond to usage on the plateform after 2015. The current usage metrics is available 48-96 hours after online publication and is updated daily on week days.
Initial download of the metrics may take a while.