Open Access
Fig. 9
Download original image
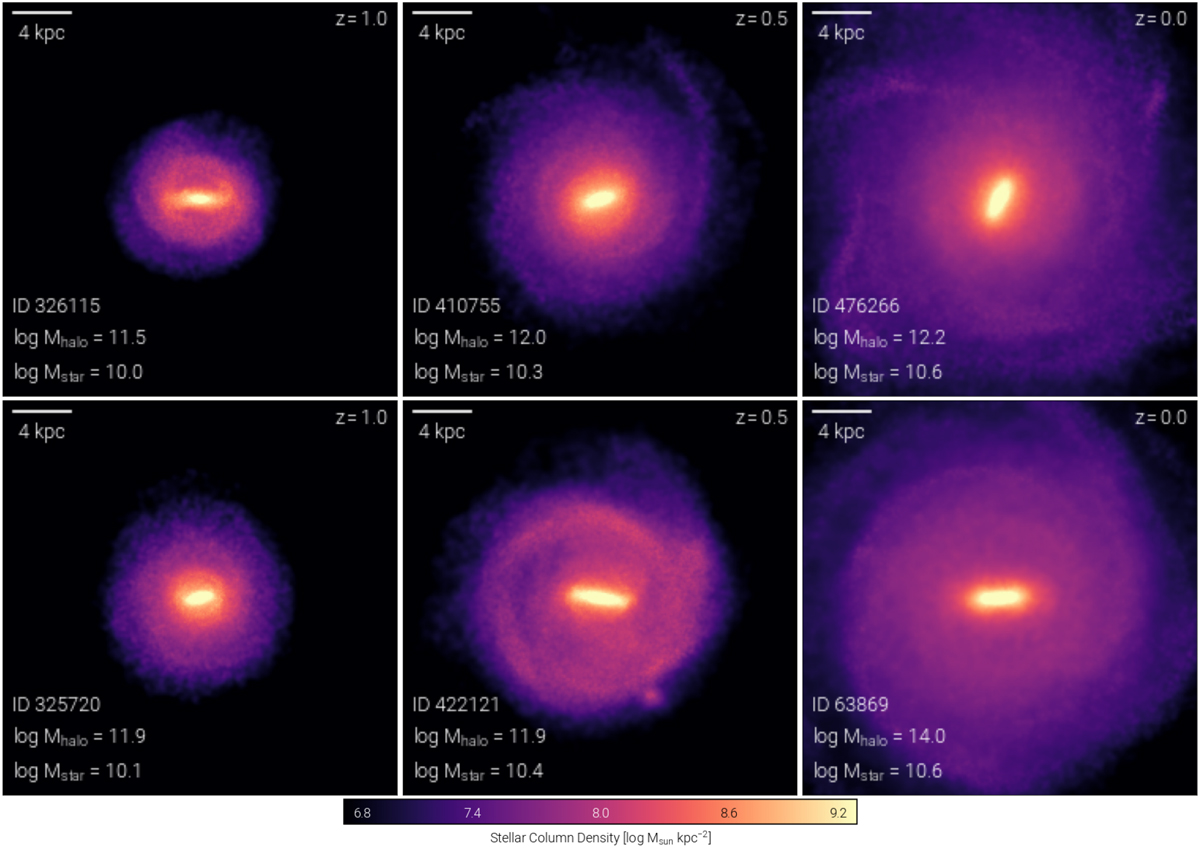
The first row displays the redshift evolution of the stellar component taken from the first group with major mergers. The second row illustrates the evolution of a galaxy from the second group without significant mergers in its history.
Current usage metrics show cumulative count of Article Views (full-text article views including HTML views, PDF and ePub downloads, according to the available data) and Abstracts Views on Vision4Press platform.
Data correspond to usage on the plateform after 2015. The current usage metrics is available 48-96 hours after online publication and is updated daily on week days.
Initial download of the metrics may take a while.