Fig. 7
Download original image
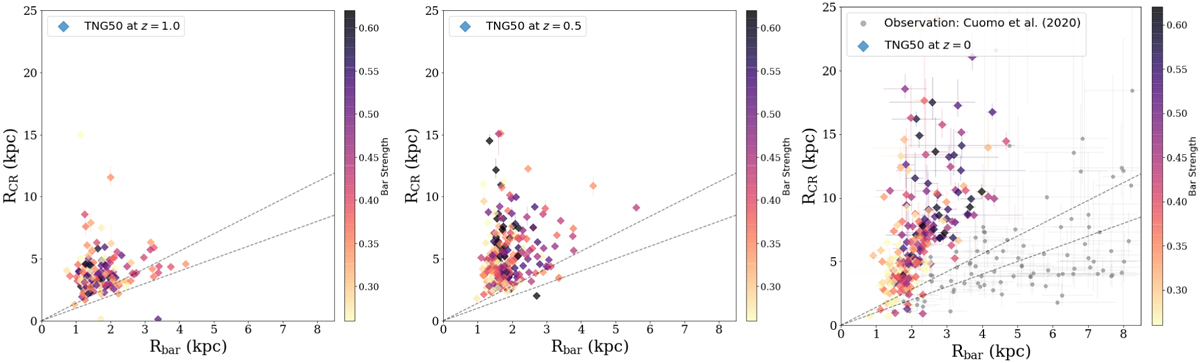
Bar corotation radius vs. bar length for different redshifts. The color bar corresponds to the bar strength, ![]() . The upper dashed line indicates the fast-slow bar zone. The lower dashed line corresponds to 𝓡 = 1, which indicates the ultrafast bar region. The gray points represent the observation of 60 galaxies with ΔΩp/Ωp ≤ 0.5 in the CALIFA + MaNGA sample at ɀ ≃ 0.0. The right panel bears a resemblance to that of Fig. 5 in the Roshan et al. (2021b). It has been included here to facilitate a more straightforward comparison across the three redshifts.
. The upper dashed line indicates the fast-slow bar zone. The lower dashed line corresponds to 𝓡 = 1, which indicates the ultrafast bar region. The gray points represent the observation of 60 galaxies with ΔΩp/Ωp ≤ 0.5 in the CALIFA + MaNGA sample at ɀ ≃ 0.0. The right panel bears a resemblance to that of Fig. 5 in the Roshan et al. (2021b). It has been included here to facilitate a more straightforward comparison across the three redshifts.
Current usage metrics show cumulative count of Article Views (full-text article views including HTML views, PDF and ePub downloads, according to the available data) and Abstracts Views on Vision4Press platform.
Data correspond to usage on the plateform after 2015. The current usage metrics is available 48-96 hours after online publication and is updated daily on week days.
Initial download of the metrics may take a while.