Fig. 1
Download original image
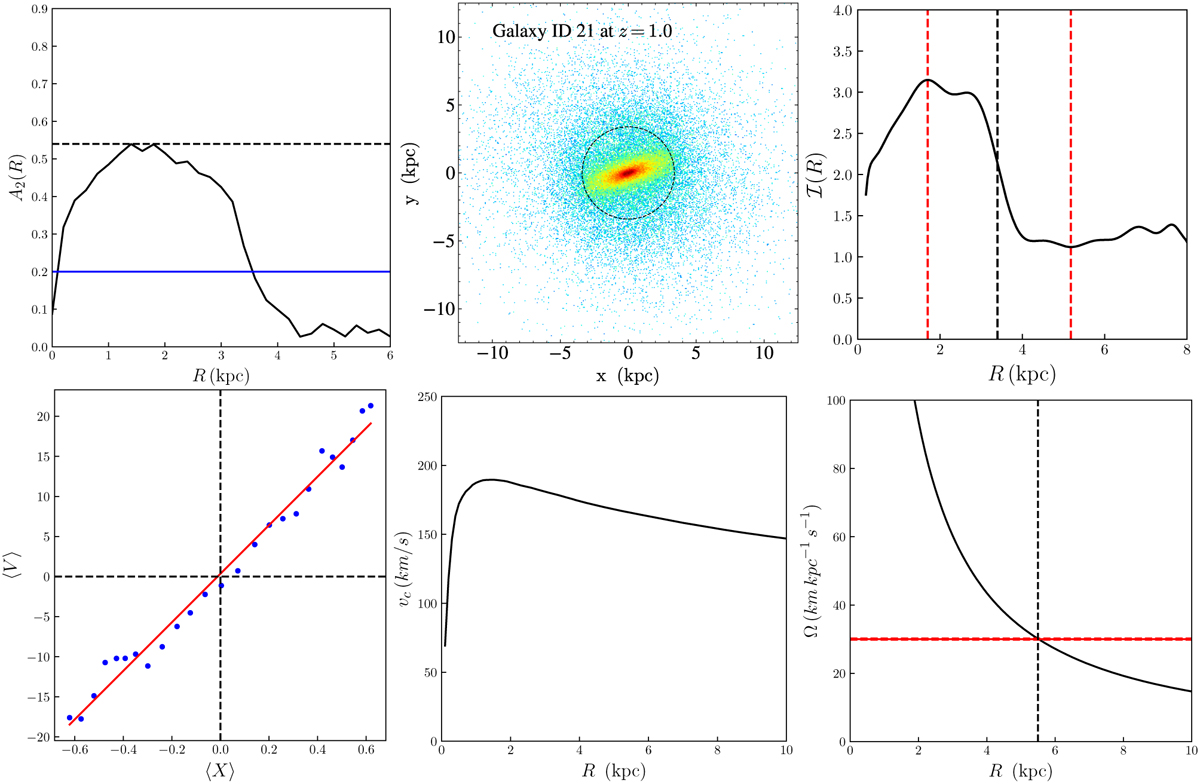
Properties of Galaxy ID 21 in TNG50 at ɀ = 1.0 as a representative. The upper left panel shows A2(R). The dashed horizontal line indicates ![]() . The horizontal blue line A2 = 0.2 indicates the border between unbarred and barred galaxies. The upper middle panel is the projected face-on view of the galaxy. The dashed circle indicates the bar radius obtained by the Fourier analysis. In the right panel, the characteristics of the Fourier method to measure the bar length are illustrated. The vertical red lines show the position of the minimum and maximum values of ℑ(R). On the other hand, the dashed black line indicates the semi-major axis of the bar. The lower left panel illustrates the TW method when Ns = 25. The slope gives the pattern speed. The lower middle panel is the total rotation curve. The right panel is the angular velocity. The dashed red line is the pattern speed of the bar and the vertical dashed line indicates the location of the corotation radius.
. The horizontal blue line A2 = 0.2 indicates the border between unbarred and barred galaxies. The upper middle panel is the projected face-on view of the galaxy. The dashed circle indicates the bar radius obtained by the Fourier analysis. In the right panel, the characteristics of the Fourier method to measure the bar length are illustrated. The vertical red lines show the position of the minimum and maximum values of ℑ(R). On the other hand, the dashed black line indicates the semi-major axis of the bar. The lower left panel illustrates the TW method when Ns = 25. The slope gives the pattern speed. The lower middle panel is the total rotation curve. The right panel is the angular velocity. The dashed red line is the pattern speed of the bar and the vertical dashed line indicates the location of the corotation radius.
Current usage metrics show cumulative count of Article Views (full-text article views including HTML views, PDF and ePub downloads, according to the available data) and Abstracts Views on Vision4Press platform.
Data correspond to usage on the plateform after 2015. The current usage metrics is available 48-96 hours after online publication and is updated daily on week days.
Initial download of the metrics may take a while.